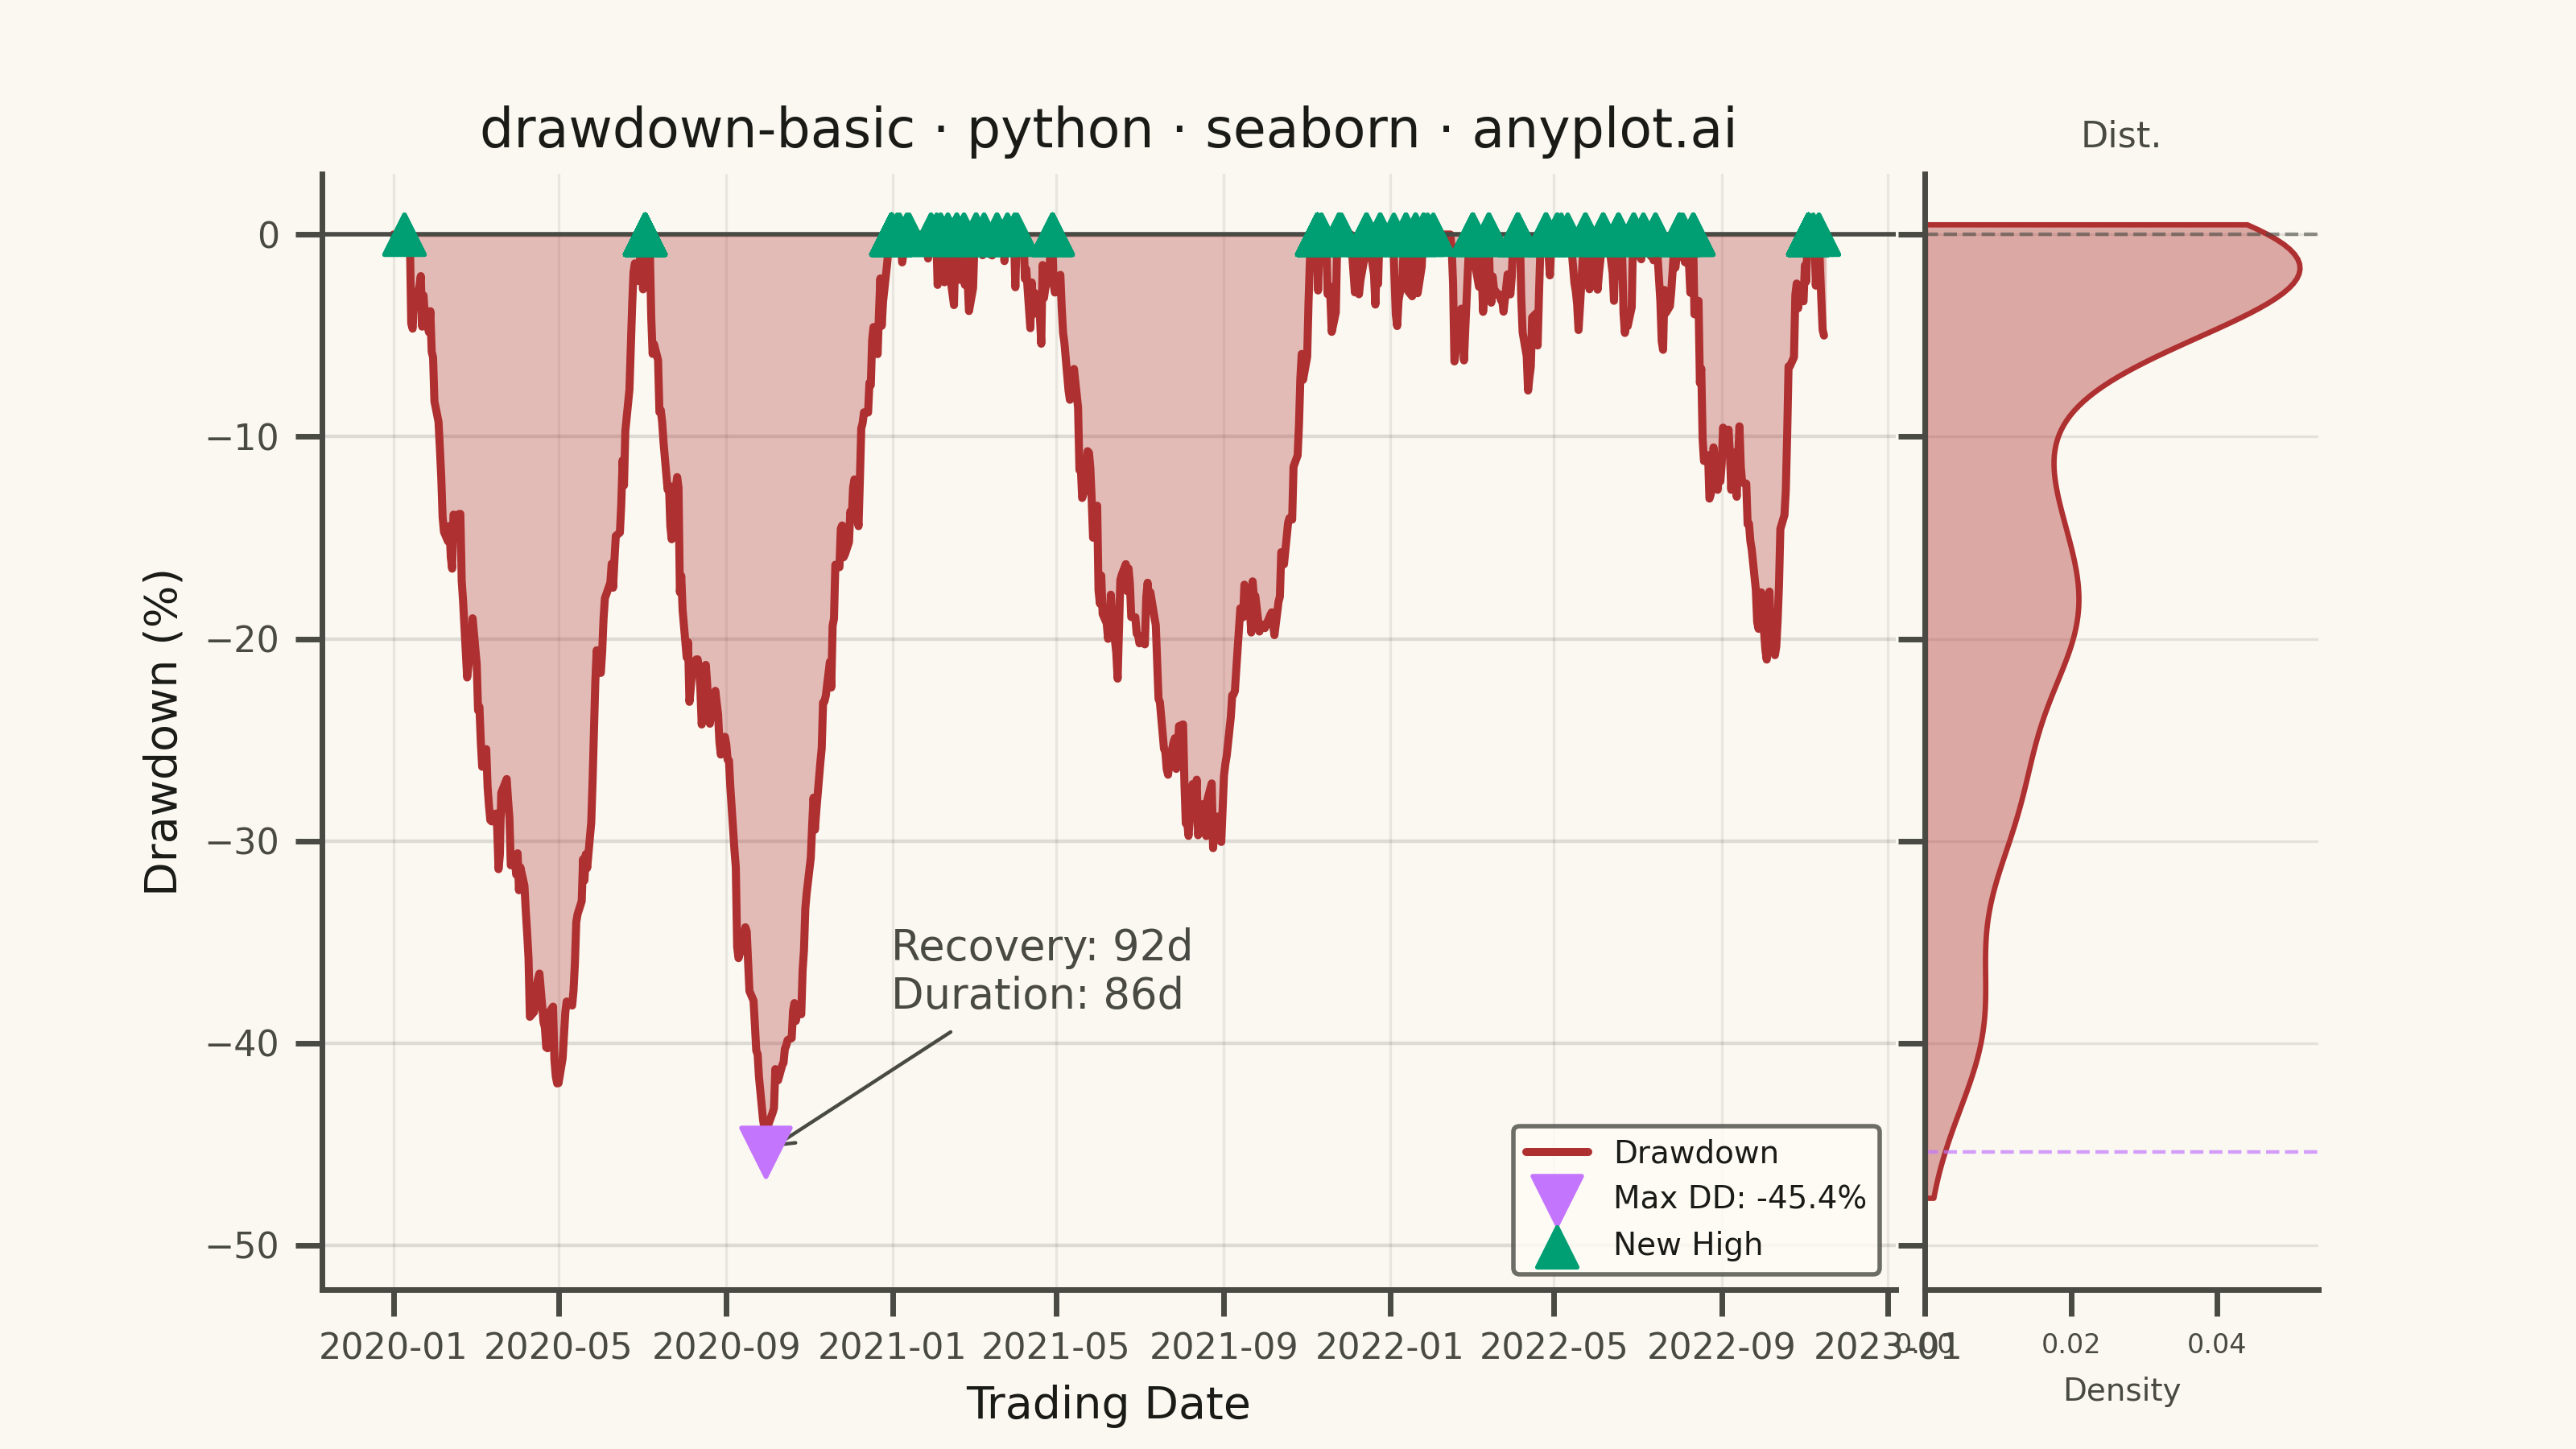
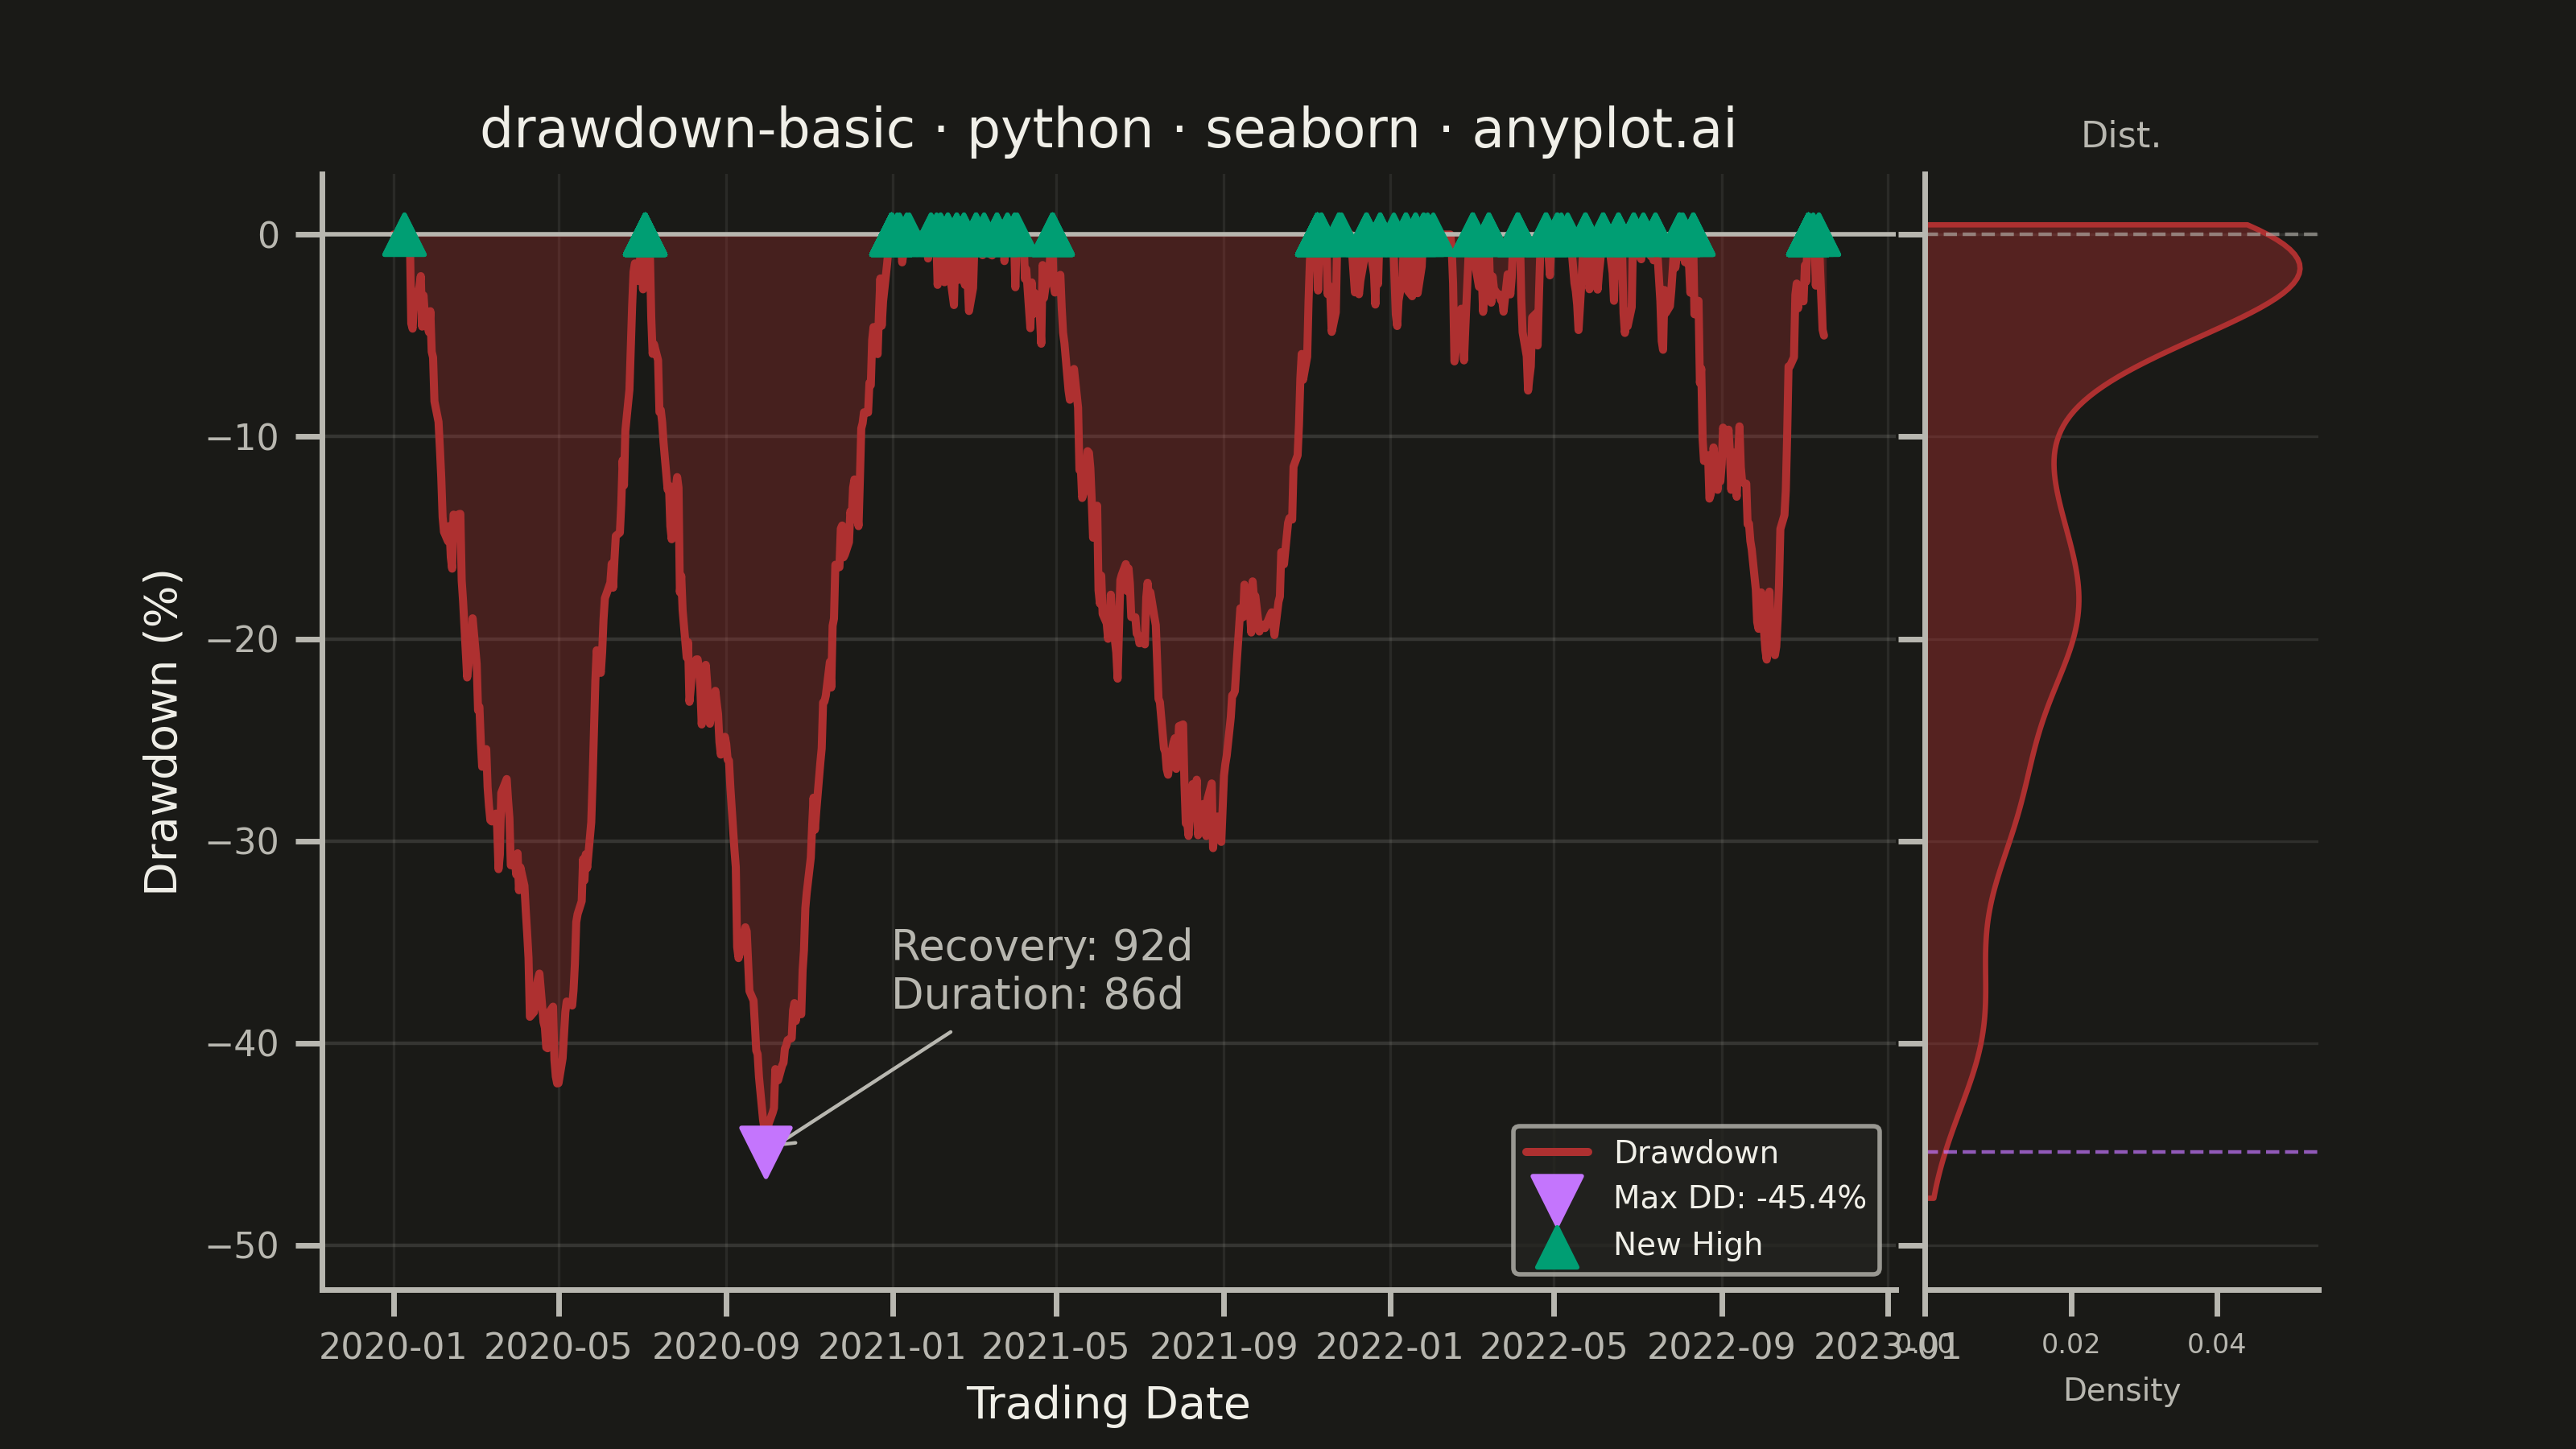
A drawdown chart visualizes the percentage decline from peak value over time, showing how far an investment or asset has fallen from its highest point. This chart is essential for risk assessment and understanding the magnitude of losses during unfavorable market periods. The filled area below the zero line emphasizes the depth and duration of drawdowns, making it easy to identify maximum drawdown periods and recovery points.
""" anyplot.ai
drawdown-basic: Drawdown Chart
Library: seaborn 0.13.2 | Python 3.13.13
Quality: 86/100 | Updated: 2026-05-23
"""

import os

import matplotlib.pyplot as plt
import numpy as np
import pandas as pd
import seaborn as sns
from matplotlib.gridspec import GridSpec


# Theme tokens
THEME = os.getenv("ANYPLOT_THEME", "light")
PAGE_BG = "#FAF8F1" if THEME == "light" else "#1A1A17"
ELEVATED_BG = "#FFFDF6" if THEME == "light" else "#242420"
INK = "#1A1A17" if THEME == "light" else "#F0EFE8"
INK_SOFT = "#4A4A44" if THEME == "light" else "#B8B7B0"

# Semantic palette: loss/drawdown → red, recovery/new high → green, emphasis → purple
DRAWDOWN_COLOR = "#AE3030"  # anyplot position 3 — loss (semantic)
RECOVERY_COLOR = "#009E73"  # anyplot position 1 — gain/new high (semantic)
MAX_DD_COLOR = "#C475FD"  # anyplot position 2 — max drawdown emphasis

sns.set_theme(
    style="ticks",
    rc={
        "figure.facecolor": PAGE_BG,
        "axes.facecolor": PAGE_BG,
        "axes.edgecolor": INK_SOFT,
        "axes.labelcolor": INK,
        "text.color": INK,
        "xtick.color": INK_SOFT,
        "ytick.color": INK_SOFT,
        "grid.color": INK,
        "grid.alpha": 0.13,
        "legend.facecolor": ELEVATED_BG,
        "legend.edgecolor": INK_SOFT,
    },
)

# Data: Synthetic energy commodity index with demand-shock crash and recovery
np.random.seed(99)
n_days = 750
dates = pd.date_range("2020-01-01", periods=n_days, freq="B")

daily_returns = np.random.normal(0.0003, 0.018, n_days)
daily_returns[20:80] -= 0.008  # demand shock crash
daily_returns[80:130] += 0.004  # partial bounce
daily_returns[130:200] -= 0.004  # extended weakness
daily_returns[200:330] += 0.009  # supply-cut driven recovery
daily_returns[330:420] -= 0.005  # demand uncertainty
daily_returns[420:600] += 0.005  # sustained recovery

price = 100 * np.cumprod(1 + daily_returns)

# Calculate drawdown
running_max = np.maximum.accumulate(price)
drawdown = (price - running_max) / running_max * 100

df = pd.DataFrame({"Date": dates, "Price": price, "Drawdown": drawdown})

# Max drawdown statistics
max_dd_idx = df["Drawdown"].idxmin()
max_dd_value = df["Drawdown"].min()
max_dd_date = df.loc[max_dd_idx, "Date"]

# Max drawdown duration: days from most recent peak to the trough
peak_idx = df.loc[:max_dd_idx, "Price"].idxmax()
peak_date = df.loc[peak_idx, "Date"]
max_dd_duration = (max_dd_date - peak_date).days

# Recovery time from max drawdown trough to first new high
df_after_max = df.loc[max_dd_idx + 1 :]
first_new_high = df_after_max[df_after_max["Drawdown"] >= 0]
recovery_days = None
if len(first_new_high) > 0:
    recovery_date = df.loc[first_new_high.index[0], "Date"]
    recovery_days = (recovery_date - max_dd_date).days

# Recovery markers: one per distinct drawdown period (not per crossing)
# Find end of each contiguous negative-drawdown block, then first date where DD >= 0
in_dd = df["Drawdown"] < 0
period_end_mask = in_dd & (~in_dd.shift(-1).fillna(False))
period_end_indices = df.index[period_end_mask].tolist()
distinct_recovery_dates = []
for end_idx in period_end_indices:
    after = df.loc[end_idx + 1 :]
    recovery_after = after[after["Drawdown"] >= 0]
    if len(recovery_after) > 0:
        distinct_recovery_dates.append(df.loc[recovery_after.index[0], "Date"])

# Layout: main drawdown chart (wide) + seaborn KDE marginal strip (wider than before)
fig = plt.figure(figsize=(8, 4.5), dpi=400, facecolor=PAGE_BG)
gs = GridSpec(1, 2, figure=fig, width_ratios=[4, 1], wspace=0.03)
ax = fig.add_subplot(gs[0])
ax_kde = fig.add_subplot(gs[1], sharey=ax)

# Filled drawdown area
ax.fill_between(df["Date"], df["Drawdown"], 0, color=DRAWDOWN_COLOR, alpha=0.30)
sns.lineplot(x="Date", y="Drawdown", data=df, ax=ax, color=DRAWDOWN_COLOR, linewidth=1.8, label="Drawdown")

# Zero baseline
ax.axhline(y=0, color=INK_SOFT, linewidth=1.0)

# Max drawdown marker
ax.scatter(
    [max_dd_date], [max_dd_value], color=MAX_DD_COLOR, s=120, zorder=5, marker="v", label=f"Max DD: {max_dd_value:.1f}%"
)

# Recovery (new high) markers — one per distinct drawdown period to avoid clutter
if len(distinct_recovery_dates) > 0:
    ax.scatter(
        distinct_recovery_dates,
        [0.0] * len(distinct_recovery_dates),
        color=RECOVERY_COLOR,
        s=80,
        zorder=5,
        marker="^",
        label="New High",
    )

# Dual annotation: recovery time + max drawdown duration (both required by spec)
if recovery_days is not None:
    ax.annotate(
        f"Recovery: {recovery_days}d\nDuration: {max_dd_duration}d",
        xy=(max_dd_date, max_dd_value),
        xytext=(28, 32),
        textcoords="offset points",
        fontsize=9.5,
        color=INK_SOFT,
        arrowprops={"arrowstyle": "->", "color": INK_SOFT, "lw": 0.8},
    )

# Style main axes
ax.set_xlabel("Trading Date", fontsize=10, color=INK)
ax.set_ylabel("Drawdown (%)", fontsize=10, color=INK)
ax.set_title("drawdown-basic · python · seaborn · anyplot.ai", fontsize=12, fontweight="medium", color=INK)
ax.tick_params(axis="both", labelsize=8)
ax.set_ylim(min(df["Drawdown"]) * 1.15, max(df["Drawdown"]) + 3)

ax.spines["top"].set_visible(False)
ax.spines["right"].set_visible(False)
for s in ("left", "bottom"):
    ax.spines[s].set_color(INK_SOFT)

ax.yaxis.grid(True, alpha=0.13, linewidth=0.8)
ax.xaxis.grid(True, alpha=0.08, linewidth=0.6)
ax.legend(loc="lower right", fontsize=7)

# Seaborn KDE marginal: distribution of drawdown depth values (seaborn-distinctive feature)
sns.kdeplot(
    y=df["Drawdown"],
    ax=ax_kde,
    fill=True,
    color=DRAWDOWN_COLOR,
    alpha=0.40,
    linewidth=1.2,
    clip=(df["Drawdown"].min() * 1.05, 0.5),
)
ax_kde.axhline(y=0, color=INK_SOFT, linewidth=0.8, linestyle="--", alpha=0.6)
ax_kde.axhline(y=max_dd_value, color=MAX_DD_COLOR, linewidth=0.8, linestyle="--", alpha=0.7)

ax_kde.set_xlabel("Density", fontsize=7, color=INK_SOFT)
ax_kde.set_ylabel("")
ax_kde.set_title("Dist.", fontsize=8, color=INK_SOFT)
ax_kde.tick_params(labelleft=False, labelsize=6)
ax_kde.tick_params(axis="x", labelsize=6)
ax_kde.set_xlim(left=0)
ax_kde.spines["top"].set_visible(False)
ax_kde.spines["right"].set_visible(False)
for s in ("left", "bottom"):
    ax_kde.spines[s].set_color(INK_SOFT)
ax_kde.yaxis.grid(True, alpha=0.10, linewidth=0.6)

plt.savefig(f"plot-{THEME}.png", dpi=400, facecolor=PAGE_BG)
Runnable source as JSON, for any HTTP client: https://api.anyplot.ai/specs/drawdown-basic/seaborn/code. Any spec id and library id listed in llms-full.txt fit the same URL shape; every URL below is complete and callable.
{
  "spec_id": "drawdown-basic",
  "language": "python",
  "library": "seaborn",
  "page": "https://anyplot.ai/drawdown-basic/python/seaborn",
  "hub": "https://anyplot.ai/drawdown-basic",
  "code_json": "https://api.anyplot.ai/specs/drawdown-basic/seaborn/code",
  "spec_json": "https://api.anyplot.ai/specs/drawdown-basic",
  "render_light_png": "https://storage.googleapis.com/anyplot-images/plots/drawdown-basic/python/seaborn/plot-light.png",
  "render_dark_png": "https://storage.googleapis.com/anyplot-images/plots/drawdown-basic/python/seaborn/plot-dark.png",
  "quality_score": 86.0,
  "license": "MIT",
  "guide": "https://anyplot.ai/llms.txt"
}
Part of Drawdown Chart on anyplot.ai.