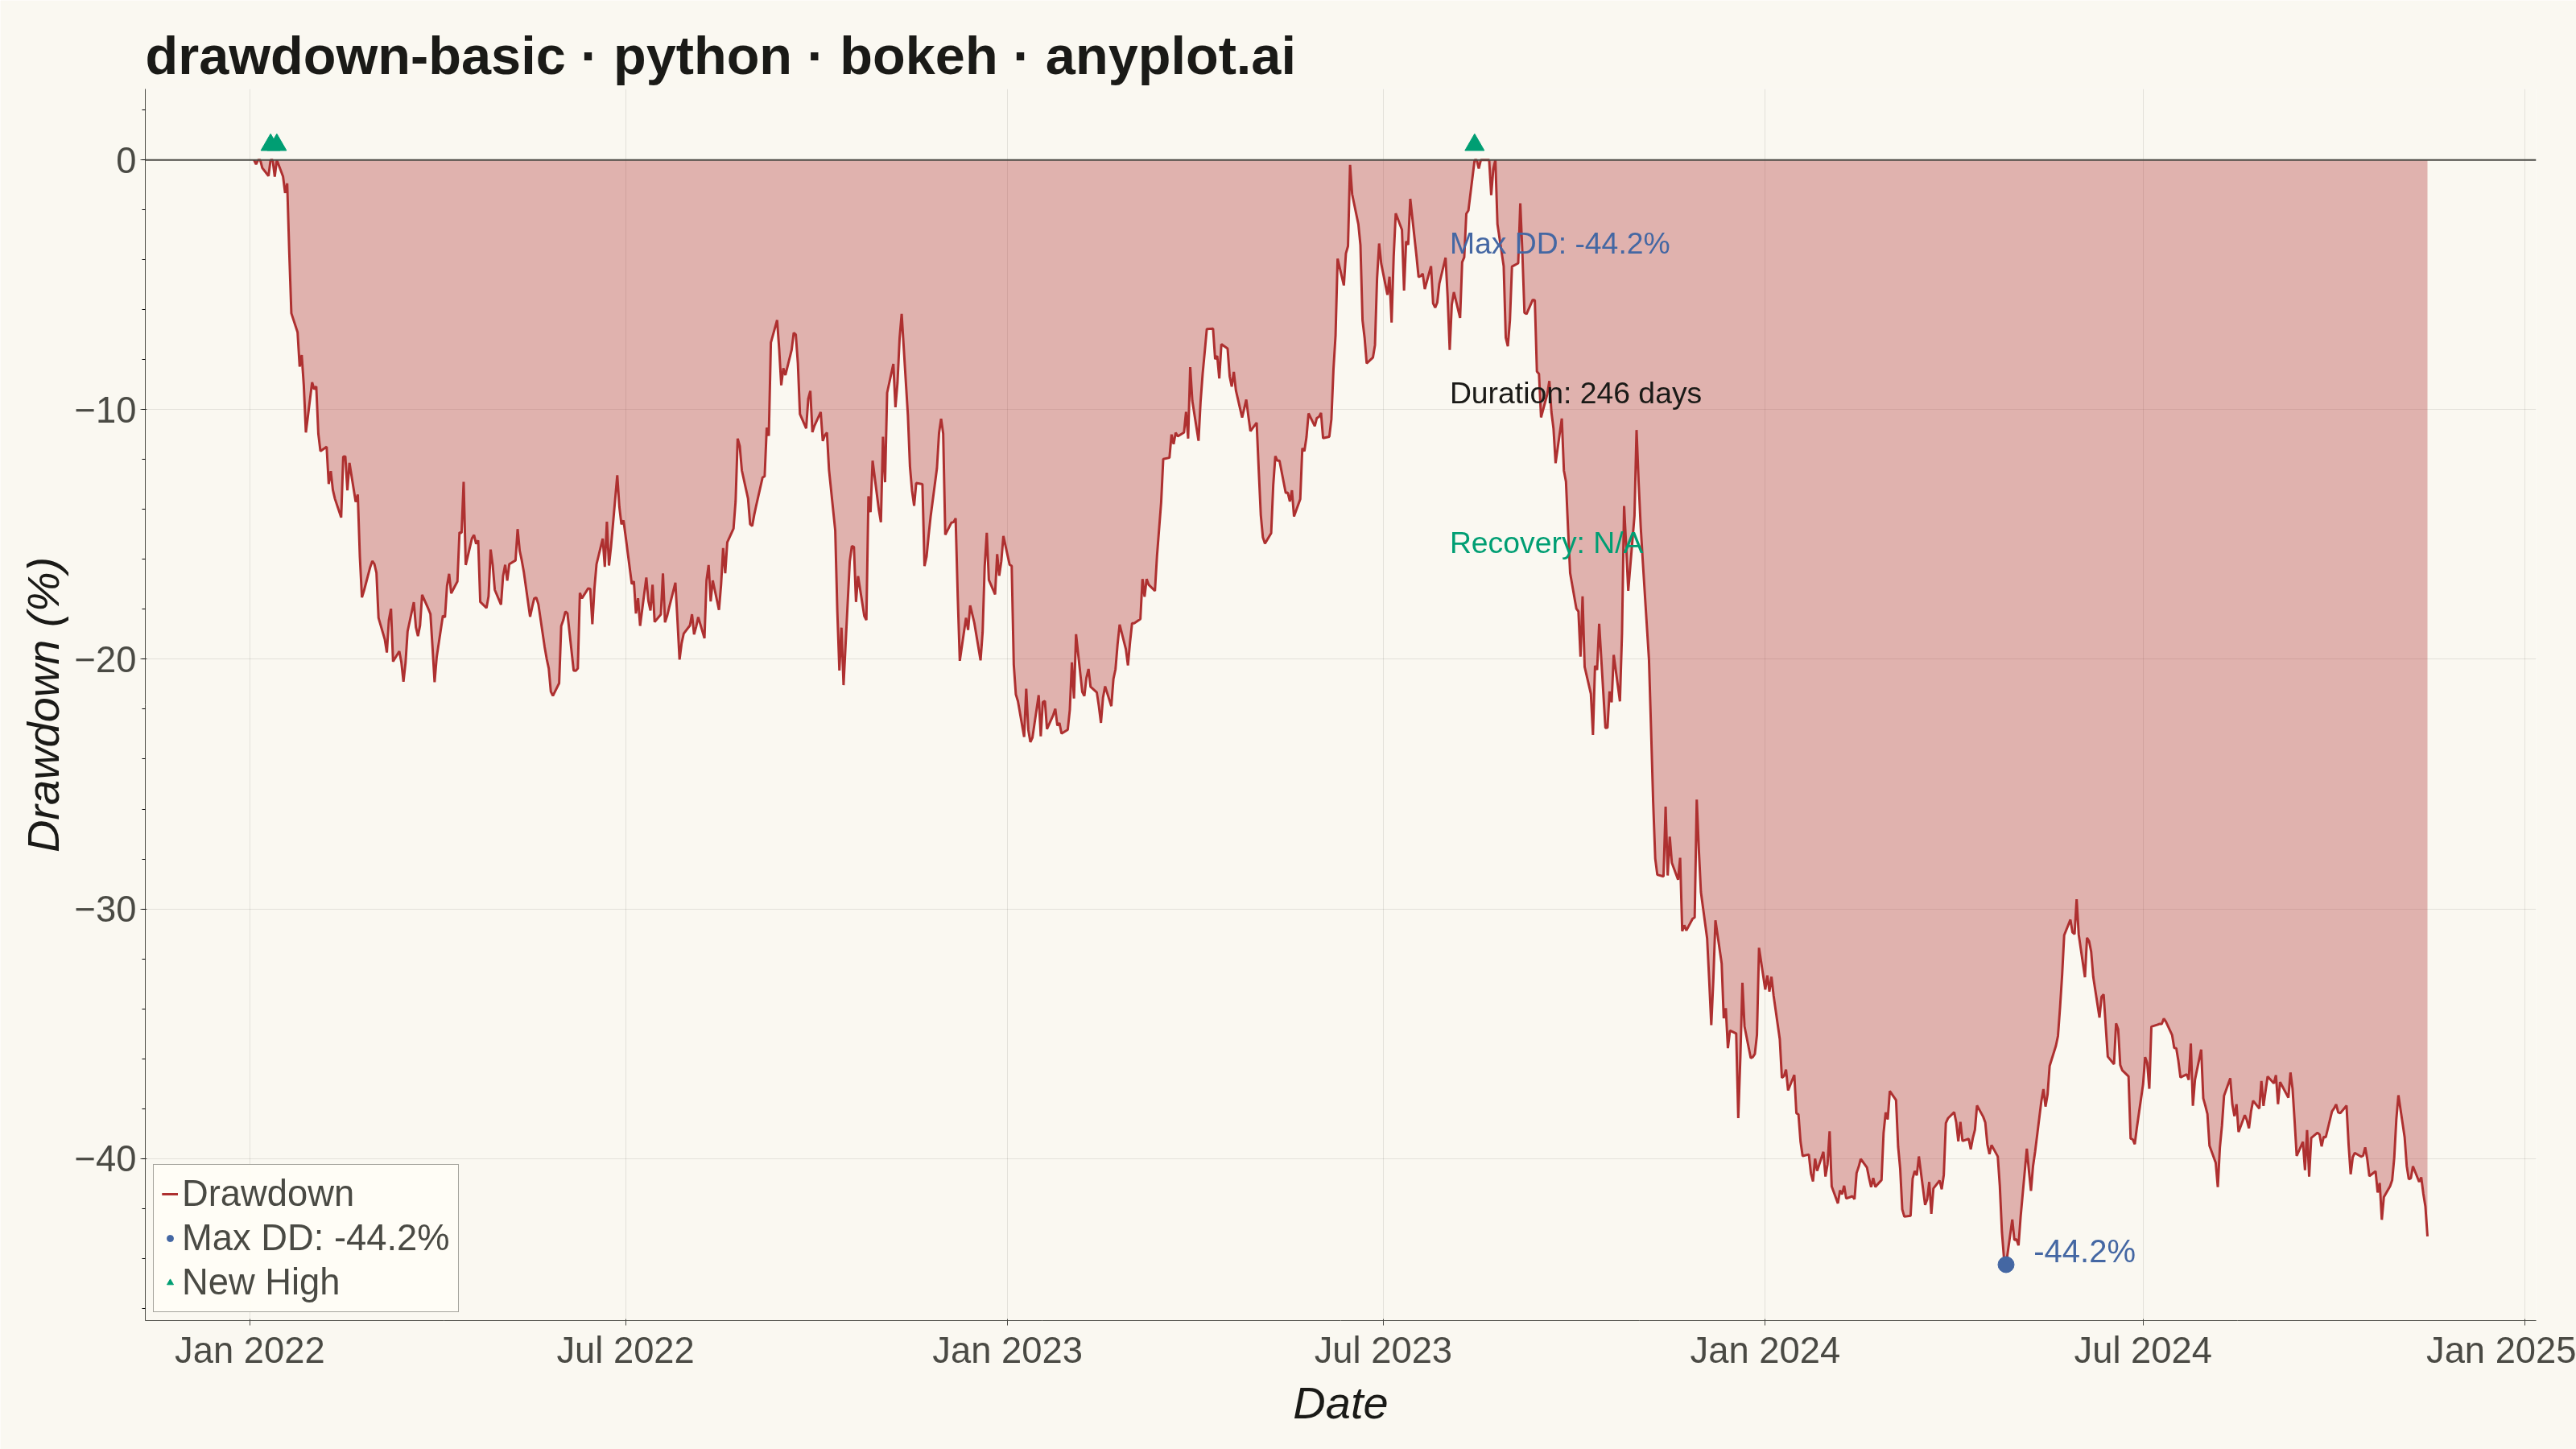
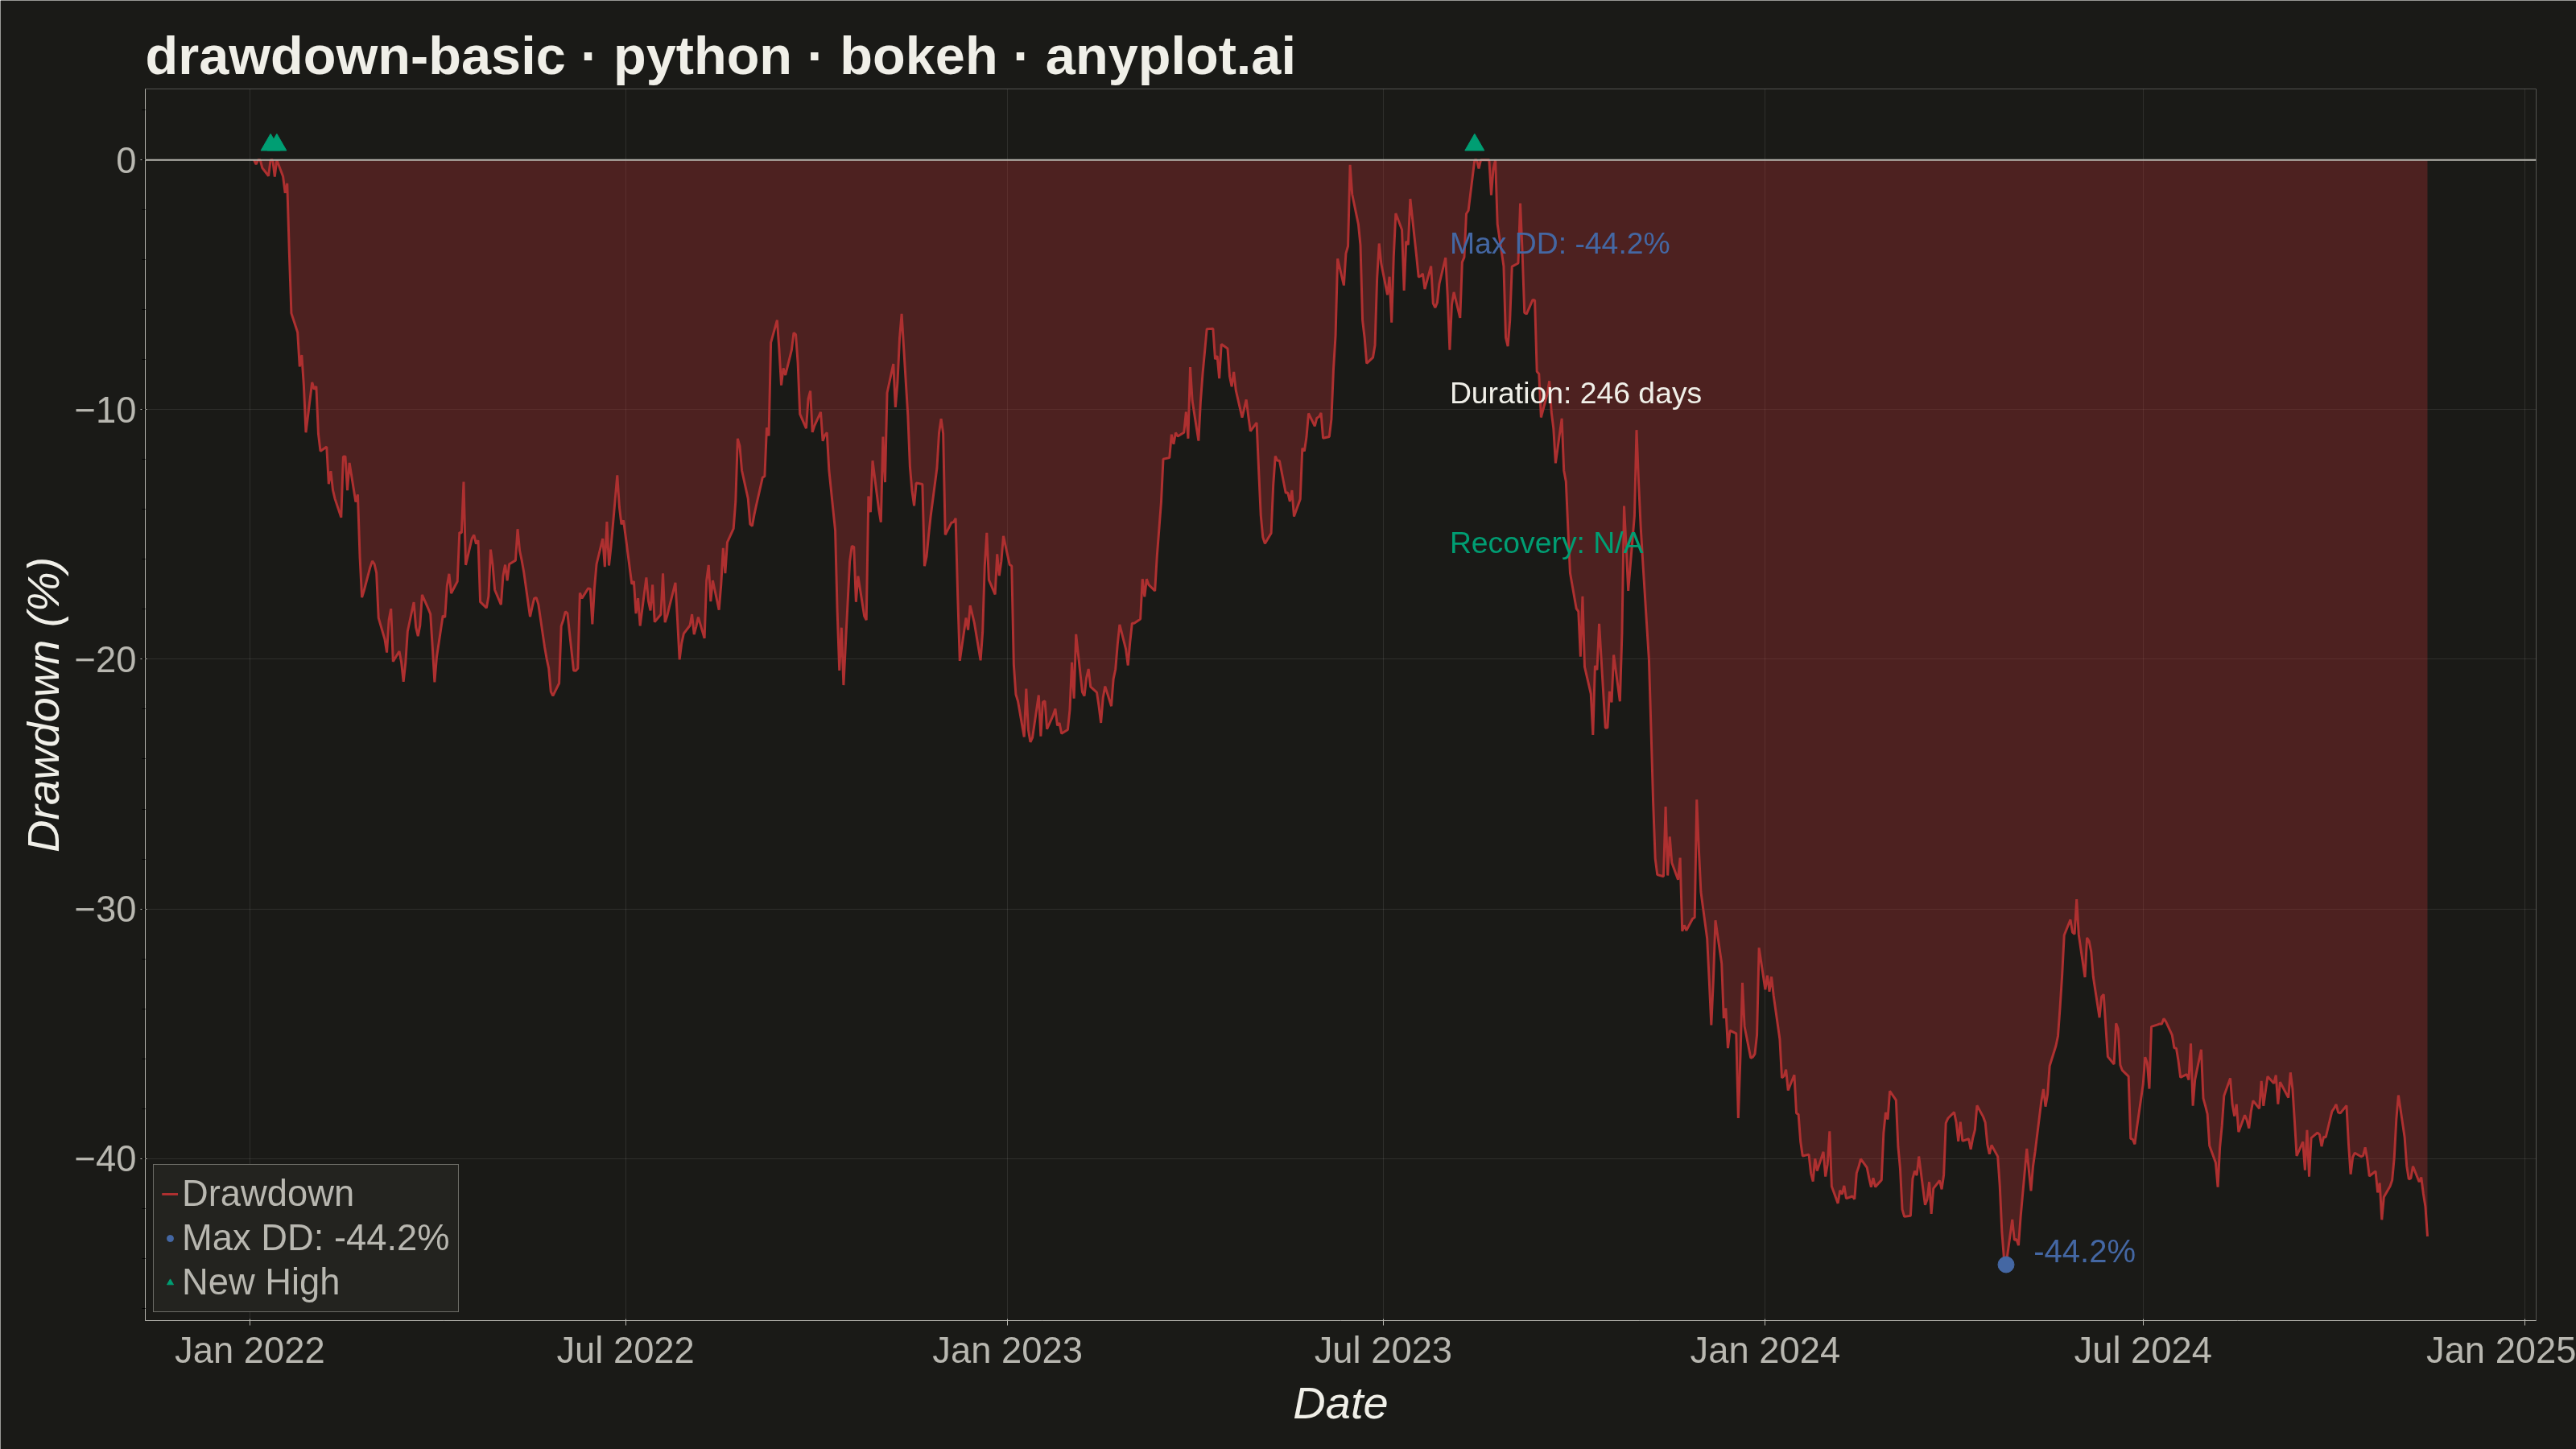
A drawdown chart visualizes the percentage decline from peak value over time, showing how far an investment or asset has fallen from its highest point. This chart is essential for risk assessment and understanding the magnitude of losses during unfavorable market periods. The filled area below the zero line emphasizes the depth and duration of drawdowns, making it easy to identify maximum drawdown periods and recovery points.
""" anyplot.ai
drawdown-basic: Drawdown Chart
Library: bokeh 3.9.0 | Python 3.13.13
Quality: 87/100 | Updated: 2026-05-23
"""

import base64
import os
import sys
import time
from pathlib import Path


# Remove the script's own directory from sys.path so "bokeh" resolves to the
# installed package, not this file.
_this_dir = str(Path(__file__).parent.resolve())
sys.path = [p for p in sys.path if os.path.abspath(p) != _this_dir and p != ""]

import numpy as np
import pandas as pd
from bokeh.io import output_file, save
from bokeh.models import ColumnDataSource, HoverTool, Label, Span
from bokeh.plotting import figure
from selenium import webdriver
from selenium.webdriver.chrome.options import Options


# Theme tokens
THEME = os.getenv("ANYPLOT_THEME", "light")
PAGE_BG = "#FAF8F1" if THEME == "light" else "#1A1A17"
ELEVATED_BG = "#FFFDF6" if THEME == "light" else "#242420"
INK = "#1A1A17" if THEME == "light" else "#F0EFE8"
INK_SOFT = "#4A4A44" if THEME == "light" else "#B8B7B0"

# Imprint palette with semantic override: loss/drawdown → red
DRAWDOWN_COLOR = "#AE3030"  # anyplot red (pos 3) — semantic: financial loss
MAX_DD_COLOR = "#4467A3"  # anyplot sky blue (pos 4) — contrasting accent
RECOVERY_COLOR = "#009E73"  # anyplot green (pos 1) — recovery / new highs

# Data — simulate 3 years of daily portfolio returns
np.random.seed(42)
n_days = 750
dates = pd.date_range("2022-01-01", periods=n_days, freq="B")

returns = np.random.normal(0.0003, 0.015, n_days)
returns[200:250] = np.random.normal(-0.005, 0.025, 50)
returns[450:520] = np.random.normal(-0.008, 0.030, 70)
returns[600:630] = np.random.normal(-0.004, 0.020, 30)

prices = 100 * np.exp(np.cumsum(returns))
running_max = np.maximum.accumulate(prices)
drawdown = (prices - running_max) / running_max * 100

# Find max drawdown
max_dd_idx = int(np.argmin(drawdown))
max_dd_value = drawdown[max_dd_idx]
max_dd_date = dates[max_dd_idx]

# Max drawdown duration: from last peak before trough to the trough
peak_idxs = np.where(drawdown[:max_dd_idx] >= -0.1)[0]
dd_start_idx = int(peak_idxs[-1]) if len(peak_idxs) > 0 else 0
max_dd_duration = (dates[max_dd_idx] - dates[dd_start_idx]).days

# Recovery time: from trough back to new high (drawdown ≥ 0)
rec_idxs = np.where(drawdown[max_dd_idx:] >= -0.1)[0]
if len(rec_idxs) > 0:
    recovery_days = (dates[max_dd_idx + int(rec_idxs[0])] - dates[max_dd_idx]).days
    recovery_str = f"{recovery_days} days"
else:
    recovery_str = "N/A"

# Find recovery points — transitions from negative drawdown back to zero (new highs)
recovery_dates = []
for i in range(1, len(drawdown)):
    if drawdown[i - 1] < -0.5 and drawdown[i] >= -0.05:
        recovery_dates.append(dates[i])

# Plot
source = ColumnDataSource(data={"date": dates, "drawdown": drawdown, "zero": np.zeros(n_days)})

W, H = 3200, 1800
p = figure(
    width=W,
    height=H,
    title="drawdown-basic · python · bokeh · anyplot.ai",
    x_axis_label="Date",
    y_axis_label="Drawdown (%)",
    x_axis_type="datetime",
    toolbar_location=None,
    min_border_bottom=160,
    min_border_left=180,
    min_border_top=110,
    min_border_right=50,
)

# HoverTool for interactivity
hover = HoverTool(tooltips=[("Date", "@date{%F}"), ("Drawdown", "@drawdown{0.2f}%")], formatters={"@date": "datetime"})
p.add_tools(hover)

# Filled drawdown area
p.varea(x="date", y1="zero", y2="drawdown", source=source, fill_color=DRAWDOWN_COLOR, fill_alpha=0.35)

# Drawdown line
p.line(x="date", y="drawdown", source=source, line_color=DRAWDOWN_COLOR, line_width=3, legend_label="Drawdown")

# Zero baseline
p.add_layout(Span(location=0, dimension="width", line_color=INK_SOFT, line_width=2))

# Maximum drawdown marker
p.scatter(
    x=[max_dd_date],
    y=[max_dd_value],
    size=20,
    color=MAX_DD_COLOR,
    marker="circle",
    legend_label=f"Max DD: {max_dd_value:.1f}%",
)

# Max drawdown annotation
p.add_layout(
    Label(
        x=max_dd_date,
        y=max_dd_value,
        text=f"  {max_dd_value:.1f}%",
        text_font_size="30pt",
        text_color=MAX_DD_COLOR,
        x_offset=12,
        y_offset=-5,
    )
)

# Stats block (data coords, upper area): max DD %, duration, recovery time
_stats_x = dates[int(0.55 * n_days)]  # mid-right section, well before the right edge
_stats = [
    (f"Max DD: {max_dd_value:.1f}%", MAX_DD_COLOR),
    (f"Duration: {max_dd_duration} days", INK),
    (f"Recovery: {recovery_str}", RECOVERY_COLOR),
]
for _i, (_text, _color) in enumerate(_stats):
    p.add_layout(
        Label(x=_stats_x, y=-4 - _i * 6, text=_text, text_font_size="28pt", text_color=_color, text_align="left")
    )

# Recovery (new high) markers
if recovery_dates:
    p.scatter(
        x=recovery_dates,
        y=[0.6] * len(recovery_dates),
        size=24,
        color=RECOVERY_COLOR,
        marker="triangle",
        legend_label="New High",
    )

# Font sizes
p.title.text_font_size = "50pt"
p.xaxis.axis_label_text_font_size = "42pt"
p.yaxis.axis_label_text_font_size = "42pt"
p.xaxis.major_label_text_font_size = "34pt"
p.yaxis.major_label_text_font_size = "34pt"

# Legend
p.legend.location = "bottom_left"
p.legend.label_text_font_size = "34pt"
p.legend.background_fill_color = ELEVATED_BG
p.legend.border_line_color = INK_SOFT
p.legend.label_text_color = INK_SOFT

# Theme-adaptive chrome
p.background_fill_color = PAGE_BG
p.border_fill_color = PAGE_BG
p.outline_line_color = "rgba(0,0,0,0)"
p.title.text_color = INK
p.xaxis.axis_label_text_color = INK
p.yaxis.axis_label_text_color = INK
p.xaxis.major_label_text_color = INK_SOFT
p.yaxis.major_label_text_color = INK_SOFT
p.xaxis.axis_line_color = INK_SOFT
p.yaxis.axis_line_color = INK_SOFT
p.xaxis.major_tick_line_color = INK_SOFT
p.yaxis.major_tick_line_color = INK_SOFT
p.xgrid.grid_line_color = INK
p.ygrid.grid_line_color = INK
p.xgrid.grid_line_alpha = 0.10
p.ygrid.grid_line_alpha = 0.10

# Save HTML artifact
output_file(f"plot-{THEME}.html", title="Drawdown Chart")
save(p)

# Screenshot with headless Chrome via CDP clip for exact pixel dimensions
# (export_png uses snap chromedriver which is broken; save_screenshot clips at viewport)
opts = Options()
for arg in (
    "--headless=new",
    "--no-sandbox",
    "--disable-dev-shm-usage",
    "--disable-gpu",
    f"--window-size={W},{H + 200}",
    "--hide-scrollbars",
):
    opts.add_argument(arg)
driver = webdriver.Chrome(options=opts)
driver.get(f"file://{Path(f'plot-{THEME}.html').resolve()}")
time.sleep(3)
screenshot = driver.execute_cdp_cmd(
    "Page.captureScreenshot",
    {"format": "png", "captureBeyondViewport": True, "clip": {"x": 0, "y": 0, "width": W, "height": H, "scale": 1}},
)
driver.quit()
img_bytes = base64.b64decode(screenshot["data"])
with open(f"plot-{THEME}.png", "wb") as f:
    f.write(img_bytes)
Runnable source as JSON, for any HTTP client: https://api.anyplot.ai/specs/drawdown-basic/bokeh/code. Any spec id and library id listed in llms-full.txt fit the same URL shape; every URL below is complete and callable.
{
  "spec_id": "drawdown-basic",
  "language": "python",
  "library": "bokeh",
  "page": "https://anyplot.ai/drawdown-basic/python/bokeh",
  "hub": "https://anyplot.ai/drawdown-basic",
  "code_json": "https://api.anyplot.ai/specs/drawdown-basic/bokeh/code",
  "spec_json": "https://api.anyplot.ai/specs/drawdown-basic",
  "render_light_png": "https://storage.googleapis.com/anyplot-images/plots/drawdown-basic/python/bokeh/plot-light.png",
  "render_dark_png": "https://storage.googleapis.com/anyplot-images/plots/drawdown-basic/python/bokeh/plot-dark.png",
  "interactive_light_html": "https://storage.googleapis.com/anyplot-images/plots/drawdown-basic/python/bokeh/plot-light.html",
  "interactive_dark_html": "https://storage.googleapis.com/anyplot-images/plots/drawdown-basic/python/bokeh/plot-dark.html",
  "quality_score": 87.0,
  "license": "MIT",
  "guide": "https://anyplot.ai/llms.txt"
}
Part of Drawdown Chart on anyplot.ai.