The same plot in 14 other libraries — JavaScript: Chart.js, D3.js, Apache ECharts, MUI X Charts; Python: Altair, Bokeh, lets-plot, Matplotlib, Plotly, plotnine, Pygal, Seaborn; R: ggplot2; Julia: Makie.jl. Compare all 15 side by side: Drawdown Chart in Python, R, Julia and JavaScript.
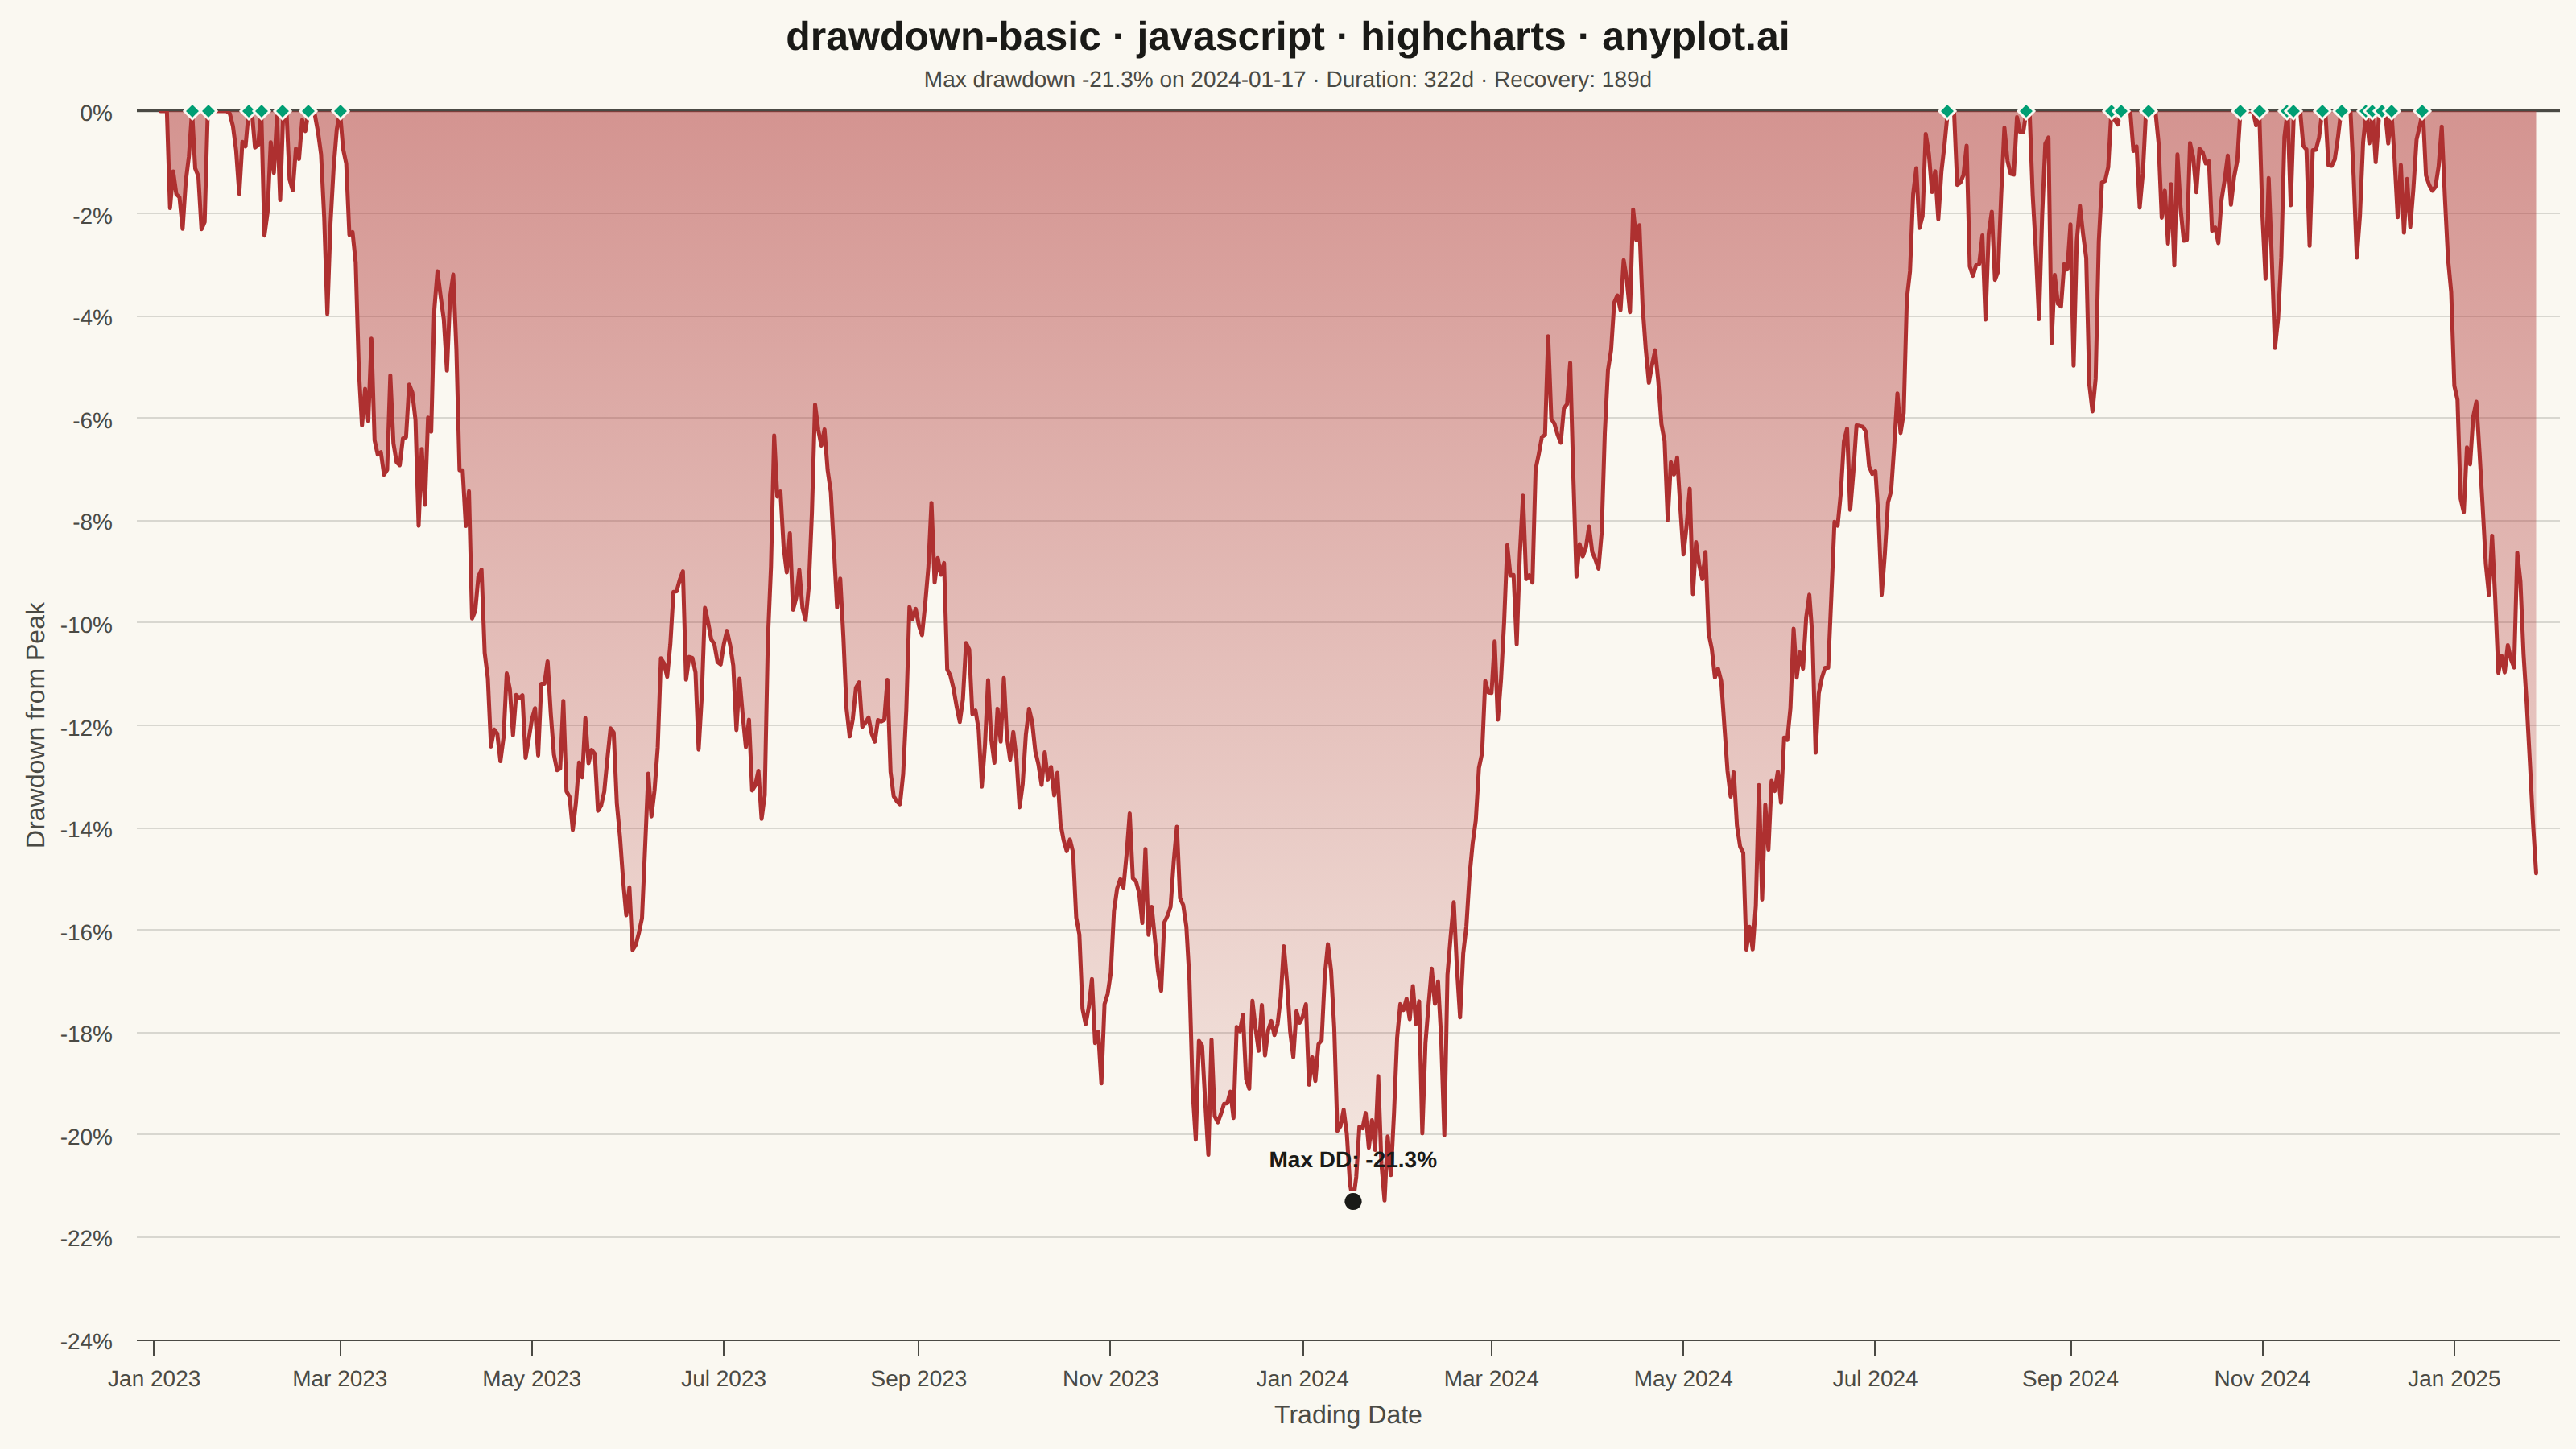
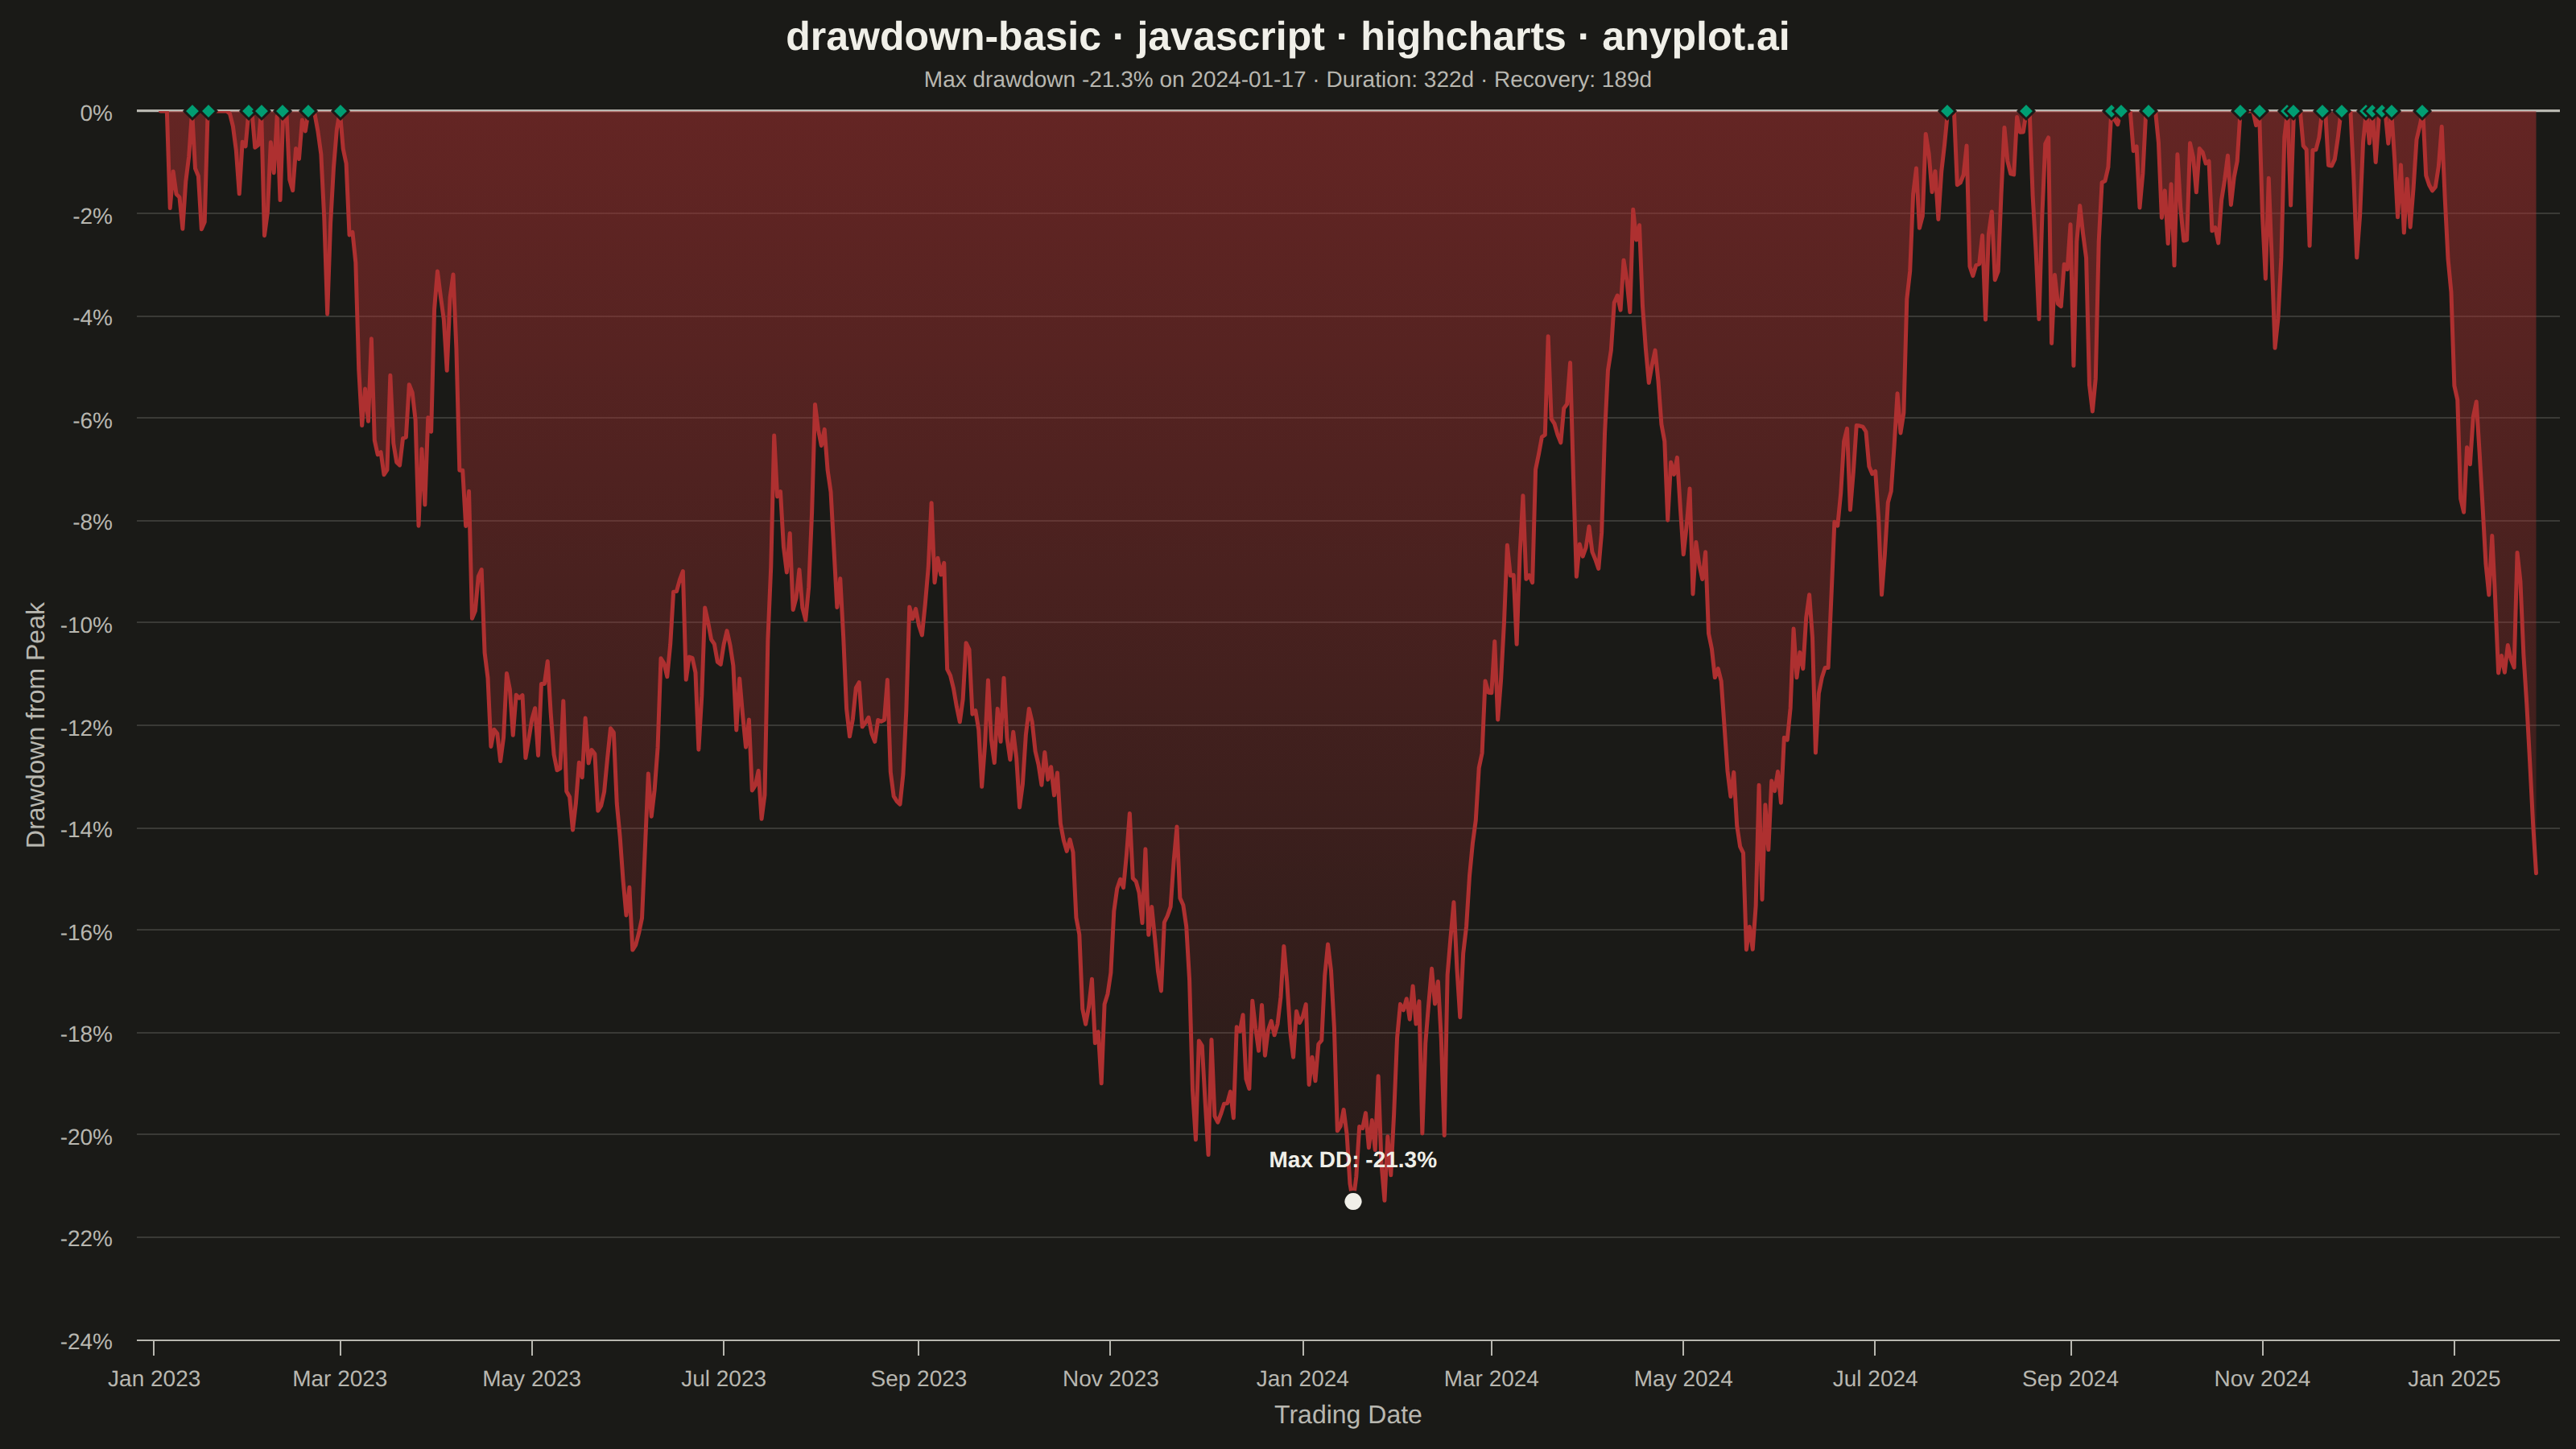
A drawdown chart visualizes the percentage decline from peak value over time, showing how far an investment or asset has fallen from its highest point. This chart is essential for risk assessment and understanding the magnitude of losses during unfavorable market periods. The filled area below the zero line emphasizes the depth and duration of drawdowns, making it easy to identify maximum drawdown periods and recovery points.
// anyplot.ai
// drawdown-basic: Drawdown Chart
// Library: highcharts 12.6.0 | JavaScript 22.23.2
// Quality: 90/100 | Created: 2026-08-24
//# anyplot-orientation: landscape
const t = window.ANYPLOT_TOKENS;

// --- Data (in-memory, deterministic) ----------------------------------------
// Tiny fixed-seed LCG — the browser has no seeded RNG.
let seed = 20260824;
function lcgRandom() {
  seed = (seed * 1103515245 + 12345) % 2147483648;
  return seed / 2147483648;
}
function gaussian() {
  const u1 = lcgRandom() || 1e-6;
  const u2 = lcgRandom();
  return Math.sqrt(-2 * Math.log(u1)) * Math.cos(2 * Math.PI * u2);
}

const numDays = 756; // ~3 years of trading days
const startDate = Date.UTC(2023, 0, 3);
const dates = [];
const navValues = [];
let nav = 100000;
for (let i = 0; i < numDays; i += 1) {
  dates.push(startDate + i * 24 * 3600 * 1000);
  const drift = 0.00035;
  const shock = gaussian() * 0.011;
  nav *= 1 + drift + shock;
  navValues.push(nav);
}

// Drawdown as % decline from running maximum.
const drawdownPoints = [];
const recoveryPoints = [];
let runningMax = navValues[0];
let runningMaxIndex = 0;
let maxDrawdown = 0;
let maxDrawdownIndex = 0;
let maxDrawdownPeakIndex = 0;
let inDrawdown = false;
for (let i = 0; i < navValues.length; i += 1) {
  if (navValues[i] >= runningMax) {
    if (inDrawdown) {
      recoveryPoints.push([dates[i], 0]);
      inDrawdown = false;
    }
    runningMax = navValues[i];
    runningMaxIndex = i;
  } else {
    inDrawdown = true;
  }
  const drawdown = ((navValues[i] - runningMax) / runningMax) * 100;
  drawdownPoints.push([dates[i], drawdown]);
  if (drawdown < maxDrawdown) {
    maxDrawdown = drawdown;
    maxDrawdownIndex = i;
    maxDrawdownPeakIndex = runningMaxIndex;
  }
}

// Duration/recovery stats for the deepest drawdown episode.
let maxDrawdownRecoveryIndex = null;
for (let i = maxDrawdownIndex + 1; i < navValues.length; i += 1) {
  if (drawdownPoints[i][1] === 0) {
    maxDrawdownRecoveryIndex = i;
    break;
  }
}
const maxDrawdownDurationDays = maxDrawdownIndex - maxDrawdownPeakIndex;
const recoveryLabel =
  maxDrawdownRecoveryIndex !== null
    ? `Recovery: ${maxDrawdownRecoveryIndex - maxDrawdownIndex}d`
    : "Recovery: not yet recovered";

// --- Chart -------------------------------------------------------------------
Highcharts.chart("container", {
  chart: {
    type: "area",
    backgroundColor: "transparent",
    animation: false,
    style: { fontFamily: "inherit" },
  },
  credits: { enabled: false },
  colors: t.palette,
  title: {
    text: "drawdown-basic · javascript · highcharts · anyplot.ai",
    style: { color: t.ink, fontSize: "25px", fontWeight: "600" },
  },
  subtitle: {
    text: `Max drawdown ${maxDrawdown.toFixed(1)}% on ${new Date(dates[maxDrawdownIndex]).toISOString().slice(0, 10)} · Duration: ${maxDrawdownDurationDays}d · ${recoveryLabel}`,
    style: { color: t.inkSoft, fontSize: "14px" },
  },
  xAxis: {
    type: "datetime",
    lineColor: t.inkSoft,
    tickColor: t.inkSoft,
    gridLineColor: t.grid,
    labels: { style: { color: t.inkSoft, fontSize: "14px" } },
    title: { text: "Trading Date", style: { color: t.inkSoft, fontSize: "16px" } },
  },
  yAxis: {
    max: 0,
    lineColor: t.inkSoft,
    tickColor: t.inkSoft,
    gridLineColor: t.grid,
    labels: {
      style: { color: t.inkSoft, fontSize: "14px" },
      formatter() {
        return `${this.value}%`;
      },
    },
    title: { text: "Drawdown from Peak", style: { color: t.inkSoft, fontSize: "16px" } },
    plotLines: [
      {
        value: 0,
        color: t.inkSoft,
        width: 1.5,
        zIndex: 3,
      },
    ],
  },
  legend: { enabled: false },
  tooltip: {
    xDateFormat: "%Y-%m-%d",
    valueDecimals: 2,
    valueSuffix: "%",
  },
  plotOptions: {
    series: { animation: false },
    area: {
      lineWidth: 2.5,
      color: t.palette[4],
      fillColor: {
        linearGradient: { x1: 0, y1: 0, x2: 0, y2: 1 },
        stops: [
          [0, Highcharts.color(t.palette[4]).setOpacity(0.5).get("rgba")],
          [1, Highcharts.color(t.palette[4]).setOpacity(0.08).get("rgba")],
        ],
      },
      marker: { enabled: false, states: { hover: { enabled: false } } },
      threshold: 0,
    },
  },
  series: [
    {
      name: "Drawdown",
      data: drawdownPoints,
      zIndex: 1,
    },
    {
      type: "scatter",
      name: "Maximum drawdown",
      data: [[dates[maxDrawdownIndex], maxDrawdown]],
      color: t.ink,
      marker: { symbol: "circle", radius: 6, lineWidth: 1.5, lineColor: t.pageBg },
      dataLabels: {
        enabled: true,
        format: `Max DD: ${maxDrawdown.toFixed(1)}%`,
        style: { color: t.ink, fontSize: "14px", fontWeight: "600", textOutline: "none" },
        y: -14,
      },
      zIndex: 2,
      enableMouseTracking: true,
    },
    {
      type: "scatter",
      name: "Recovery point",
      data: recoveryPoints,
      color: t.palette[0],
      marker: { symbol: "diamond", radius: 5, lineWidth: 1.5, lineColor: t.pageBg },
      zIndex: 2,
      enableMouseTracking: true,
    },
  ],
});
Runnable source as JSON, for any HTTP client: https://api.anyplot.ai/specs/drawdown-basic/highcharts/code. Any spec id and library id listed in llms-full.txt fit the same URL shape; every URL below is complete and callable.
{
  "spec_id": "drawdown-basic",
  "language": "javascript",
  "library": "highcharts",
  "page": "https://anyplot.ai/drawdown-basic/javascript/highcharts",
  "hub": "https://anyplot.ai/drawdown-basic",
  "code_json": "https://api.anyplot.ai/specs/drawdown-basic/highcharts/code",
  "spec_json": "https://api.anyplot.ai/specs/drawdown-basic",
  "render_light_png": "https://storage.googleapis.com/anyplot-images/plots/drawdown-basic/javascript/highcharts/plot-light.png",
  "render_dark_png": "https://storage.googleapis.com/anyplot-images/plots/drawdown-basic/javascript/highcharts/plot-dark.png",
  "interactive_light_html": "https://storage.googleapis.com/anyplot-images/plots/drawdown-basic/javascript/highcharts/plot-light.html",
  "interactive_dark_html": "https://storage.googleapis.com/anyplot-images/plots/drawdown-basic/javascript/highcharts/plot-dark.html",
  "quality_score": 90.0,
  "license": "MIT",
  "guide": "https://anyplot.ai/llms.txt"
}
Part of Drawdown Chart on anyplot.ai.