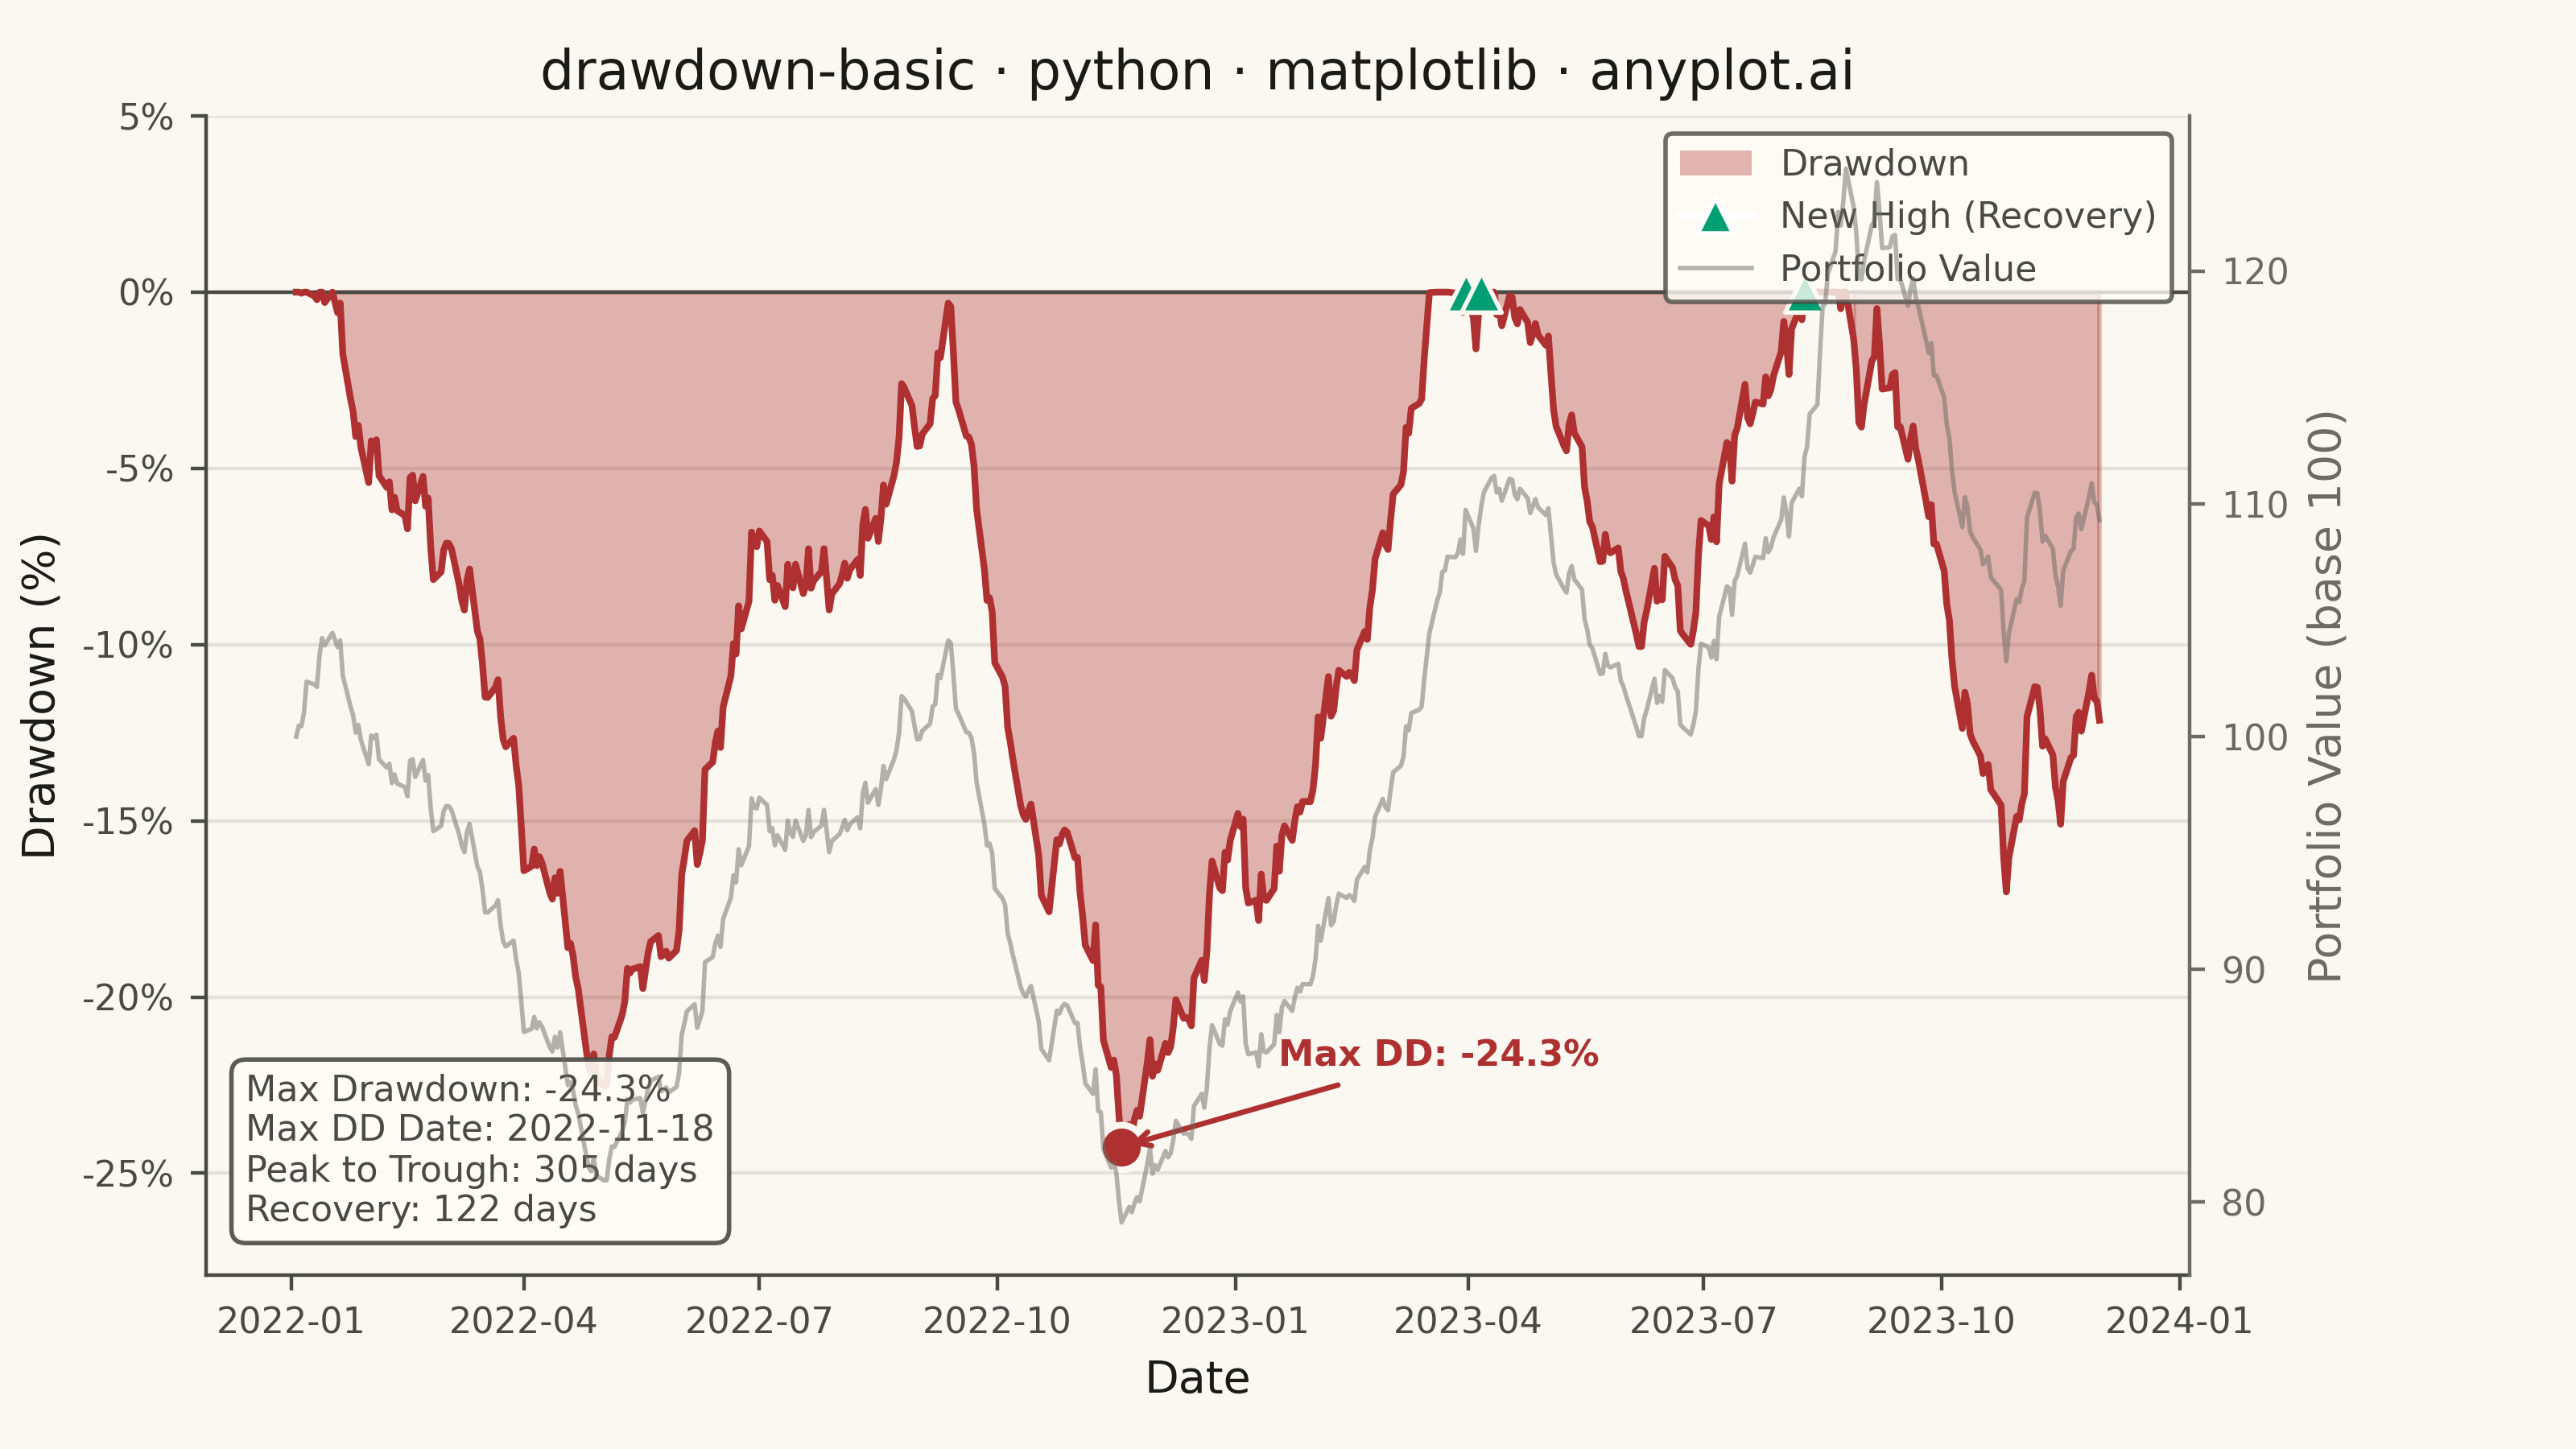
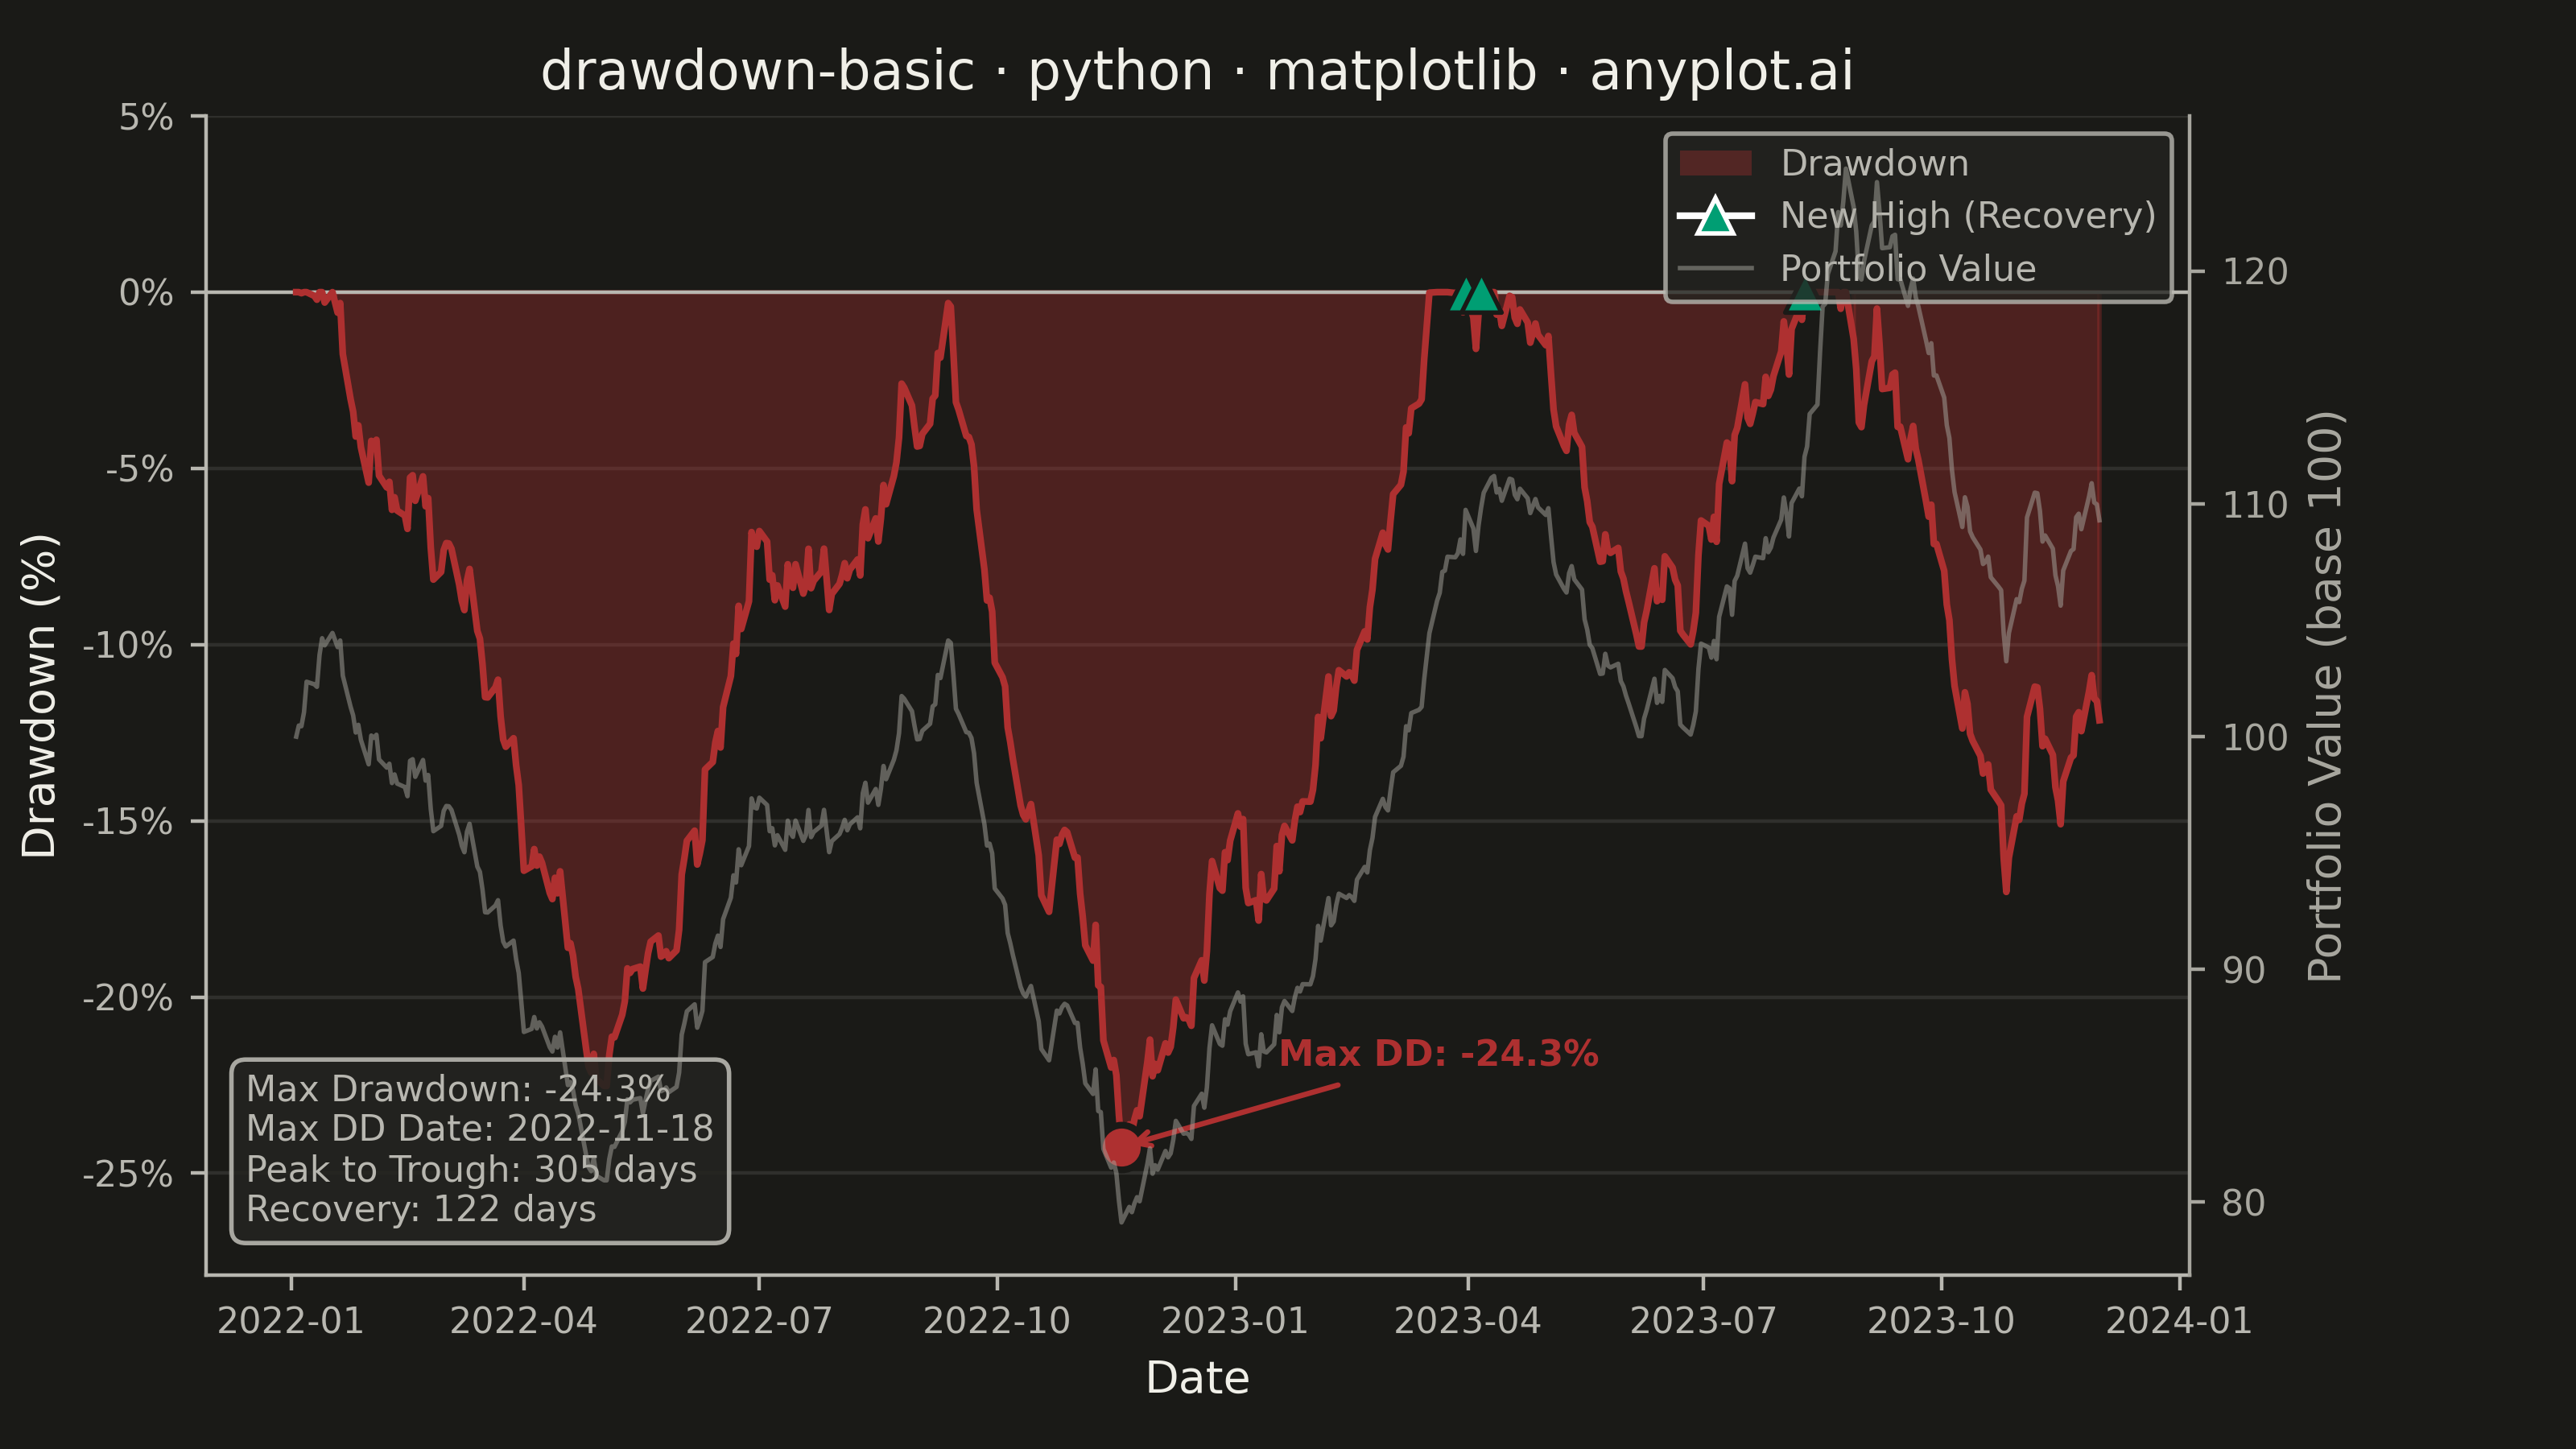
A drawdown chart visualizes the percentage decline from peak value over time, showing how far an investment or asset has fallen from its highest point. This chart is essential for risk assessment and understanding the magnitude of losses during unfavorable market periods. The filled area below the zero line emphasizes the depth and duration of drawdowns, making it easy to identify maximum drawdown periods and recovery points.
""" anyplot.ai
drawdown-basic: Drawdown Chart
Library: matplotlib 3.10.9 | Python 3.13.13
Quality: 91/100 | Updated: 2026-05-23
"""

import os

import matplotlib.pyplot as plt
import numpy as np
import pandas as pd
from matplotlib.lines import Line2D
from matplotlib.patches import Patch


# Theme tokens
THEME = os.getenv("ANYPLOT_THEME", "light")
PAGE_BG = "#FAF8F1" if THEME == "light" else "#1A1A17"
ELEVATED_BG = "#FFFDF6" if THEME == "light" else "#242420"
INK = "#1A1A17" if THEME == "light" else "#F0EFE8"
INK_SOFT = "#4A4A44" if THEME == "light" else "#B8B7B0"
INK_MUTED = "#6B6A63" if THEME == "light" else "#A8A79F"

# Semantic palette: red for drawdown (loss), green for recovery (gain)
DRAWDOWN_COLOR = "#AE3030"  # Imprint palette position 3
RECOVERY_COLOR = "#009E73"  # Imprint palette position 1

# Data — 2 years of simulated daily portfolio values with multiple drawdown cycles
np.random.seed(42)
dates = pd.date_range("2022-01-01", periods=500, freq="B")
n_points = len(dates)

prices = [10000]
trend = 0.0008

for i in range(1, n_points):
    if 50 <= i < 85:
        drift = -0.005
    elif 85 <= i < 130:
        drift = 0.004
    elif 180 <= i < 230:
        drift = -0.006
    elif 230 <= i < 320:
        drift = 0.003
    elif 350 <= i < 380:
        drift = -0.004
    elif 380 <= i < 430:
        drift = 0.003
    elif 450 <= i < 470:
        drift = -0.004
    else:
        drift = trend
    noise = np.random.normal(0, 0.008)
    prices.append(prices[-1] * (1 + drift + noise))

portfolio_value = np.array(prices)
running_max = np.maximum.accumulate(portfolio_value)
drawdown = (portfolio_value - running_max) / running_max * 100

# Key stats
max_dd_idx = np.argmin(drawdown)
max_dd_value = drawdown[max_dd_idx]
max_dd_date = dates[max_dd_idx]

peak_mask = portfolio_value[:max_dd_idx] == running_max[:max_dd_idx]
peak_before_max_dd = np.where(peak_mask)[0][-1] if peak_mask.any() else 0
peak_date = dates[peak_before_max_dd]

recovery_after_max = None
for i in range(max_dd_idx + 1, len(drawdown)):
    if drawdown[i] >= 0:
        recovery_after_max = dates[i]
        break
recovery_days = (recovery_after_max - max_dd_date).days if recovery_after_max is not None else "N/A"

# Recovery points: first bar where drawdown hits 0 after a meaningful drop
recovery_indices = []
for i in range(1, len(drawdown)):
    if drawdown[i] >= 0 and drawdown[i - 1] < -0.5:
        recovery_indices.append(i)

# Plot
fig, ax1 = plt.subplots(figsize=(8, 4.5), dpi=400, facecolor=PAGE_BG)
ax1.set_facecolor(PAGE_BG)

# Secondary y-axis: portfolio value rebased to 100
ax2 = ax1.twinx()
rebased = portfolio_value / portfolio_value[0] * 100
ax2.plot(dates, rebased, color=INK_MUTED, linewidth=1.0, alpha=0.5, zorder=1)
ax2.set_ylabel("Portfolio Value (base 100)", fontsize=10, color=INK_MUTED)
ax2.tick_params(axis="y", labelsize=8, colors=INK_MUTED)
ax2.spines["top"].set_visible(False)
ax2.spines["right"].set_color(INK_MUTED)
ax2.spines["left"].set_visible(False)
ax2.spines["bottom"].set_visible(False)

# Drawdown fill and line
ax1.fill_between(dates, drawdown, 0, where=(drawdown < 0), color=DRAWDOWN_COLOR, alpha=0.35, zorder=2)
ax1.plot(dates, drawdown, color=DRAWDOWN_COLOR, linewidth=1.5, zorder=3)

# Zero baseline
ax1.axhline(y=0, color=INK_SOFT, linewidth=0.8, zorder=2)

# Max drawdown marker and annotation
ax1.scatter([max_dd_date], [max_dd_value], color=DRAWDOWN_COLOR, s=100, zorder=6, edgecolors=PAGE_BG, linewidths=1.5)
ax1.annotate(
    f"Max DD: {max_dd_value:.1f}%",
    xy=(max_dd_date, max_dd_value),
    xytext=(35, 18),
    textcoords="offset points",
    fontsize=8,
    fontweight="bold",
    color=DRAWDOWN_COLOR,
    arrowprops={"arrowstyle": "->", "color": DRAWDOWN_COLOR, "lw": 1.2},
    zorder=7,
)

# Recovery markers at actual drawdown values (new highs: drawdown == 0)
for idx in recovery_indices[:6]:
    ax1.scatter(
        [dates[idx]],
        [drawdown[idx]],
        color=RECOVERY_COLOR,
        s=80,
        marker="^",
        zorder=5,
        edgecolors=PAGE_BG,
        linewidths=1.0,
    )

# Statistics box
stats_text = (
    f"Max Drawdown: {max_dd_value:.1f}%\n"
    f"Max DD Date: {max_dd_date.strftime('%Y-%m-%d')}\n"
    f"Peak to Trough: {(max_dd_date - peak_date).days} days\n"
    f"Recovery: {recovery_days} days"
)
ax1.text(
    0.02,
    0.04,
    stats_text,
    transform=ax1.transAxes,
    fontsize=8,
    verticalalignment="bottom",
    bbox={"boxstyle": "round,pad=0.4", "facecolor": ELEVATED_BG, "alpha": 0.9, "edgecolor": INK_SOFT},
    color=INK_SOFT,
)

# Primary axis style
ax1.set_xlabel("Date", fontsize=10, color=INK)
ax1.set_ylabel("Drawdown (%)", fontsize=10, color=INK)
ax1.set_title("drawdown-basic · python · matplotlib · anyplot.ai", fontsize=12, fontweight="medium", color=INK)
ax1.tick_params(axis="both", labelsize=8, colors=INK_SOFT)
ax1.yaxis.grid(True, alpha=0.10, linewidth=0.8, color=INK)
ax1.yaxis.set_major_formatter(plt.FuncFormatter(lambda x, _: f"{x:.0f}%"))
ax1.set_ylim(min(drawdown) * 1.15, 5)
ax1.spines["top"].set_visible(False)
ax1.spines["right"].set_visible(False)
ax1.spines["left"].set_color(INK_SOFT)
ax1.spines["bottom"].set_color(INK_SOFT)

# Legend
custom_handles = [
    Patch(facecolor=DRAWDOWN_COLOR, alpha=0.35),
    Line2D([0], [0], marker="^", color="w", markerfacecolor=RECOVERY_COLOR, markersize=8),
    Line2D([0], [0], color=INK_MUTED, linewidth=1.0, alpha=0.5),
]
custom_labels = ["Drawdown", "New High (Recovery)", "Portfolio Value"]
leg = ax1.legend(handles=custom_handles, labels=custom_labels, loc="upper right", fontsize=8)
if leg:
    leg.get_frame().set_facecolor(ELEVATED_BG)
    leg.get_frame().set_edgecolor(INK_SOFT)
    plt.setp(leg.get_texts(), color=INK_SOFT)

fig.subplots_adjust(left=0.08, right=0.85, top=0.92, bottom=0.12)
plt.savefig(f"plot-{THEME}.png", dpi=400, facecolor=PAGE_BG)
Runnable source as JSON, for any HTTP client: https://api.anyplot.ai/specs/drawdown-basic/matplotlib/code. Any spec id and library id listed in llms-full.txt fit the same URL shape; every URL below is complete and callable.
{
  "spec_id": "drawdown-basic",
  "language": "python",
  "library": "matplotlib",
  "page": "https://anyplot.ai/drawdown-basic/python/matplotlib",
  "hub": "https://anyplot.ai/drawdown-basic",
  "code_json": "https://api.anyplot.ai/specs/drawdown-basic/matplotlib/code",
  "spec_json": "https://api.anyplot.ai/specs/drawdown-basic",
  "render_light_png": "https://storage.googleapis.com/anyplot-images/plots/drawdown-basic/python/matplotlib/plot-light.png",
  "render_dark_png": "https://storage.googleapis.com/anyplot-images/plots/drawdown-basic/python/matplotlib/plot-dark.png",
  "quality_score": 91.0,
  "license": "MIT",
  "guide": "https://anyplot.ai/llms.txt"
}
Part of Drawdown Chart on anyplot.ai.