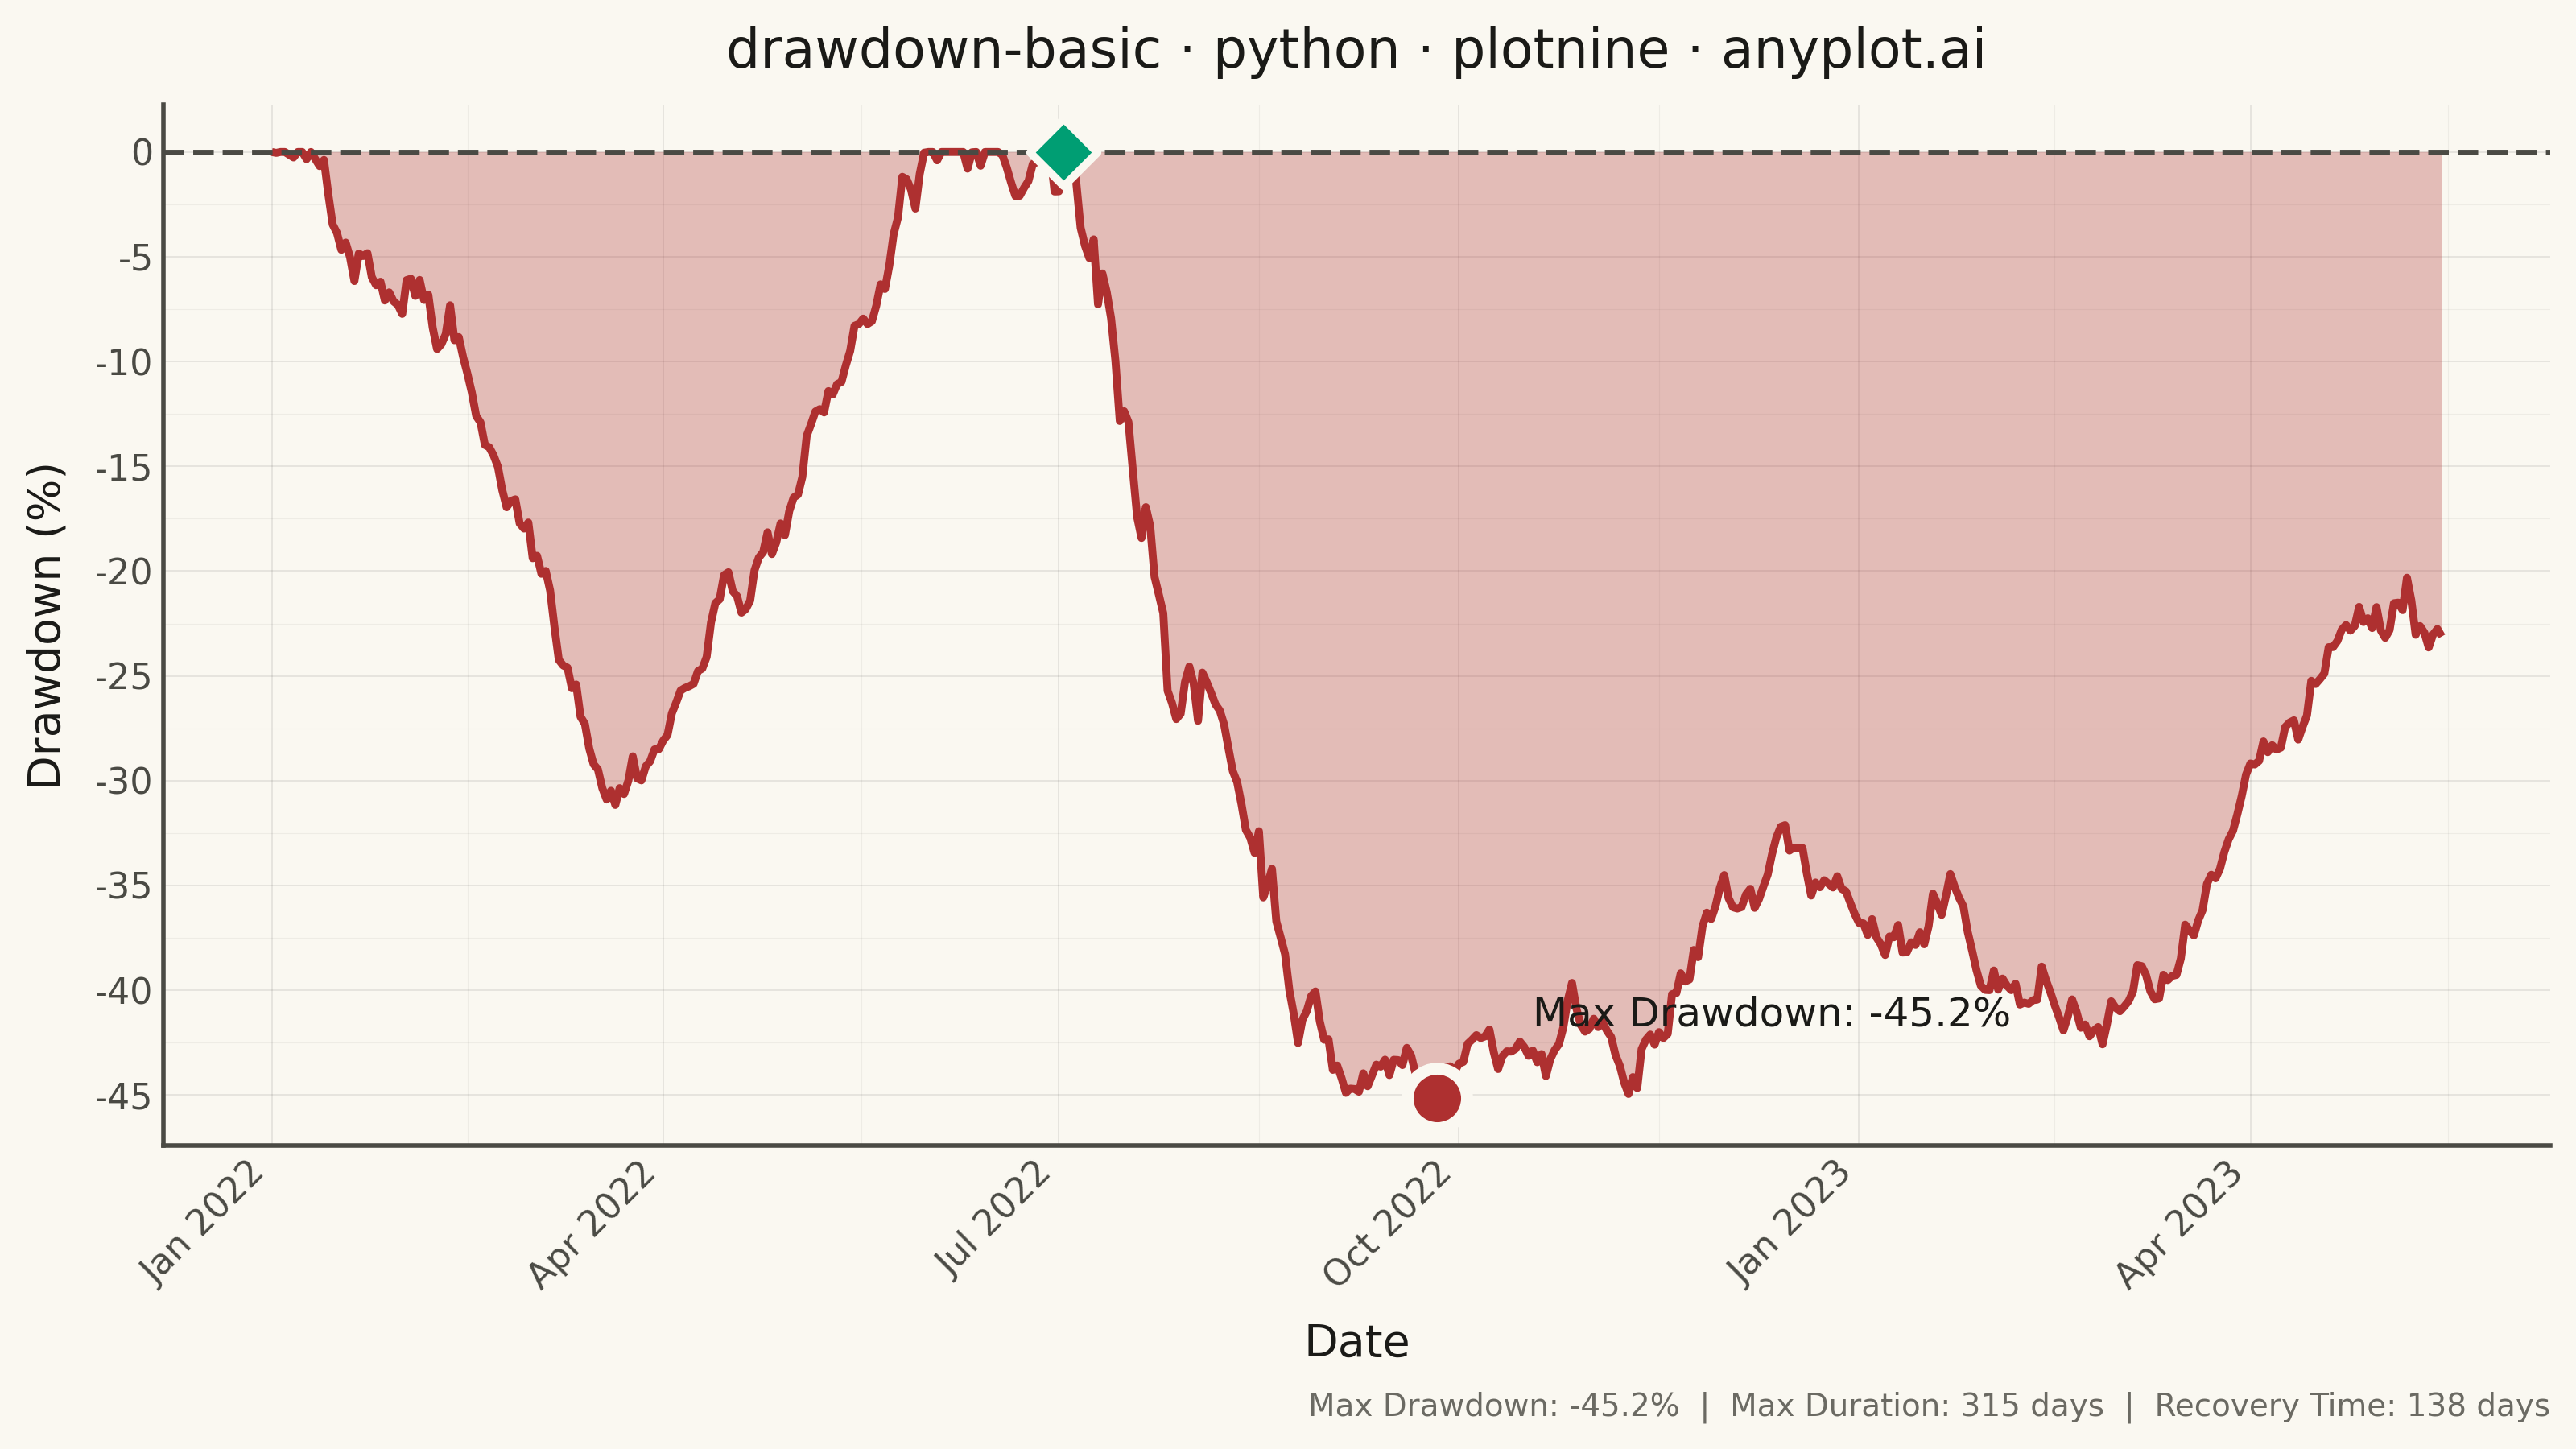
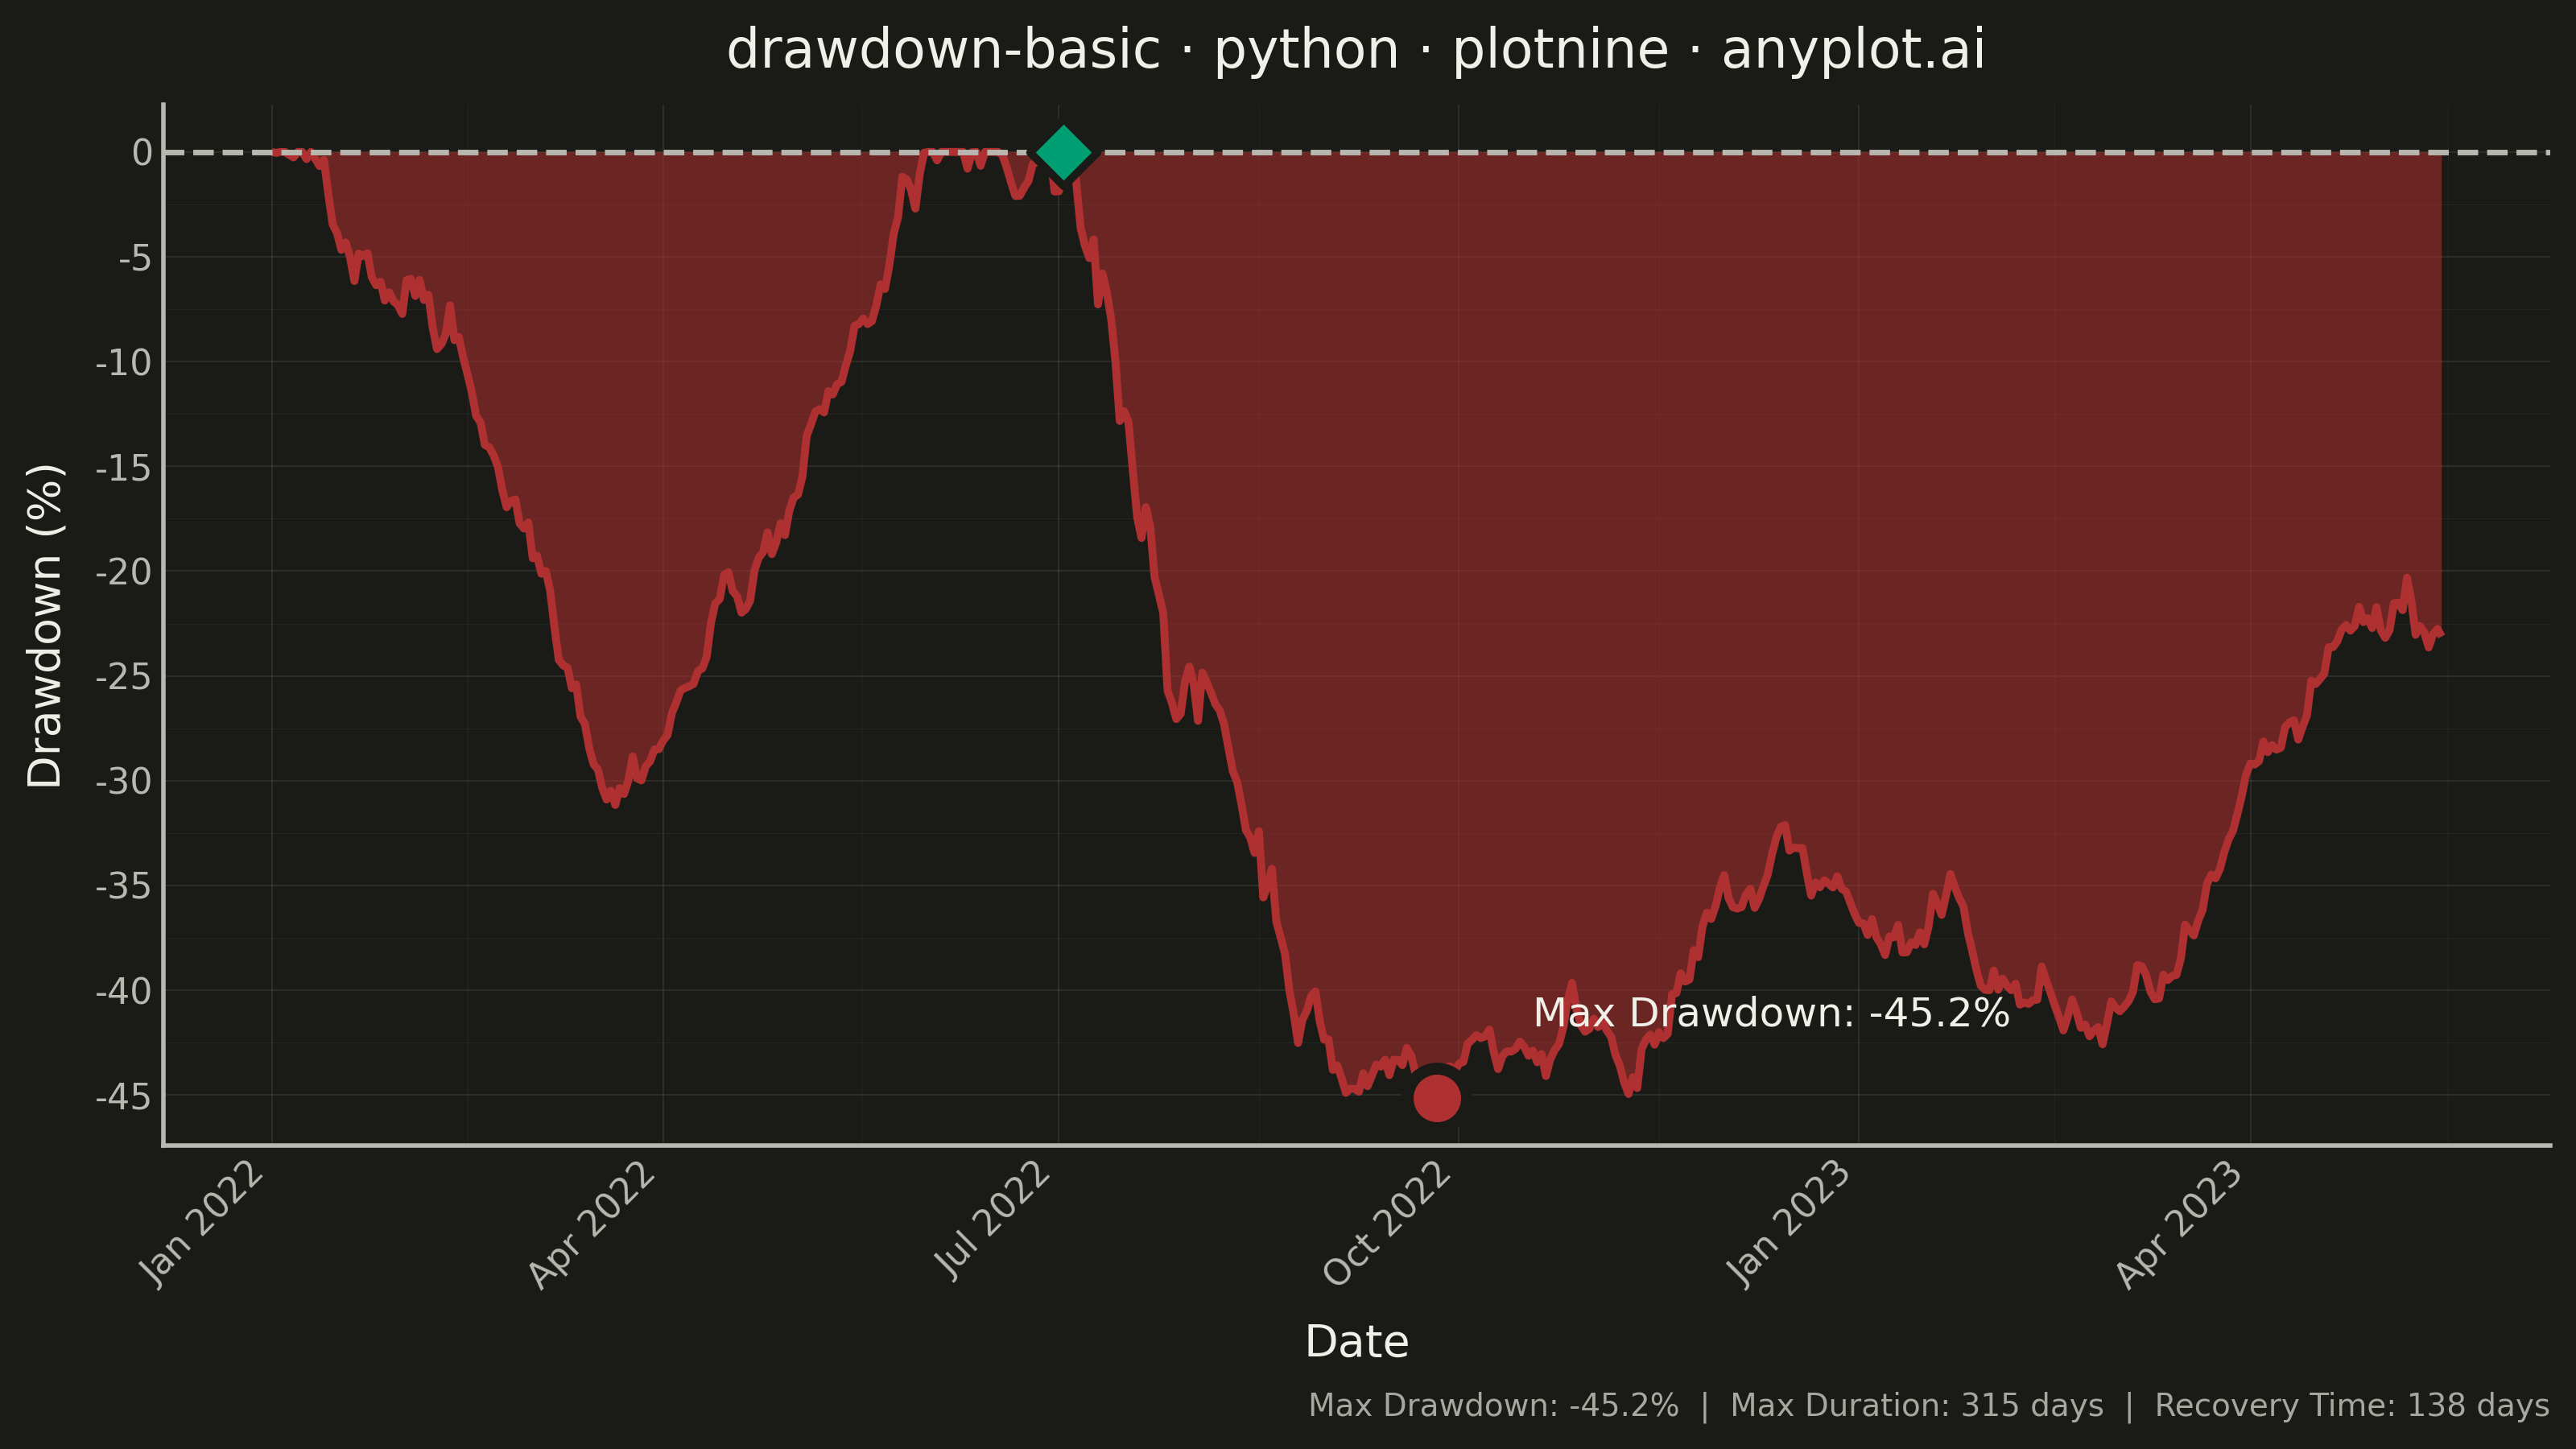
A drawdown chart visualizes the percentage decline from peak value over time, showing how far an investment or asset has fallen from its highest point. This chart is essential for risk assessment and understanding the magnitude of losses during unfavorable market periods. The filled area below the zero line emphasizes the depth and duration of drawdowns, making it easy to identify maximum drawdown periods and recovery points.
""" anyplot.ai
drawdown-basic: Drawdown Chart
Library: plotnine 0.15.4 | Python 3.13.13
Quality: 83/100 | Updated: 2026-05-23
"""

import os

import numpy as np
import pandas as pd
from plotnine import (
    aes,
    annotate,
    element_line,
    element_rect,
    element_text,
    geom_hline,
    geom_line,
    geom_point,
    geom_ribbon,
    ggplot,
    labs,
    scale_x_datetime,
    scale_y_continuous,
    theme,
    theme_minimal,
)


# Theme tokens
THEME = os.getenv("ANYPLOT_THEME", "light")
PAGE_BG = "#FAF8F1" if THEME == "light" else "#1A1A17"
INK = "#1A1A17" if THEME == "light" else "#F0EFE8"
INK_SOFT = "#4A4A44" if THEME == "light" else "#B8B7B0"
INK_MUTED = "#6B6A63" if THEME == "light" else "#A8A79F"

DRAWDOWN_COLOR = "#AE3030"  # anyplot red — semantic: losses / drawdown
RECOVERY_COLOR = "#009E73"  # anyplot green — semantic: recovery / new high
# Higher alpha in dark mode so ribbon remains visible over near-black background
RIBBON_ALPHA = 0.30 if THEME == "light" else 0.55

# Data — synthetic portfolio with realistic drawdown patterns including one full recovery
np.random.seed(42)
n_days = 500
dates = pd.date_range(start="2022-01-01", periods=n_days, freq="D")

returns = np.random.normal(0.0008, 0.009, n_days)
# First moderate drawdown (~15% peak-to-trough)
returns[40:80] = np.random.normal(-0.004, 0.010, 40)
# Strong recovery to new all-time high — ensures at least one full recovery cycle
returns[80:160] = np.random.normal(0.005, 0.008, 80)
# Second major drawdown — becomes the maximum drawdown
returns[180:250] = np.random.normal(-0.007, 0.015, 70)
# Partial recovery — does not reach new ATH
returns[250:350] = np.random.normal(0.002, 0.012, 100)
# Secondary dip
returns[350:420] = np.random.normal(-0.003, 0.012, 70)
# Slow tail
returns[420:500] = np.random.normal(0.001, 0.010, 80)

price = 100 * np.cumprod(1 + returns)

df = pd.DataFrame({"date": dates, "price": price})
df["running_max"] = df["price"].cummax()
df["drawdown"] = (df["price"] - df["running_max"]) / df["running_max"] * 100
df["zero"] = 0.0

# Maximum drawdown statistics
max_dd_idx = df["drawdown"].idxmin()
max_dd_value = df.loc[max_dd_idx, "drawdown"]
max_dd_date = df.loc[max_dd_idx, "date"]
max_drawdown = df["drawdown"].min()

# Max drawdown duration
df["in_drawdown"] = df["drawdown"] < -0.5
drawdown_groups = (df["in_drawdown"] != df["in_drawdown"].shift()).cumsum()
drawdown_durations = df[df["in_drawdown"]].groupby(drawdown_groups).size()
max_duration = int(drawdown_durations.max()) if len(drawdown_durations) > 0 else 0

# Recovery points: where drawdown transitions back to 0 (new all-time highs)
prev_drawdown = df["drawdown"].shift(1, fill_value=0.0)
recovery_mask = (df["drawdown"] >= -0.01) & (prev_drawdown < -1.0)
recovery_df = df[recovery_mask].copy()

# Recovery time: days from first drawdown entry to first complete recovery
recovery_time = None
drawdown_start_idx = None
for i in range(len(df)):
    if df["drawdown"].iloc[i] < -1.0 and drawdown_start_idx is None:
        drawdown_start_idx = i
    elif drawdown_start_idx is not None and df["drawdown"].iloc[i] >= -0.01:
        recovery_time = (df["date"].iloc[i] - df["date"].iloc[drawdown_start_idx]).days
        break

# Single-row DataFrame for max drawdown marker
max_dd_df = df.iloc[[max_dd_idx]].copy()

# Caption with all three spec-required statistics
if recovery_time is not None:
    stats_label = (
        f"Max Drawdown: {max_drawdown:.1f}%  |  "
        f"Max Duration: {max_duration} days  |  "
        f"Recovery Time: {recovery_time} days"
    )
else:
    stats_label = f"Max Drawdown: {max_drawdown:.1f}%  |  Max Duration: {max_duration} days"

# Dynamic y-axis range to fit the data
y_min = int(np.floor(max_drawdown / 5) * 5) - 5
y_breaks = list(range(y_min, 5, 5))

# Plot
plot = (
    ggplot(df, aes(x="date", y="drawdown"))
    + geom_ribbon(aes(ymin="drawdown", ymax="zero"), fill=DRAWDOWN_COLOR, alpha=RIBBON_ALPHA)
    + geom_line(color=DRAWDOWN_COLOR, size=1.0)
    + geom_hline(yintercept=0, linetype="dashed", color=INK_SOFT, size=0.7)
    + geom_point(
        aes(x="date", y="drawdown"), data=max_dd_df, color=PAGE_BG, fill=DRAWDOWN_COLOR, size=6, shape="o", stroke=1.5
    )
    + annotate(
        geom="text",
        x=max_dd_date + pd.Timedelta(days=22),
        y=max_dd_value + 4,
        label=f"Max Drawdown: {max_drawdown:.1f}%",
        size=9,
        color=INK,
        ha="left",
    )
    + labs(x="Date", y="Drawdown (%)", title="drawdown-basic · python · plotnine · anyplot.ai", caption=stats_label)
    + scale_x_datetime(date_breaks="3 months", date_labels="%b %Y")
    + scale_y_continuous(breaks=y_breaks)
    + theme_minimal()
    + theme(
        figure_size=(8, 4.5),
        text=element_text(size=7),
        axis_title=element_text(size=10, color=INK),
        axis_text=element_text(size=8, color=INK_SOFT),
        axis_text_x=element_text(angle=45, ha="right", color=INK_SOFT),
        plot_title=element_text(size=12, color=INK),
        plot_caption=element_text(size=7, color=INK_MUTED),
        plot_background=element_rect(fill=PAGE_BG, color=PAGE_BG),
        panel_background=element_rect(fill=PAGE_BG),
        panel_grid_major=element_line(color=INK, size=0.3, alpha=0.10),
        panel_grid_minor=element_line(color=INK, size=0.2, alpha=0.05),
        axis_line=element_line(color=INK_SOFT),
    )
)

# Mark recovery points (new all-time highs after drawdown) with green diamonds
if len(recovery_df) > 0:
    plot = plot + geom_point(
        aes(x="date", y="zero"), data=recovery_df, color=PAGE_BG, fill=RECOVERY_COLOR, size=5, shape="D", stroke=1.0
    )

# Save
plot.save(f"plot-{THEME}.png", dpi=400, width=8, height=4.5, units="in")
Runnable source as JSON, for any HTTP client: https://api.anyplot.ai/specs/drawdown-basic/plotnine/code. Any spec id and library id listed in llms-full.txt fit the same URL shape; every URL below is complete and callable.
{
  "spec_id": "drawdown-basic",
  "language": "python",
  "library": "plotnine",
  "page": "https://anyplot.ai/drawdown-basic/python/plotnine",
  "hub": "https://anyplot.ai/drawdown-basic",
  "code_json": "https://api.anyplot.ai/specs/drawdown-basic/plotnine/code",
  "spec_json": "https://api.anyplot.ai/specs/drawdown-basic",
  "render_light_png": "https://storage.googleapis.com/anyplot-images/plots/drawdown-basic/python/plotnine/plot-light.png",
  "render_dark_png": "https://storage.googleapis.com/anyplot-images/plots/drawdown-basic/python/plotnine/plot-dark.png",
  "quality_score": 83.0,
  "license": "MIT",
  "guide": "https://anyplot.ai/llms.txt"
}
Part of Drawdown Chart on anyplot.ai.