The same plot in 14 other libraries — Python: Altair, Bokeh, lets-plot, Matplotlib, Plotly, plotnine, Pygal, Seaborn; R: ggplot2; JavaScript: Chart.js, D3.js, Apache ECharts, Highcharts, MUI X Charts. Compare all 15 side by side: Drawdown Chart in Python, R, Julia and JavaScript.
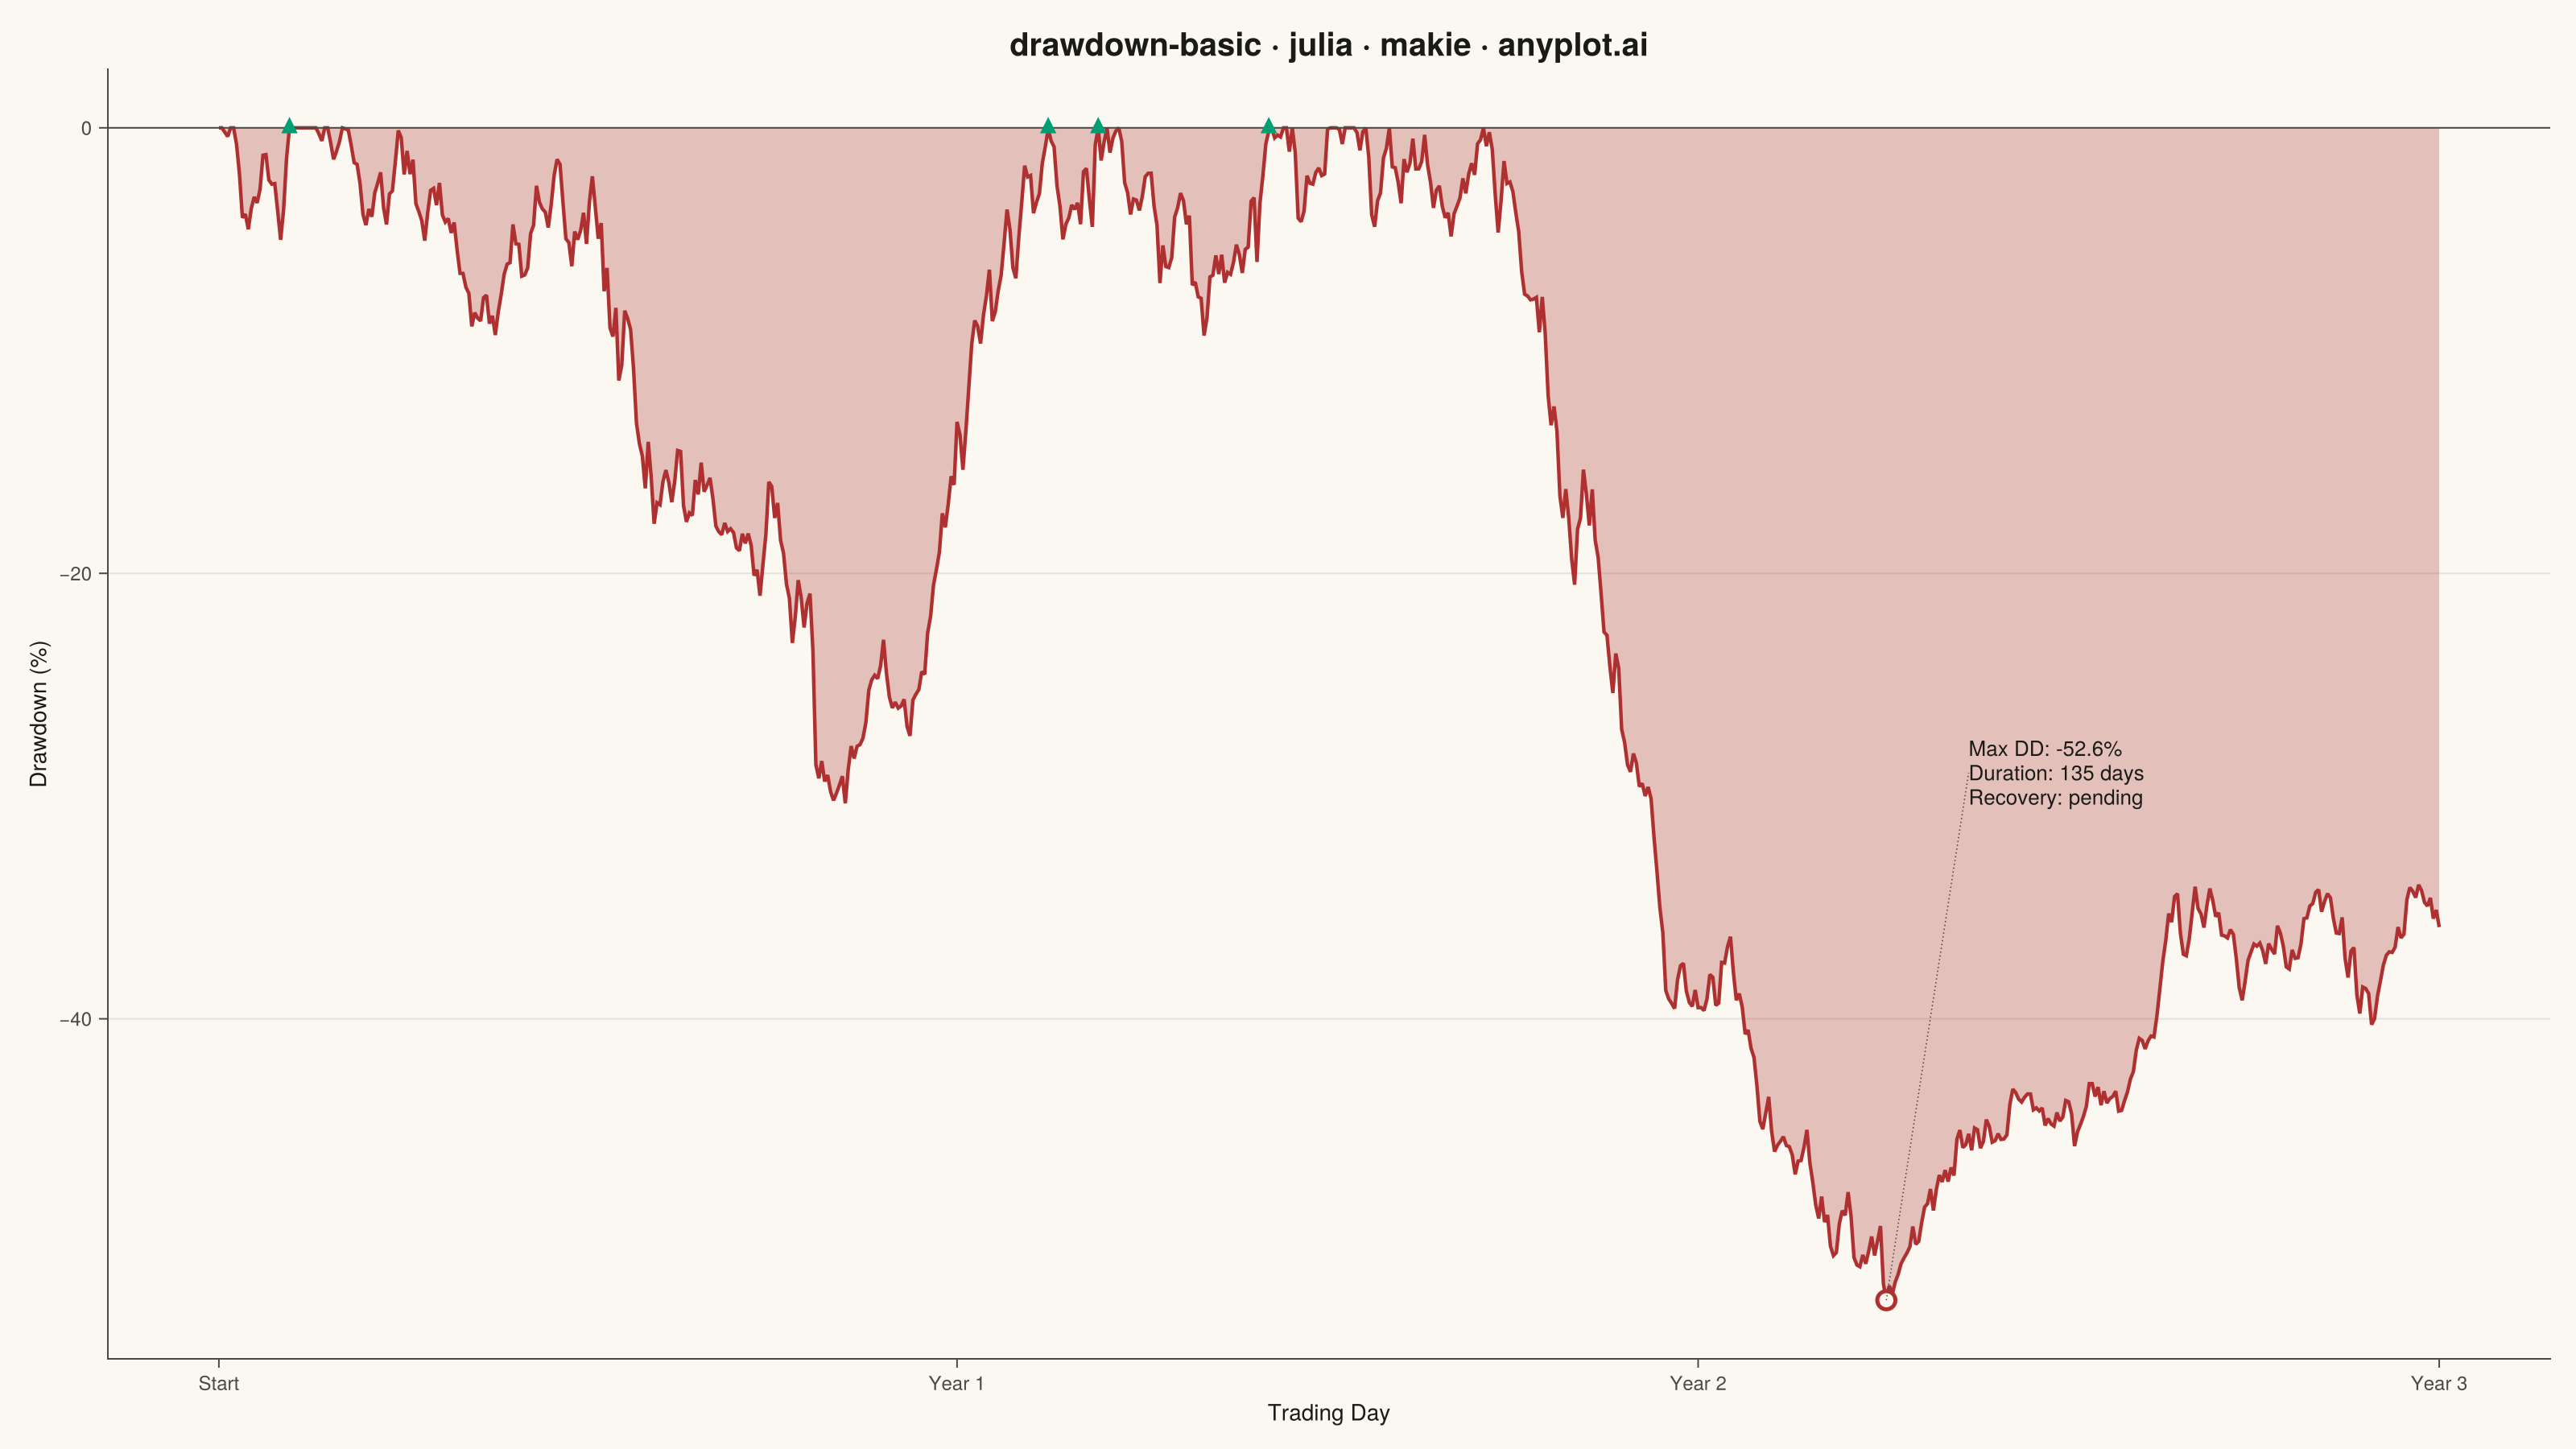
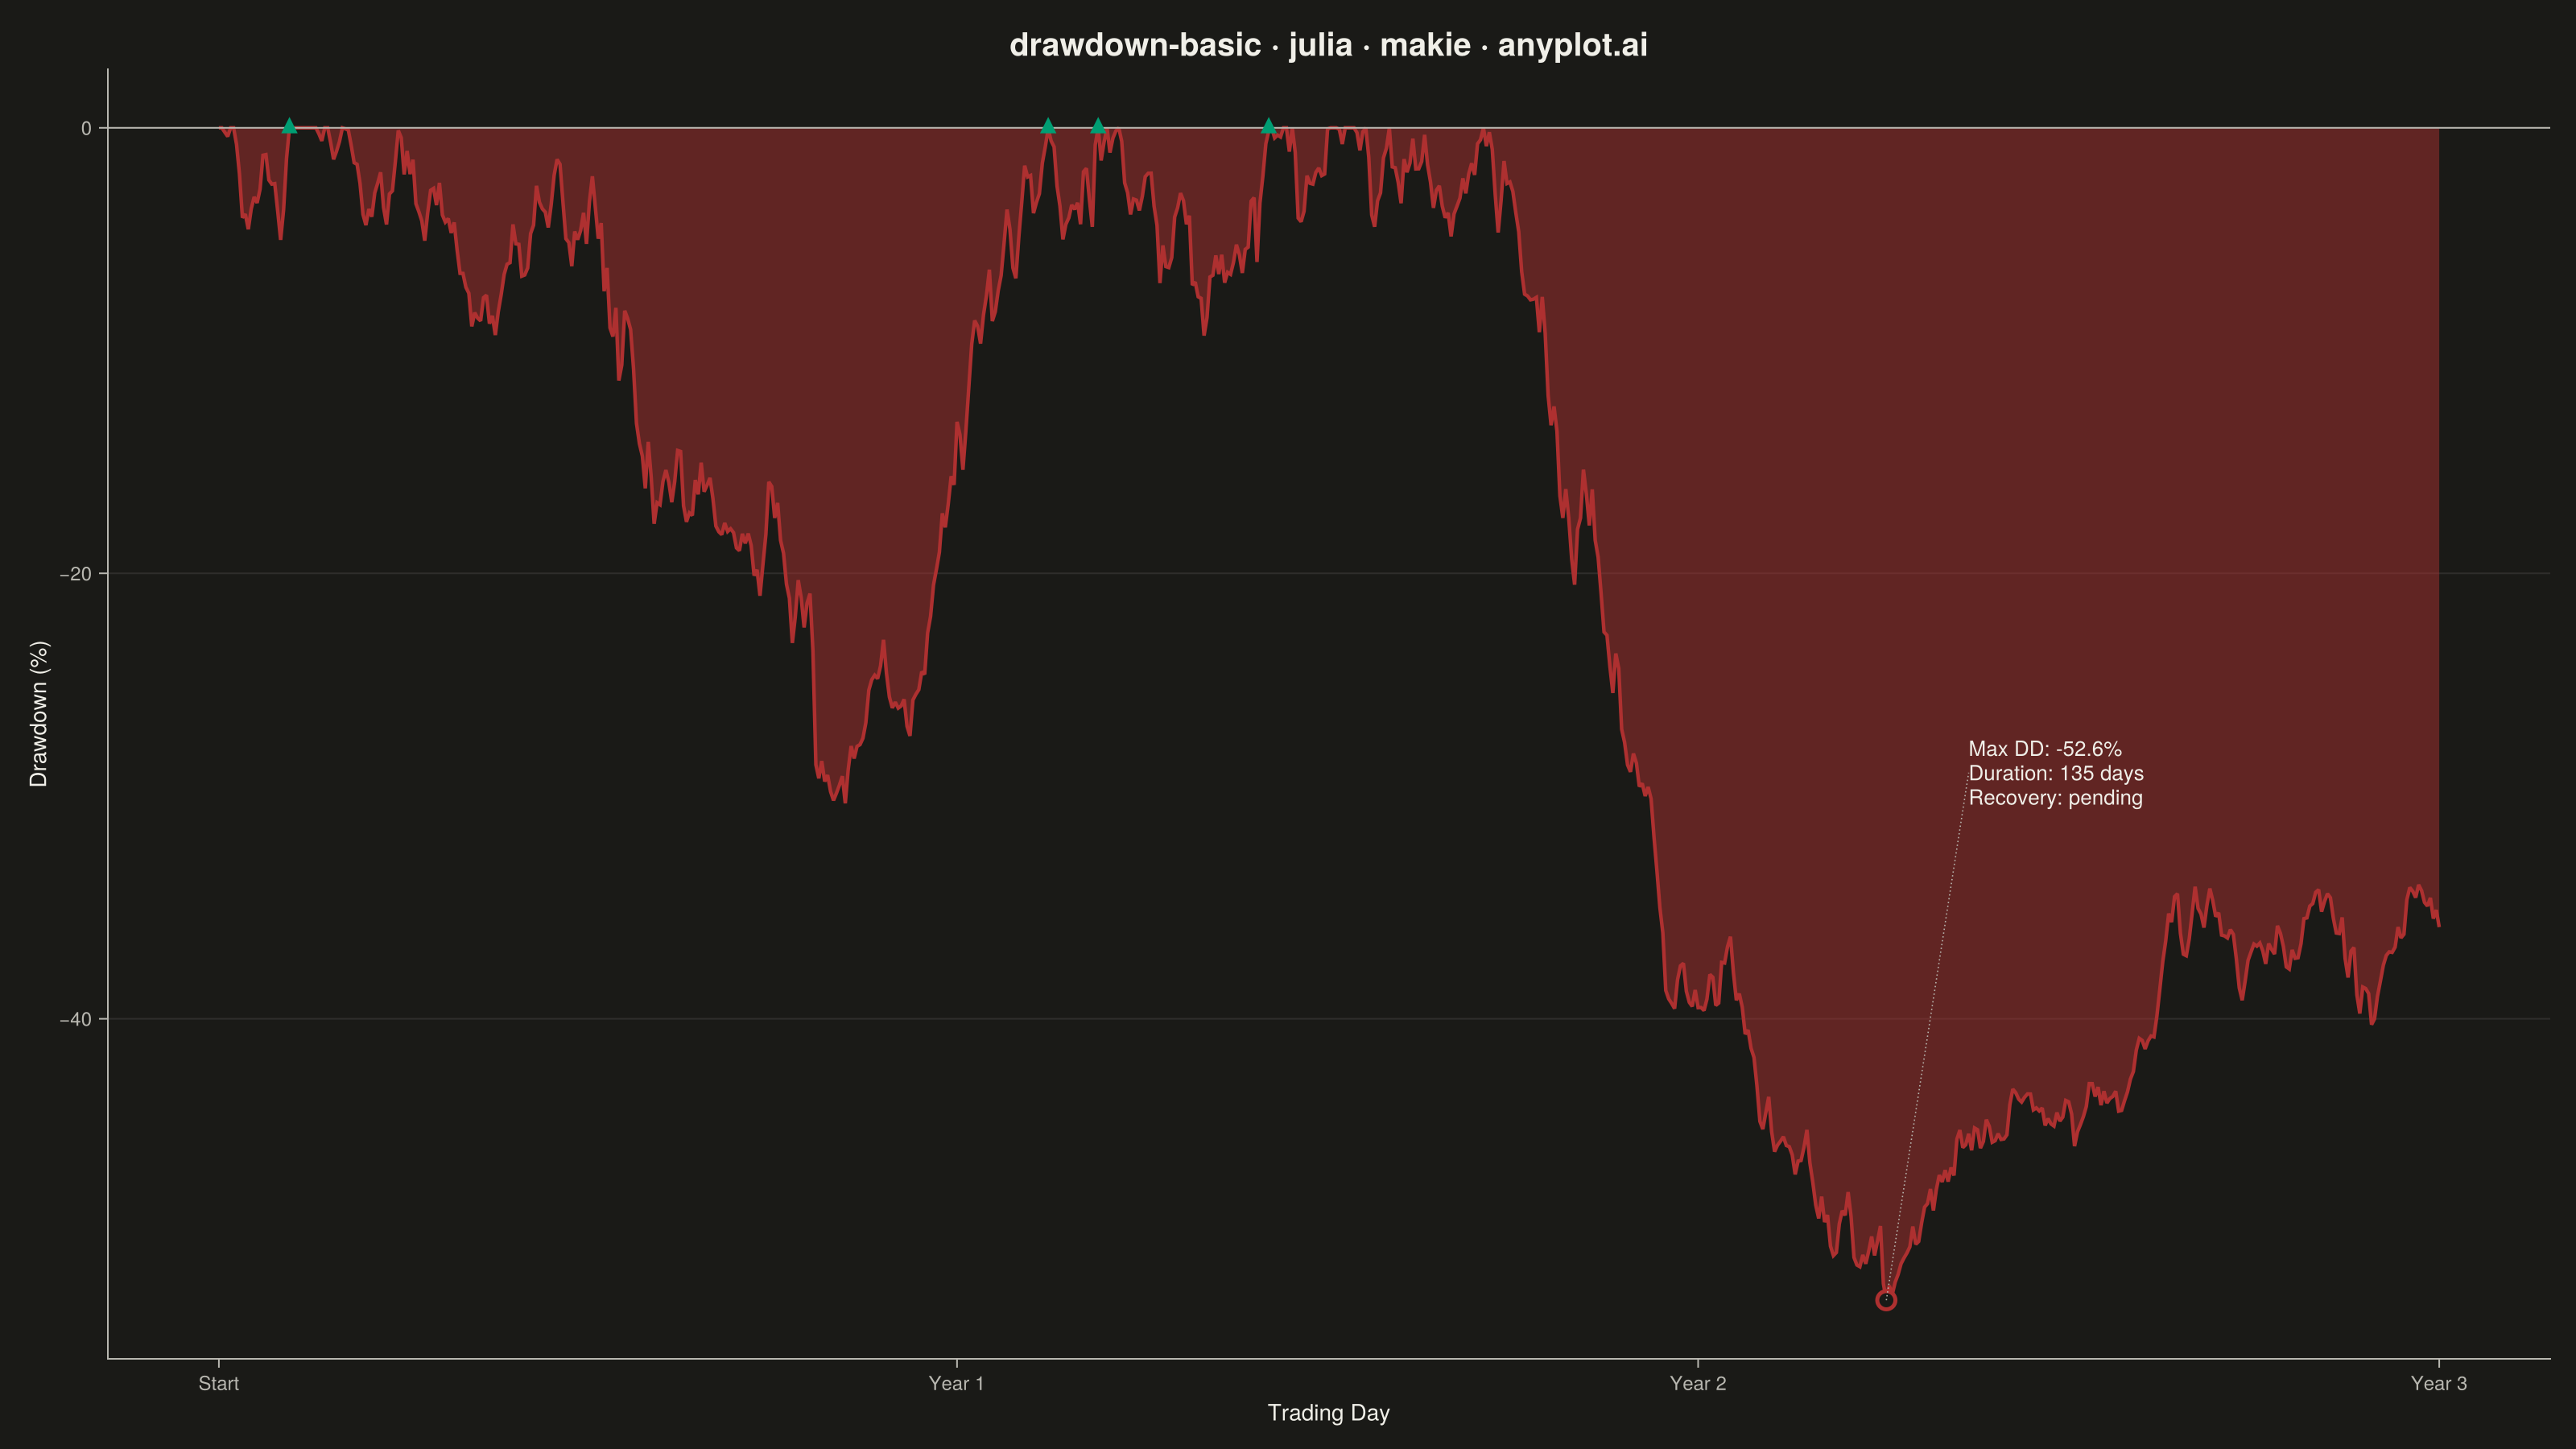
A drawdown chart visualizes the percentage decline from peak value over time, showing how far an investment or asset has fallen from its highest point. This chart is essential for risk assessment and understanding the magnitude of losses during unfavorable market periods. The filled area below the zero line emphasizes the depth and duration of drawdowns, making it easy to identify maximum drawdown periods and recovery points.
# anyplot.ai
# drawdown-basic: Drawdown Chart
# Library: makie 0.22.10 | Julia 1.11.9
# Quality: 87/100 | Created: 2026-05-23

using CairoMakie
using Colors
using Random

Random.seed!(42)

# Theme tokens
const THEME = get(ENV, "ANYPLOT_THEME", "light")
const PAGE_BG = THEME == "light" ? colorant"#FAF8F1" : colorant"#1A1A17"
const ELEVATED_BG = THEME == "light" ? colorant"#FFFDF6" : colorant"#242420"
const INK = THEME == "light" ? colorant"#1A1A17" : colorant"#F0EFE8"
const INK_SOFT = THEME == "light" ? colorant"#4A4A44" : colorant"#B8B7B0"
# Drawdown = loss → semantic red (Imprint palette position 3)
const DRAW_RED = colorant"#AE3030"
# Recovery = new high → anyplot green (palette position 1)
const RECOVER_GREEN = colorant"#009E73"

# Data: 756 trading days with two distinct drawdown episodes.
# Phase structure: growth → first correction → full recovery → growth → major correction → partial recovery
# Ensures at least one complete recovery point is detectable.
n_days = 756
phase_returns = vcat(
    0.0012 .+ 0.010 .* randn(120),   # bull phase: establish initial ATH
    -0.0030 .+ 0.016 .* randn(90),   # first correction: ~-24% drawdown
    0.0025 .+ 0.012 .* randn(160),   # strong recovery: surpasses previous ATH
    0.0008 .+ 0.009 .* randn(60),    # consolidation at new high
    -0.0035 .+ 0.015 .* randn(140),  # major correction: deeper ~-38% max DD
    0.0010 .+ 0.011 .* randn(186),   # partial recovery (unresolved)
)
nav = 100.0 .* cumprod(1.0 .+ phase_returns)

# Drawdown: percentage decline from running all-time high
running_peak = accumulate(max, nav)
drawdown = (nav .- running_peak) ./ running_peak .* 100.0

max_dd_idx = argmin(drawdown)
max_dd_val = drawdown[max_dd_idx]

days = collect(1:n_days)

# Detect recovery points: days where drawdown returns to near-zero after a ≥5% episode
# Use let block to avoid Julia soft-scope issues in top-level scripts
recovery_days = let in_ep = false, rdays = Int[]
    for i in 1:n_days
        if drawdown[i] < -5.0
            in_ep = true
        elseif in_ep && drawdown[i] >= -0.5
            push!(rdays, i)
            in_ep = false
        end
    end
    rdays
end

# Max DD duration: walk back from trough to episode start
max_dd_start = let s = max_dd_idx
    while s > 1 && drawdown[s - 1] < -0.5
        s -= 1
    end
    s
end
max_dd_duration = max_dd_idx - max_dd_start + 1

# Recovery time from max DD trough (nothing if unresolved)
max_dd_end_idx = findfirst(i -> i > max_dd_idx && drawdown[i] >= -0.5, 1:n_days)
recovery_label = max_dd_end_idx !== nothing ? "$(max_dd_end_idx - max_dd_idx) days" : "pending"

# Figure
fig = Figure(
    resolution = (1600, 900),
    fontsize = 14,
    backgroundcolor = PAGE_BG,
)

ax = Axis(
    fig[1, 1];
    title = "drawdown-basic · julia · makie · anyplot.ai",
    titlesize = 20,
    titlecolor = INK,
    xlabel = "Trading Day",
    ylabel = "Drawdown (%)",
    xlabelsize = 14,
    ylabelsize = 14,
    xticklabelsize = 12,
    yticklabelsize = 12,
    xlabelcolor = INK,
    ylabelcolor = INK,
    xticklabelcolor = INK_SOFT,
    yticklabelcolor = INK_SOFT,
    xtickcolor = INK_SOFT,
    ytickcolor = INK_SOFT,
    backgroundcolor = PAGE_BG,
    topspinevisible = false,
    rightspinevisible = false,
    leftspinecolor = INK_SOFT,
    bottomspinecolor = INK_SOFT,
    xticks = ([1, 252, 504, 756], ["Start", "Year 1", "Year 2", "Year 3"]),
    xgridvisible = false,
    ygridcolor = RGBAf(INK.r, INK.g, INK.b, 0.10),
    yminorgridvisible = false,
    xminorgridvisible = false,
)

# Filled drawdown area — more opaque on dark theme for visibility
fill_alpha = THEME == "light" ? 0.28 : 0.48
band!(ax, days, drawdown, zeros(n_days); color = (DRAW_RED, fill_alpha))

# Drawdown line
lines!(ax, days, drawdown; color = DRAW_RED, linewidth = 2.2)

# Zero baseline reference
hlines!(ax, [0.0]; color = INK_SOFT, linewidth = 1.0)

# Recovery point markers: green upward triangles at zero baseline (new all-time highs)
if !isempty(recovery_days)
    scatter!(ax, Float64.(recovery_days), zeros(length(recovery_days));
        marker = :utriangle,
        color = RECOVER_GREEN,
        markersize = 14,
        strokewidth = 0,
    )
end

# Max DD marker — hollow circle at the trough
scatter!(ax, [Float64(max_dd_idx)], [max_dd_val];
    color = PAGE_BG, markersize = 16,
    strokewidth = 2.5, strokecolor = DRAW_RED)

# Dotted leader line connecting trough to annotation
ann_x = min(Float64(max_dd_idx) + 30, Float64(n_days) - 160)
ann_y = max_dd_val * 0.55
lines!(ax, [Float64(max_dd_idx), ann_x], [max_dd_val, ann_y];
    color = INK_SOFT, linewidth = 0.8, linestyle = :dot)

# Multi-line annotation: max DD percentage, duration, and recovery time
stats_text = "Max DD: $(round(max_dd_val, digits=1))%\nDuration: $(max_dd_duration) days\nRecovery: $(recovery_label)"
text!(ax, ann_x, ann_y;
    text = stats_text,
    align = (:left, :center),
    color = INK,
    fontsize = 13,
)

# Save
save("plot-$(THEME).png", fig; px_per_unit = 2)
Runnable source as JSON, for any HTTP client: https://api.anyplot.ai/specs/drawdown-basic/makie/code. Any spec id and library id listed in llms-full.txt fit the same URL shape; every URL below is complete and callable.
{
  "spec_id": "drawdown-basic",
  "language": "julia",
  "library": "makie",
  "page": "https://anyplot.ai/drawdown-basic/julia/makie",
  "hub": "https://anyplot.ai/drawdown-basic",
  "code_json": "https://api.anyplot.ai/specs/drawdown-basic/makie/code",
  "spec_json": "https://api.anyplot.ai/specs/drawdown-basic",
  "render_light_png": "https://storage.googleapis.com/anyplot-images/plots/drawdown-basic/julia/makie/plot-light.png",
  "render_dark_png": "https://storage.googleapis.com/anyplot-images/plots/drawdown-basic/julia/makie/plot-dark.png",
  "quality_score": 87.0,
  "license": "MIT",
  "guide": "https://anyplot.ai/llms.txt"
}
Part of Drawdown Chart on anyplot.ai.