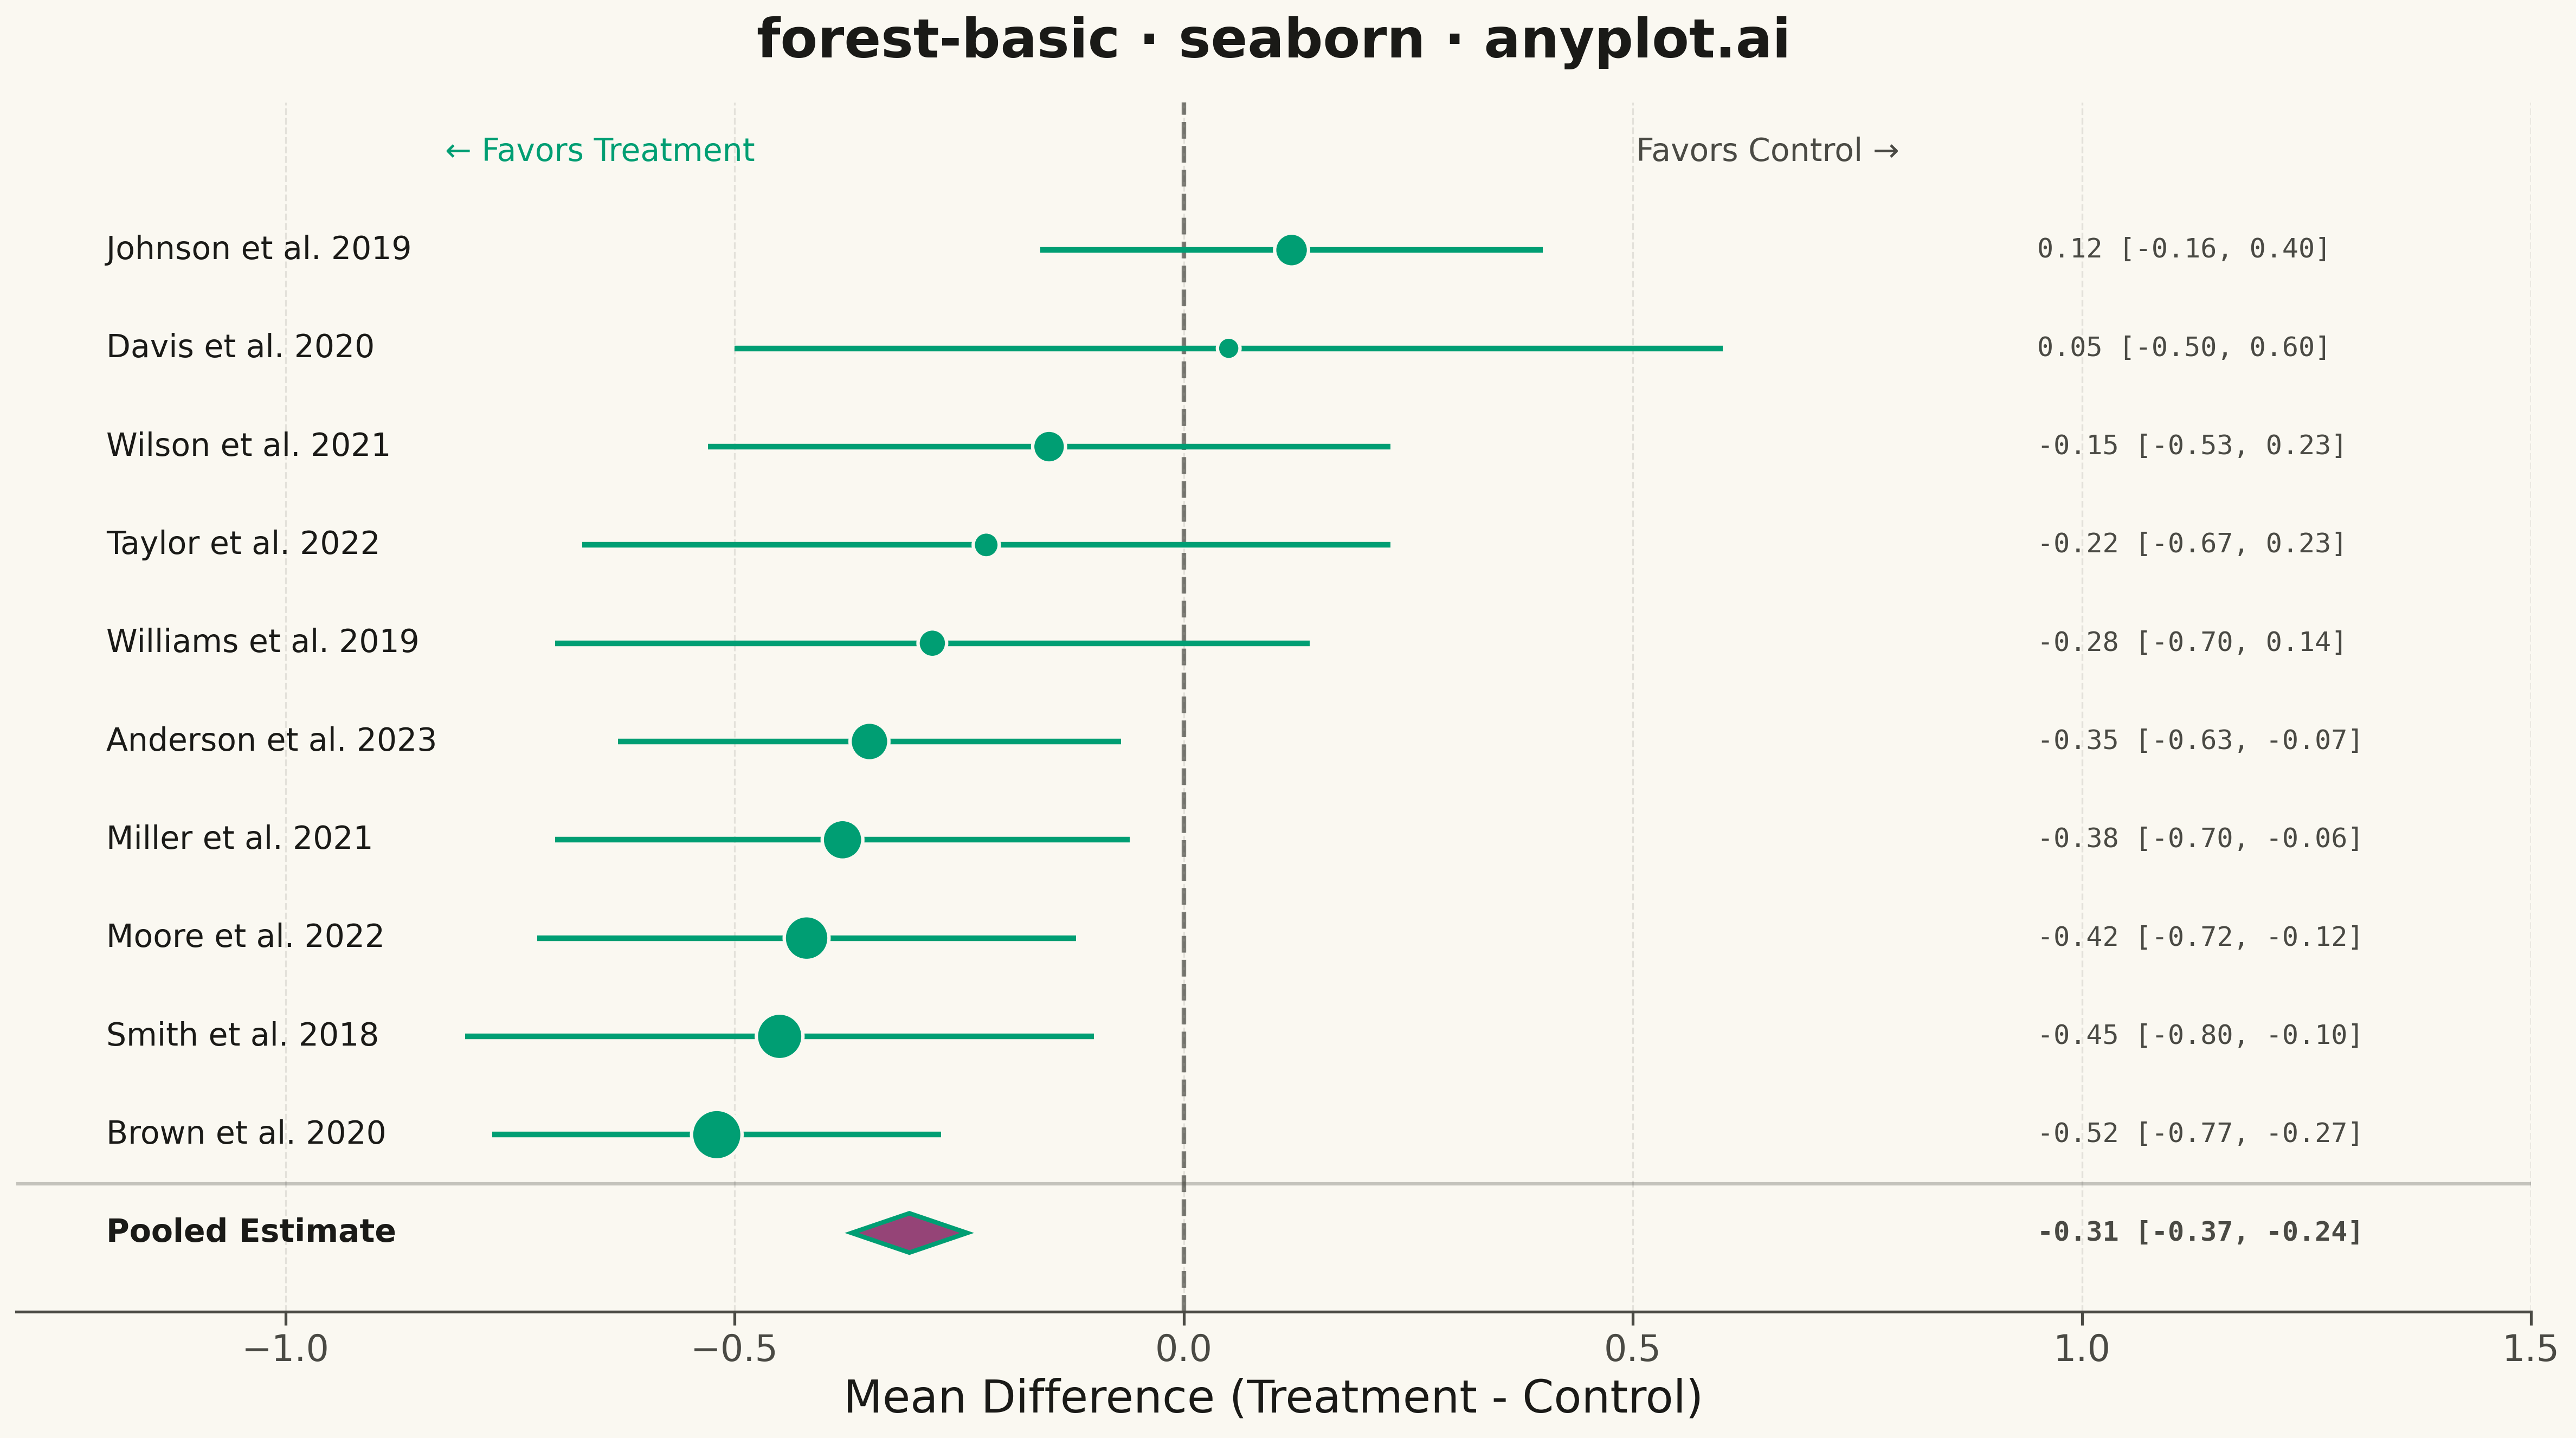
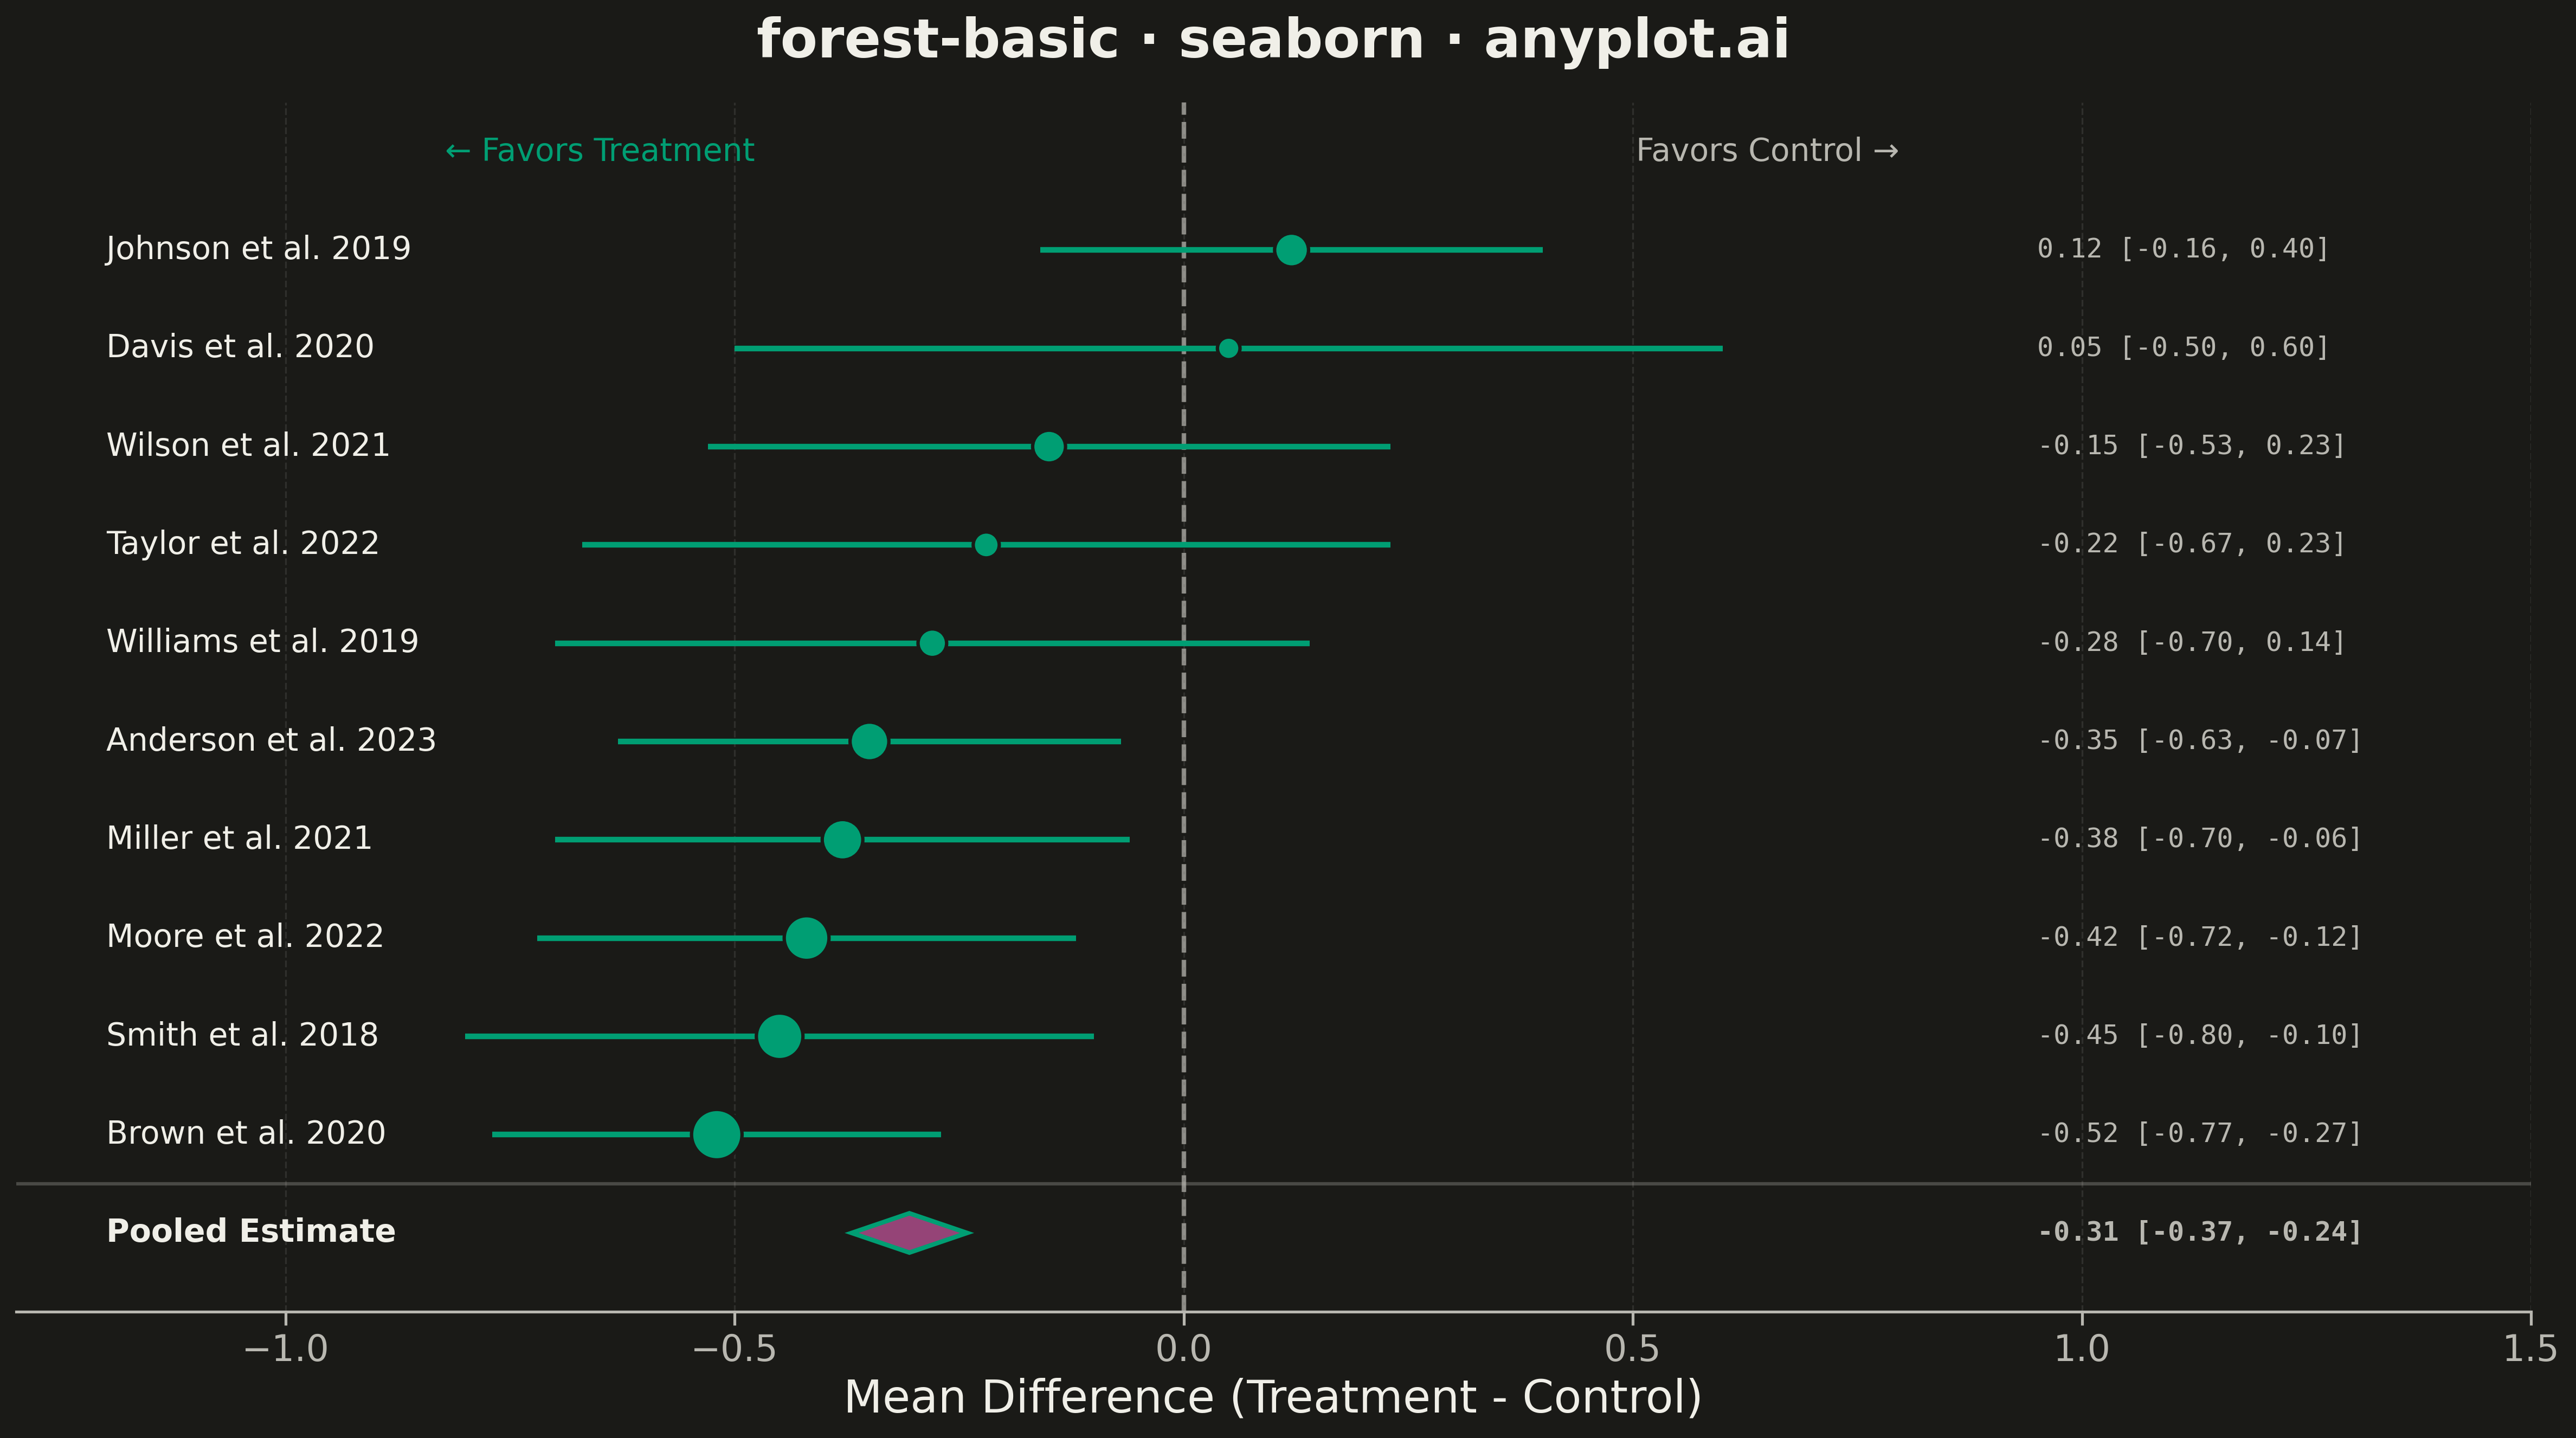
A forest plot displays effect sizes with confidence intervals from multiple studies in a meta-analysis. Each study is represented as a point estimate with horizontal whiskers showing the confidence interval, and a diamond at the bottom shows the pooled estimate. The plot includes a vertical reference line at the null effect (typically 0 or 1), making it easy to assess statistical significance and heterogeneity across studies.
Preview render from the Seaborn implementation.