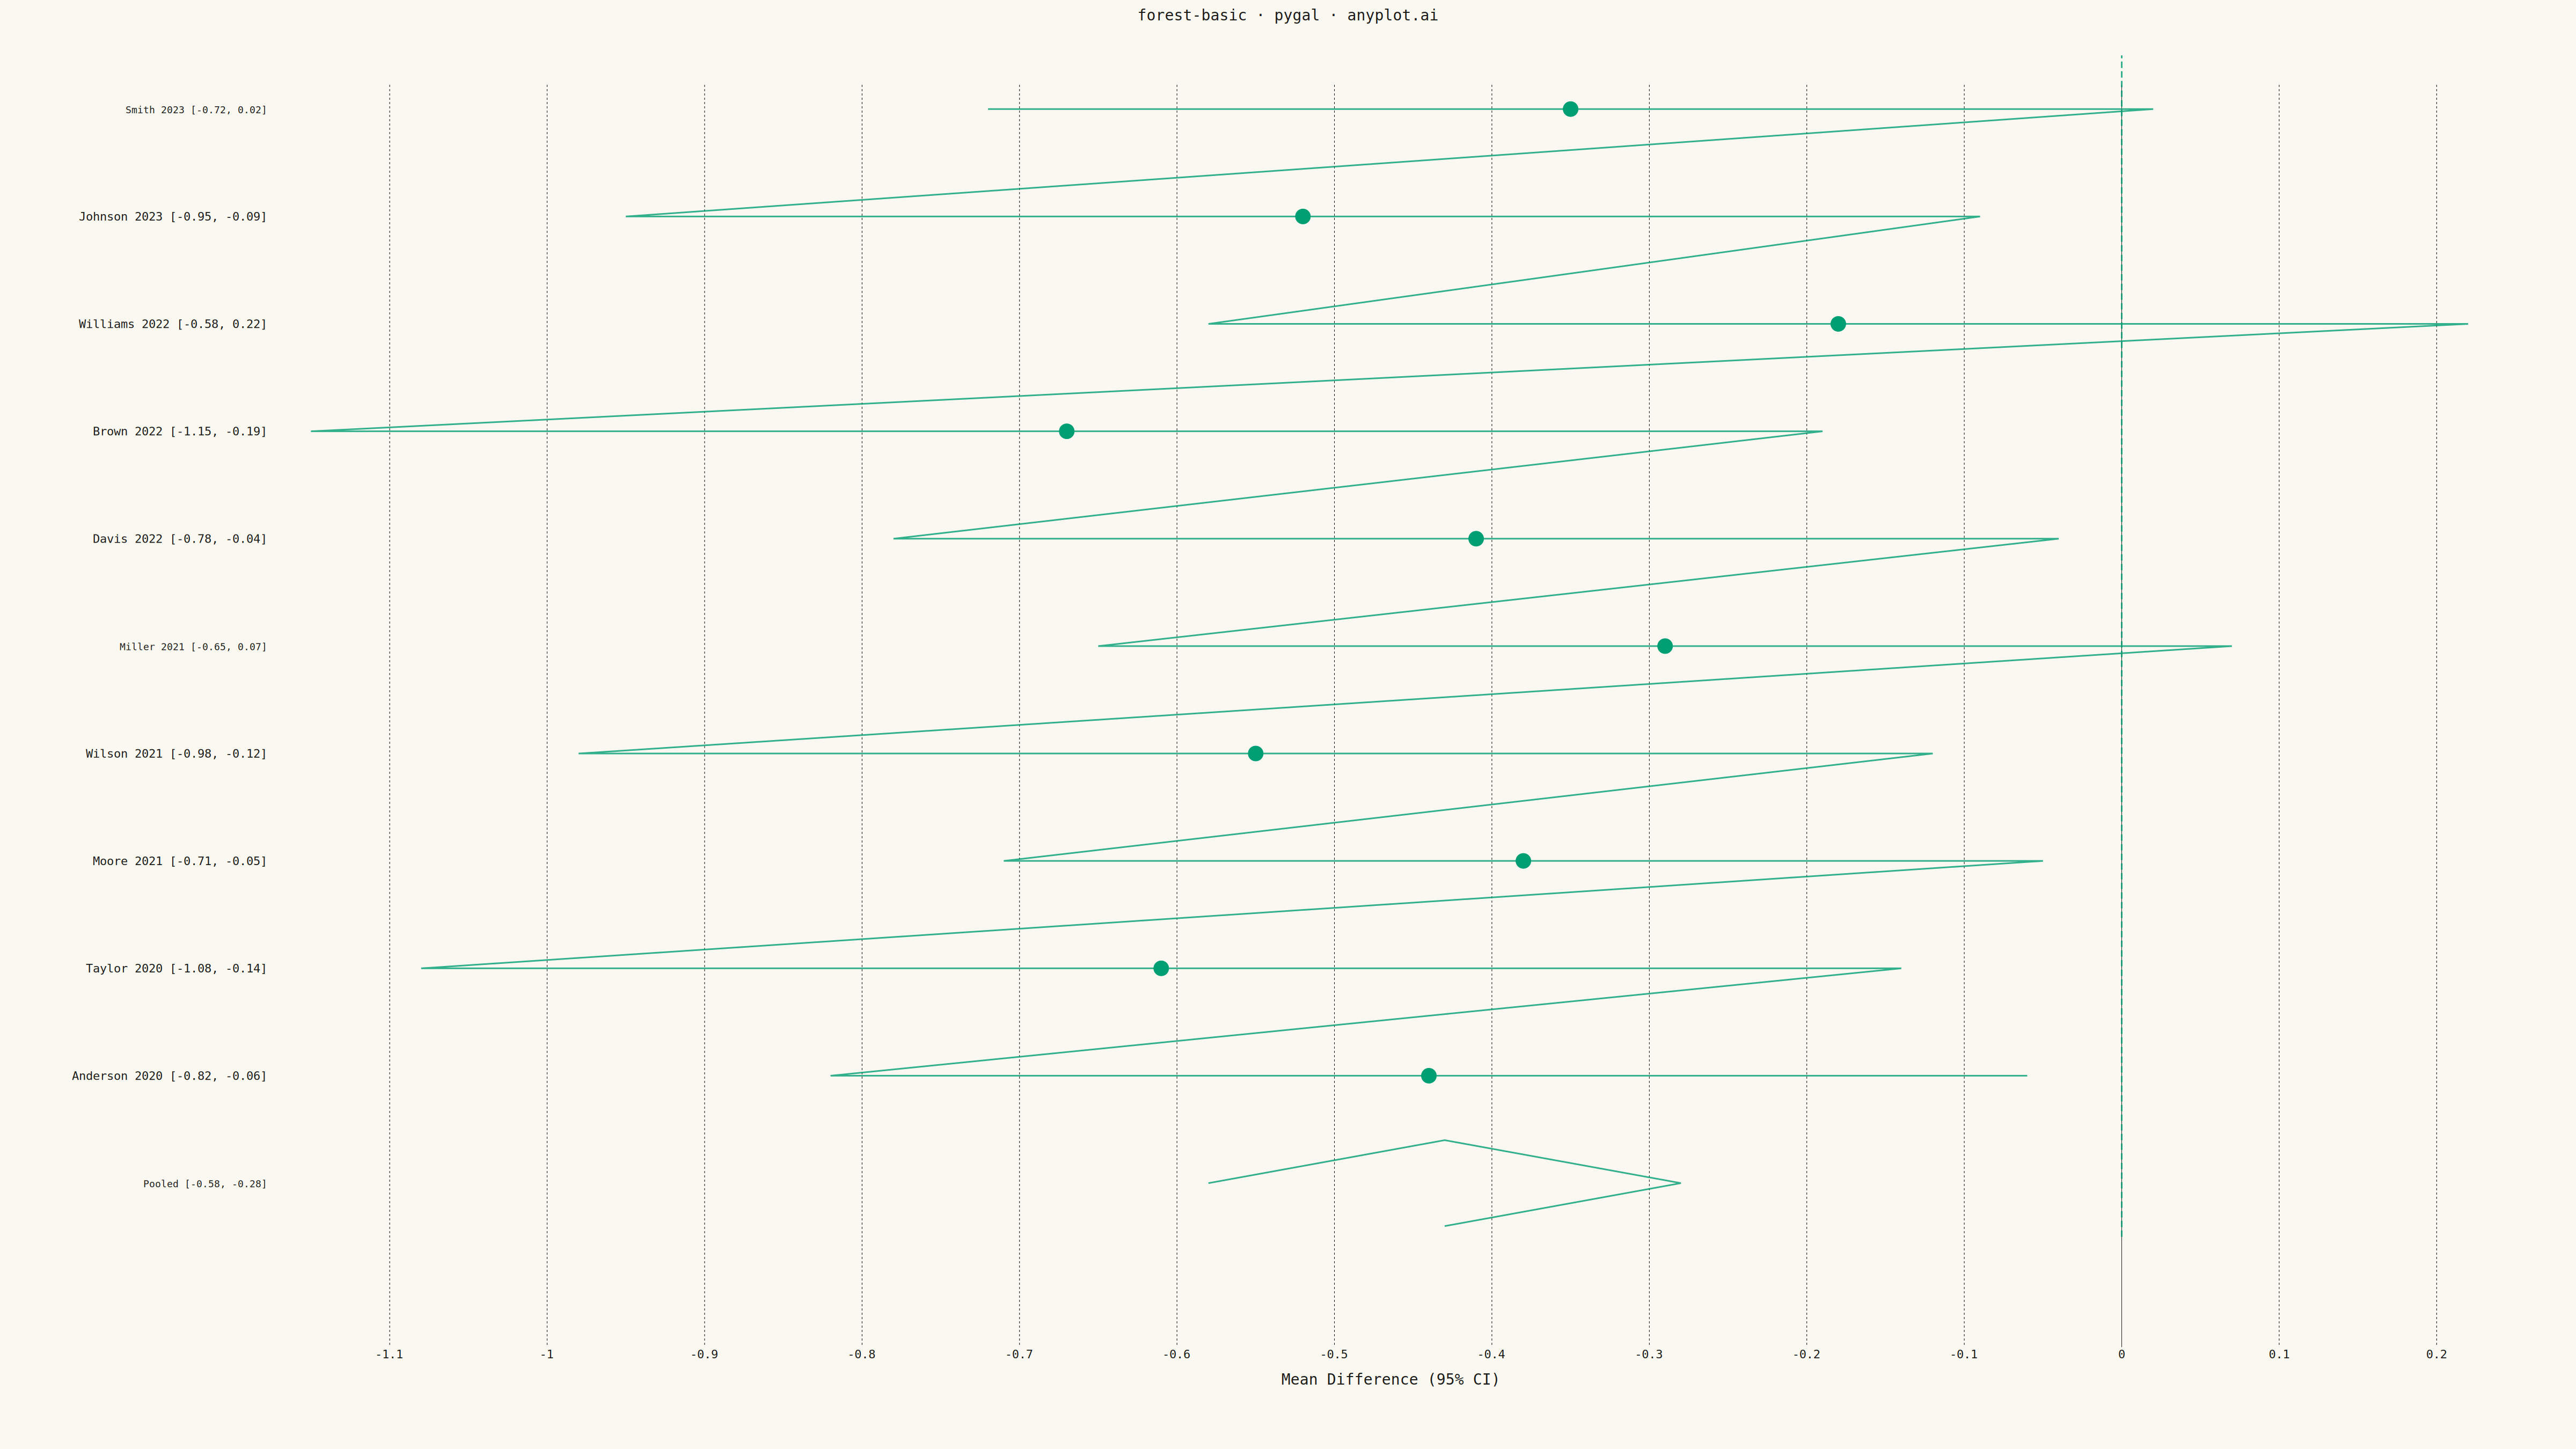
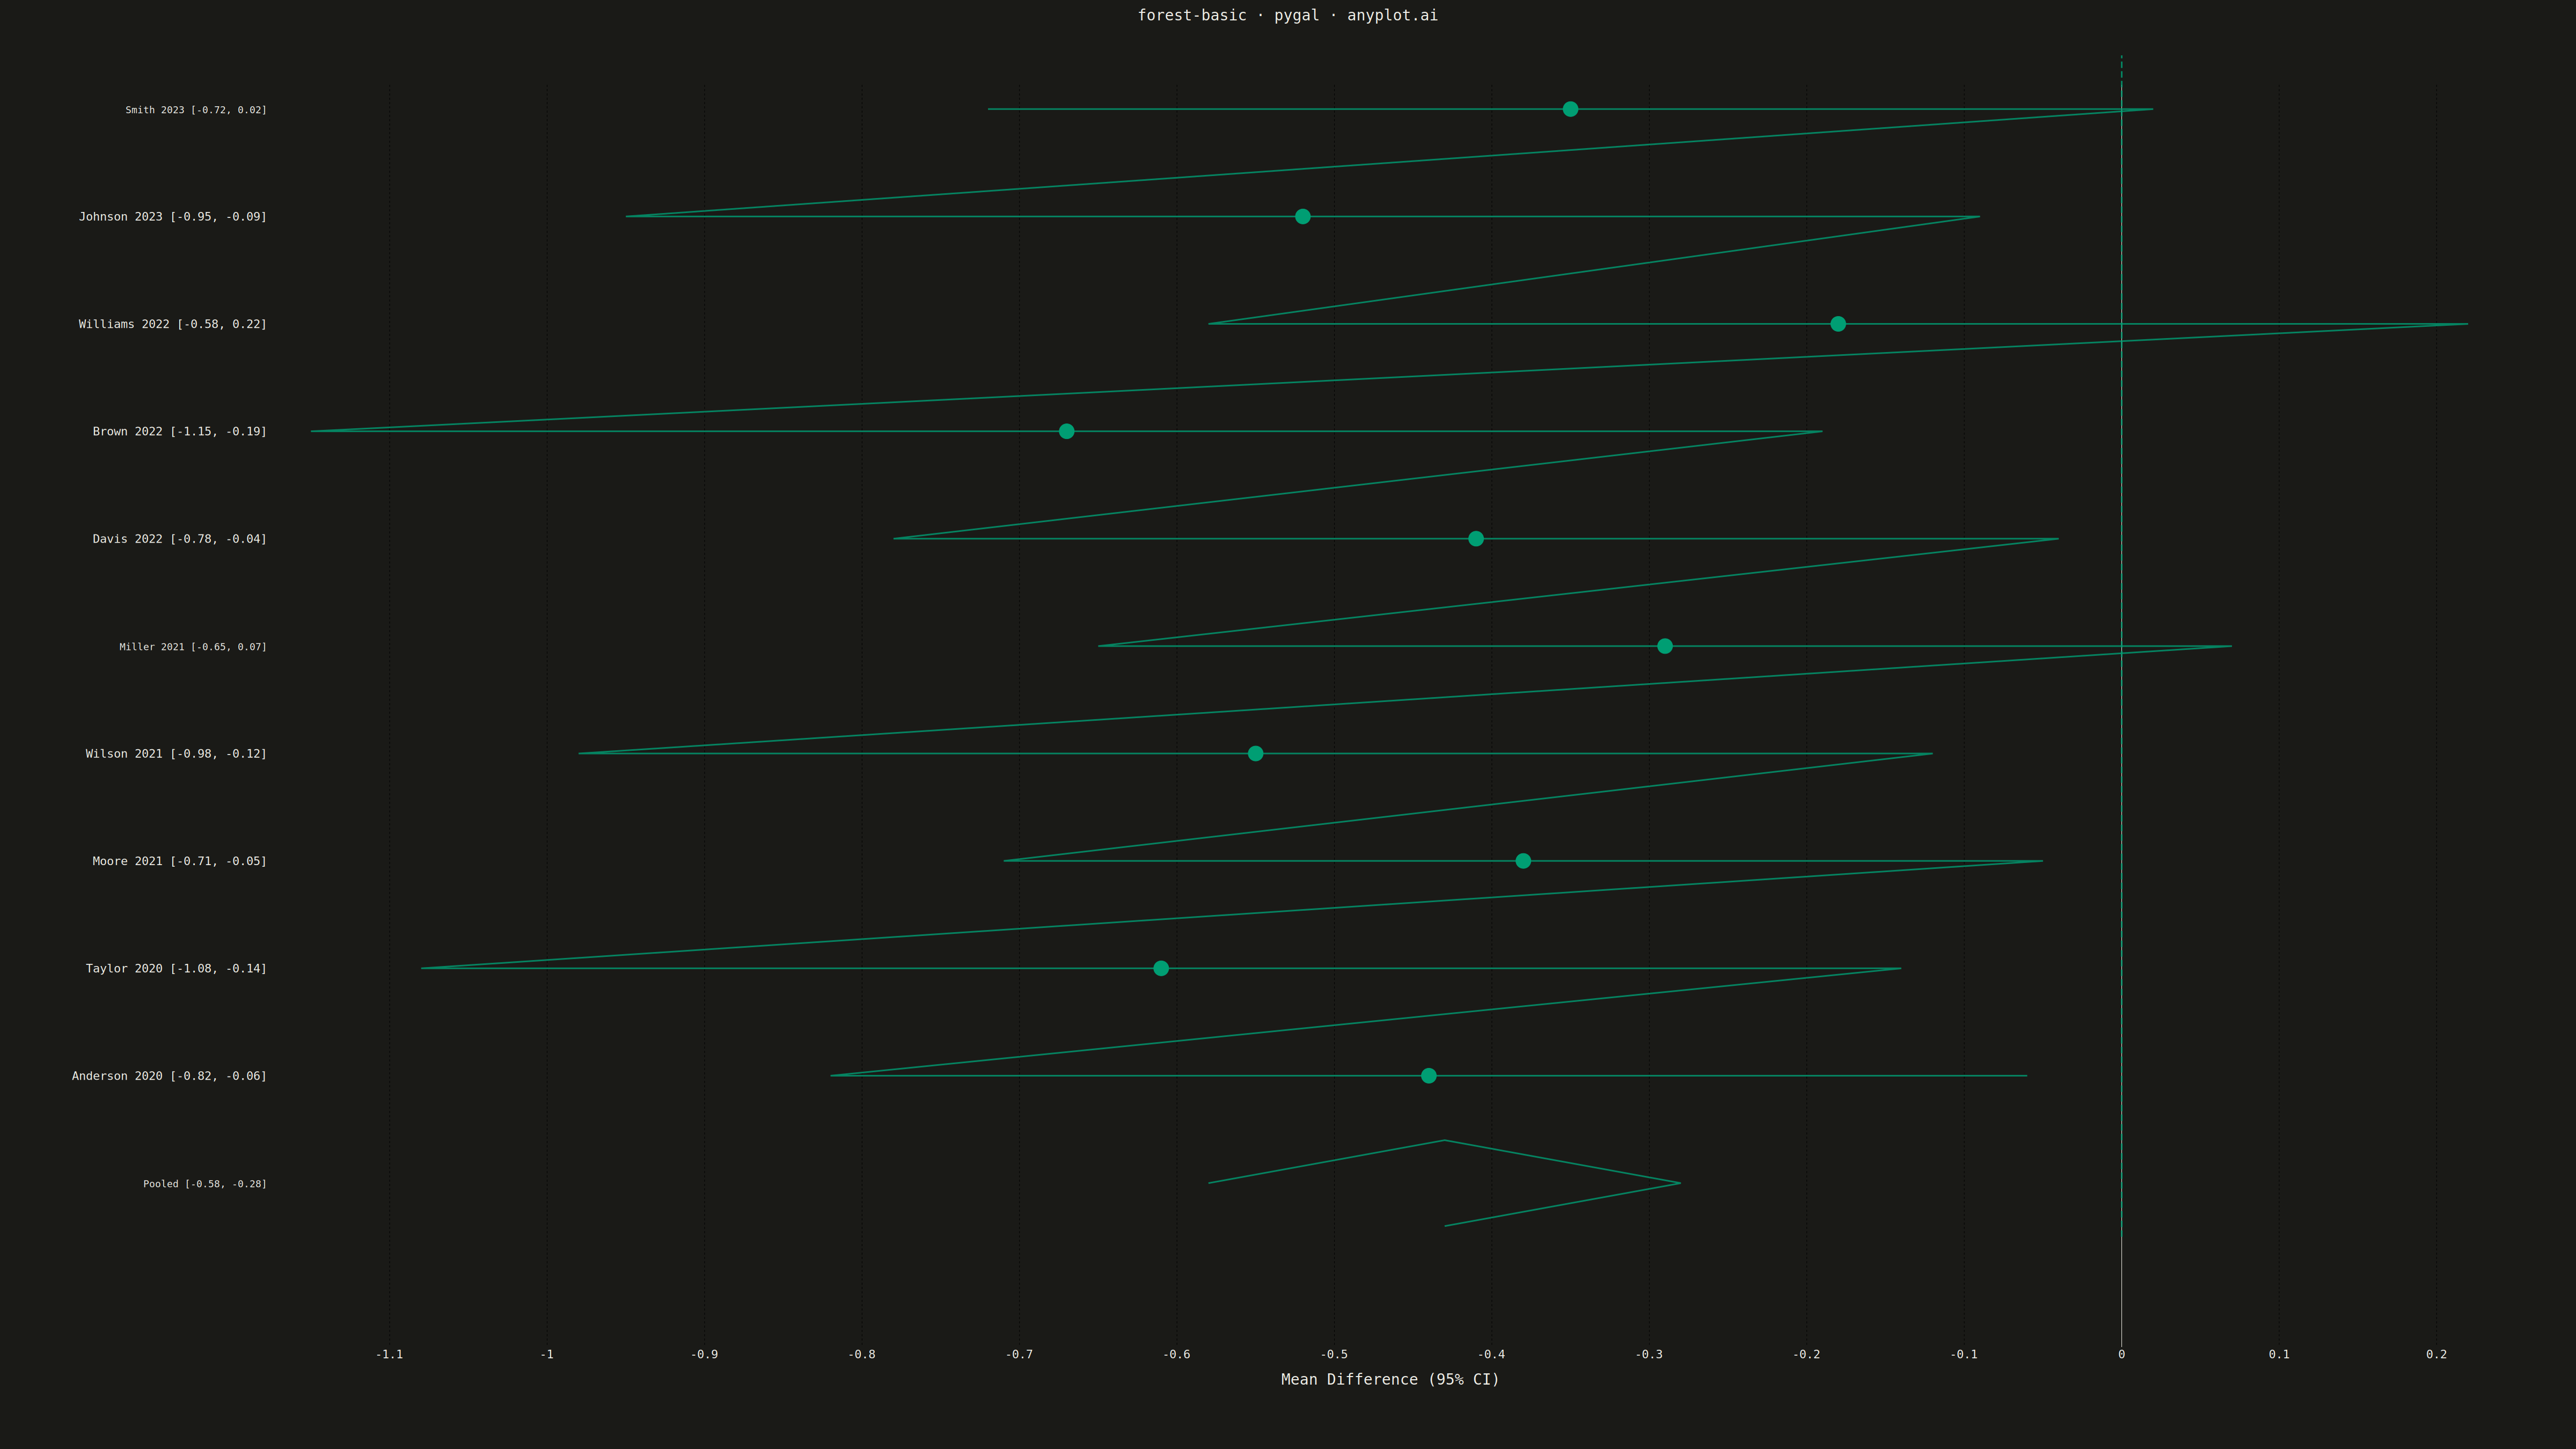
A forest plot displays effect sizes with confidence intervals from multiple studies in a meta-analysis. Each study is represented as a point estimate with horizontal whiskers showing the confidence interval, and a diamond at the bottom shows the pooled estimate. The plot includes a vertical reference line at the null effect (typically 0 or 1), making it easy to assess statistical significance and heterogeneity across studies.
""" anyplot.ai
forest-basic: Meta-Analysis Forest Plot
Library: pygal 3.1.0 | Python 3.13.13
Quality: 92/100 | Updated: 2026-05-11
"""

import os

import pygal
from pygal.style import Style


THEME = os.getenv("ANYPLOT_THEME", "light")
PAGE_BG = "#FAF8F1" if THEME == "light" else "#1A1A17"
INK = "#1A1A17" if THEME == "light" else "#F0EFE8"
INK_MUTED = "#6B6A63" if THEME == "light" else "#A8A79F"
BRAND = "#009E73"

custom_style = Style(
    background=PAGE_BG,
    plot_background=PAGE_BG,
    foreground=INK,
    foreground_strong=INK,
    foreground_subtle=INK_MUTED,
    colors=(BRAND, BRAND, BRAND, BRAND),
    title_font_size=28,
    label_font_size=22,
    major_label_font_size=18,
    legend_font_size=16,
    value_font_size=14,
    stroke_width=3,
)

studies = [
    ("Smith 2023", -0.35, -0.72, 0.02, 10.1),
    ("Johnson 2023", -0.52, -0.95, -0.09, 12.5),
    ("Williams 2022", -0.18, -0.58, 0.22, 9.8),
    ("Brown 2022", -0.67, -1.15, -0.19, 10.3),
    ("Davis 2022", -0.41, -0.78, -0.04, 14.2),
    ("Miller 2021", -0.29, -0.65, 0.07, 11.7),
    ("Wilson 2021", -0.55, -0.98, -0.12, 9.1),
    ("Moore 2021", -0.38, -0.71, -0.05, 13.8),
    ("Taylor 2020", -0.61, -1.08, -0.14, 7.6),
    ("Anderson 2020", -0.44, -0.82, -0.06, 12.8),
]

pooled_effect = -0.43
pooled_ci_lower = -0.58
pooled_ci_upper = -0.28

chart = pygal.XY(
    width=4800,
    height=2700,
    title="forest-basic · pygal · anyplot.ai",
    x_title="Mean Difference (95% CI)",
    style=custom_style,
    show_legend=False,
    stroke=False,
    show_y_guides=False,
    show_x_guides=True,
    range=(-1.3, 0.4),
    margin=120,
)

whisker_data = []
for i, (_, _, ci_low, ci_high, _) in enumerate(studies):
    y_pos = len(studies) - i
    whisker_data.append((ci_low, y_pos))
    whisker_data.append((ci_high, y_pos))

chart.add("Studies", whisker_data, stroke=True, show_dots=False, stroke_style={"width": 6})

point_data = [(effect, len(studies) - i) for i, (_, effect, _, _, _) in enumerate(studies)]
chart.add("Effect", point_data, dots_size=14, stroke=False)

chart.add(
    "Null",
    [(0, -0.5), (0, len(studies) + 0.5)],
    stroke=True,
    show_dots=False,
    stroke_style={"width": 3, "dasharray": "12, 6"},
)

diamond_half_height = 0.4
diamond_edges = [
    (pooled_ci_lower, 0),
    (pooled_effect, diamond_half_height),
    (pooled_ci_upper, 0),
    (pooled_effect, -diamond_half_height),
]
chart.add("Pooled", diamond_edges, stroke=True, show_dots=False, stroke_style={"width": 4})

y_labels = []
for i, (study, _, ci_low, ci_high, _) in enumerate(studies):
    y_labels.append({"value": len(studies) - i, "label": f"{study} [{ci_low:.2f}, {ci_high:.2f}]"})
y_labels.append({"value": 0, "label": f"Pooled [{pooled_ci_lower:.2f}, {pooled_ci_upper:.2f}]"})
chart.y_labels = y_labels

chart.render_to_png(f"plot-{THEME}.png")
with open(f"plot-{THEME}.html", "wb") as f:
    f.write(chart.render())
Runnable source as JSON, for any HTTP client: https://api.anyplot.ai/specs/forest-basic/pygal/code. Any spec id and library id listed in llms-full.txt fit the same URL shape; every URL below is complete and callable.
{
  "spec_id": "forest-basic",
  "language": "python",
  "library": "pygal",
  "page": "https://anyplot.ai/forest-basic/python/pygal",
  "hub": "https://anyplot.ai/forest-basic",
  "code_json": "https://api.anyplot.ai/specs/forest-basic/pygal/code",
  "spec_json": "https://api.anyplot.ai/specs/forest-basic",
  "render_light_png": "https://storage.googleapis.com/anyplot-images/plots/forest-basic/python/pygal/plot-light.png",
  "render_dark_png": "https://storage.googleapis.com/anyplot-images/plots/forest-basic/python/pygal/plot-dark.png",
  "interactive_light_html": "https://storage.googleapis.com/anyplot-images/plots/forest-basic/python/pygal/plot-light.html",
  "interactive_dark_html": "https://storage.googleapis.com/anyplot-images/plots/forest-basic/python/pygal/plot-dark.html",
  "quality_score": 92.0,
  "license": "MIT",
  "guide": "https://anyplot.ai/llms.txt"
}
Part of Meta-Analysis Forest Plot on anyplot.ai.