The same plot in 14 other libraries — JavaScript: Chart.js, Apache ECharts, Highcharts, MUI X Charts; Python: Altair, Bokeh, lets-plot, Matplotlib, Plotly, plotnine, Pygal, Seaborn; R: ggplot2; Julia: Makie.jl. Compare all 15 side by side: Meta-Analysis Forest Plot in Python, R, Julia and JavaScript.
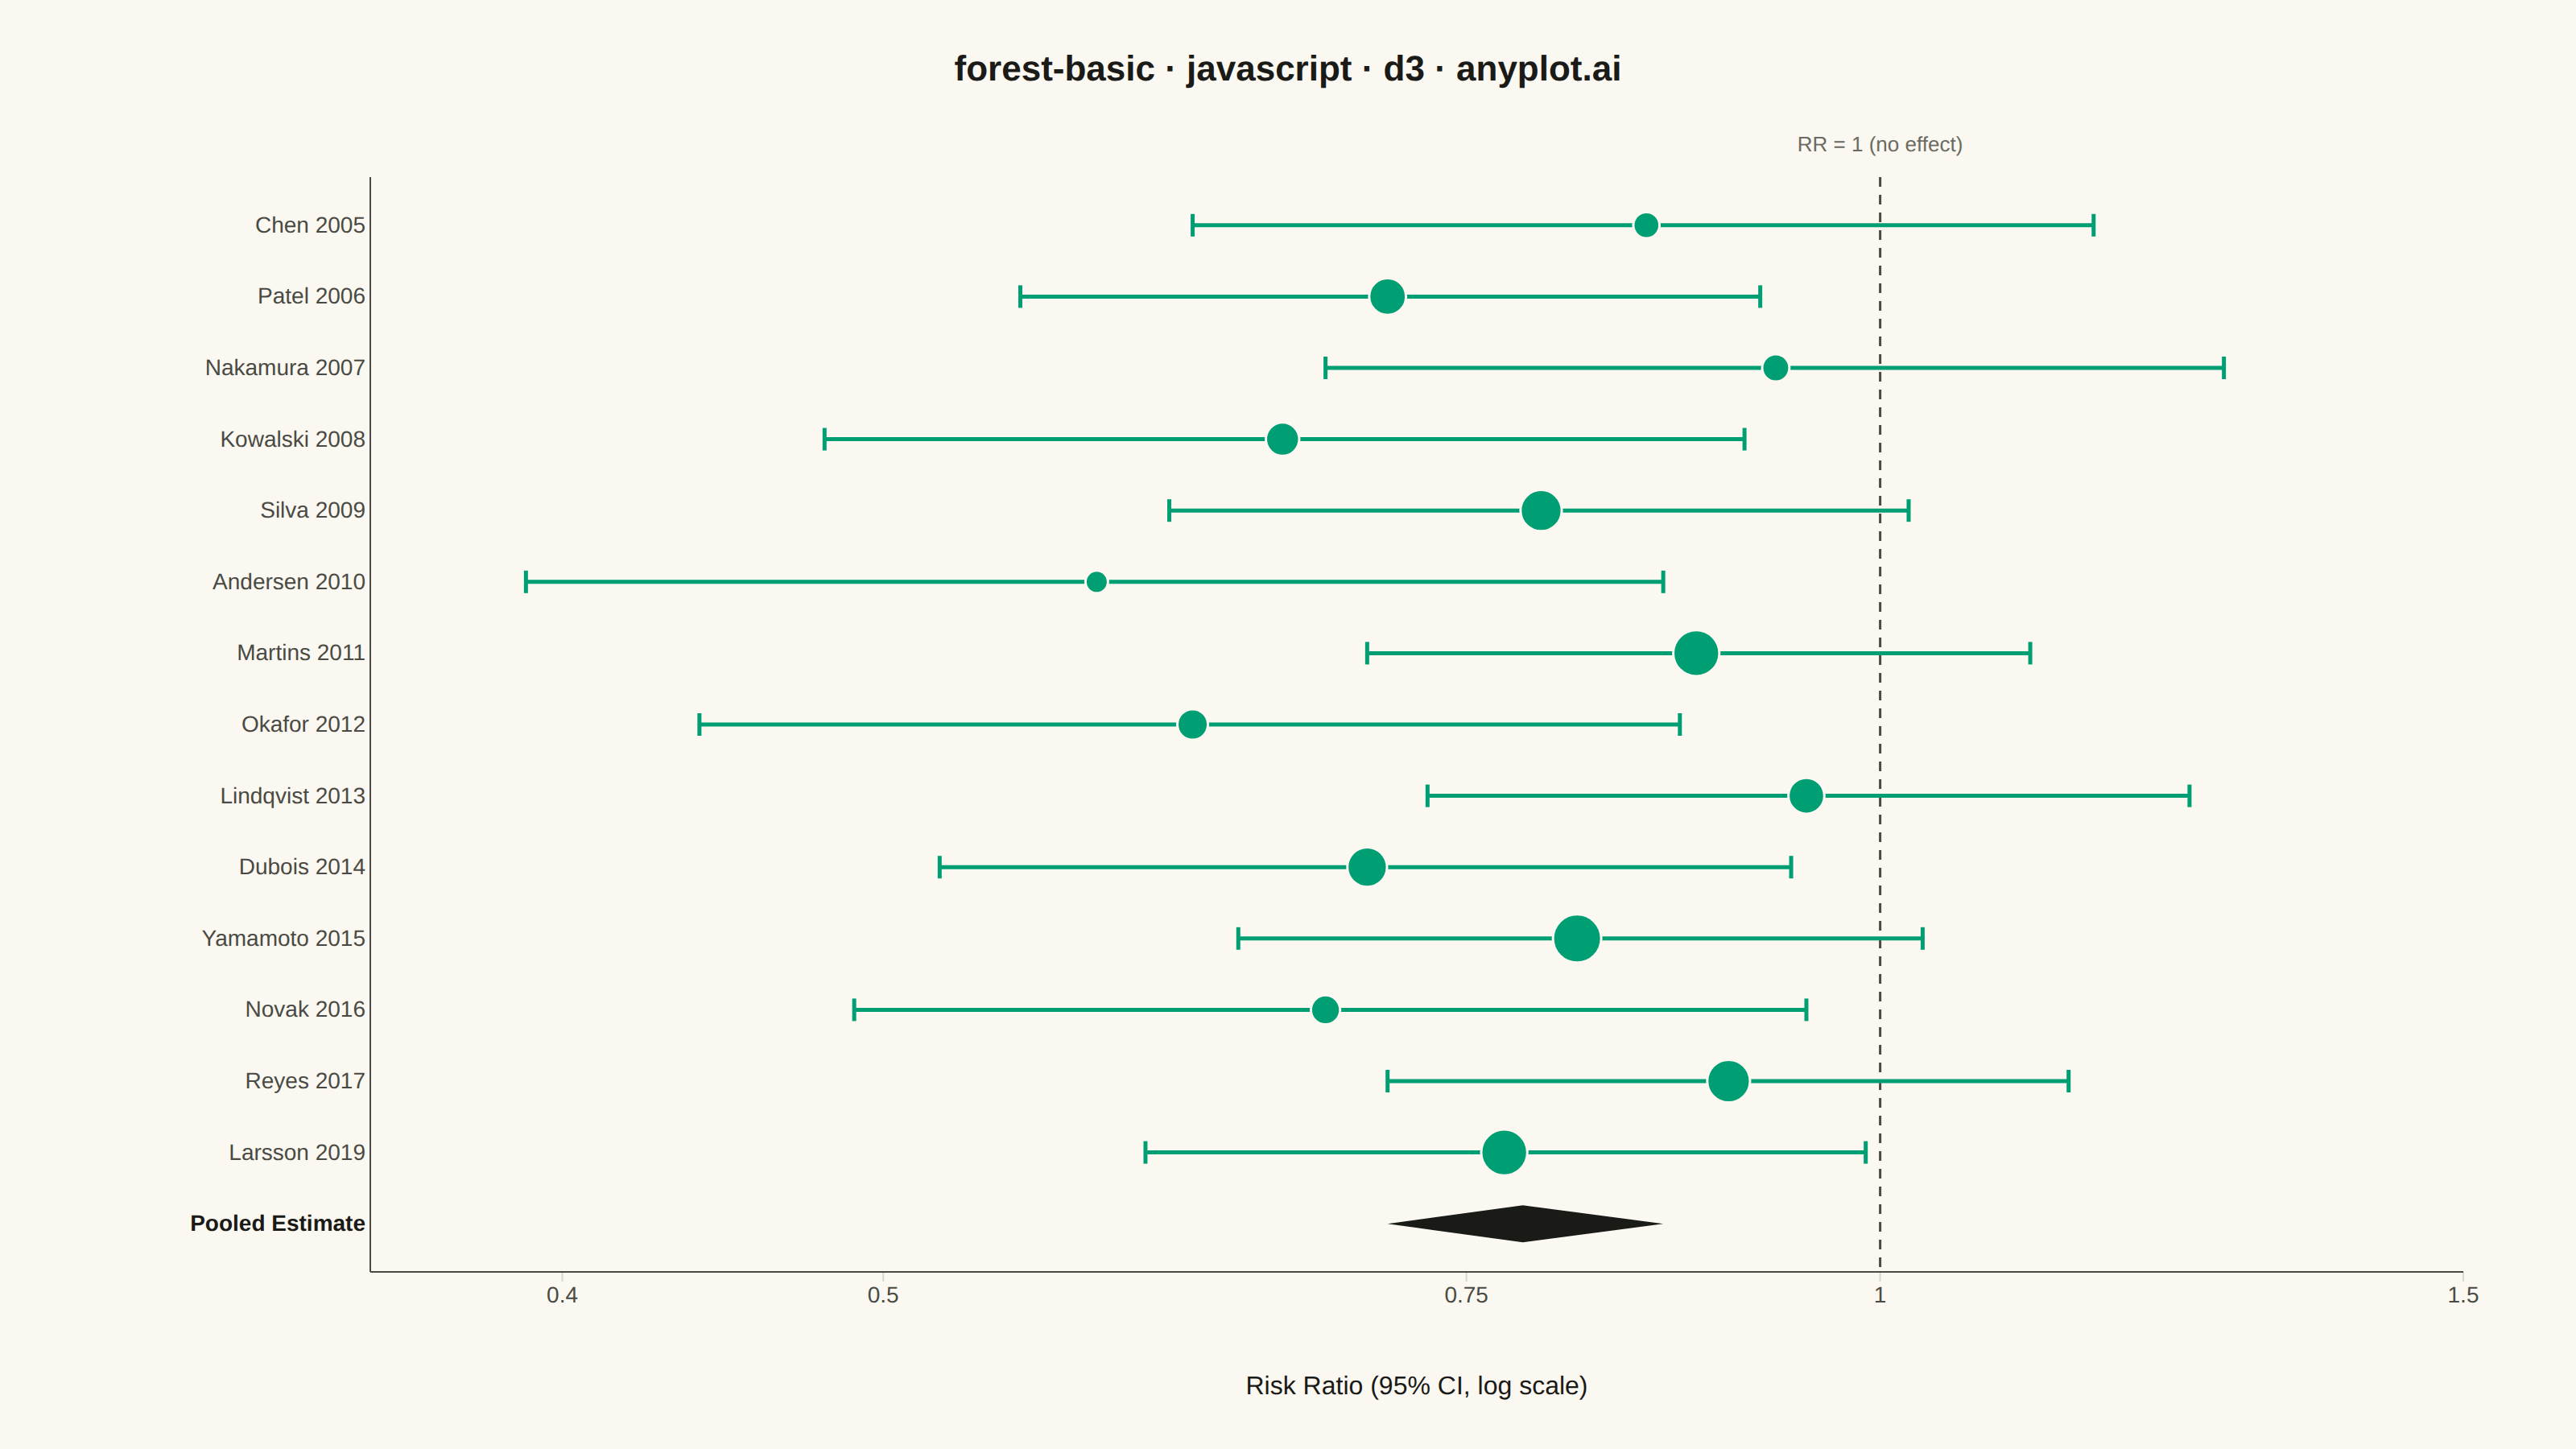
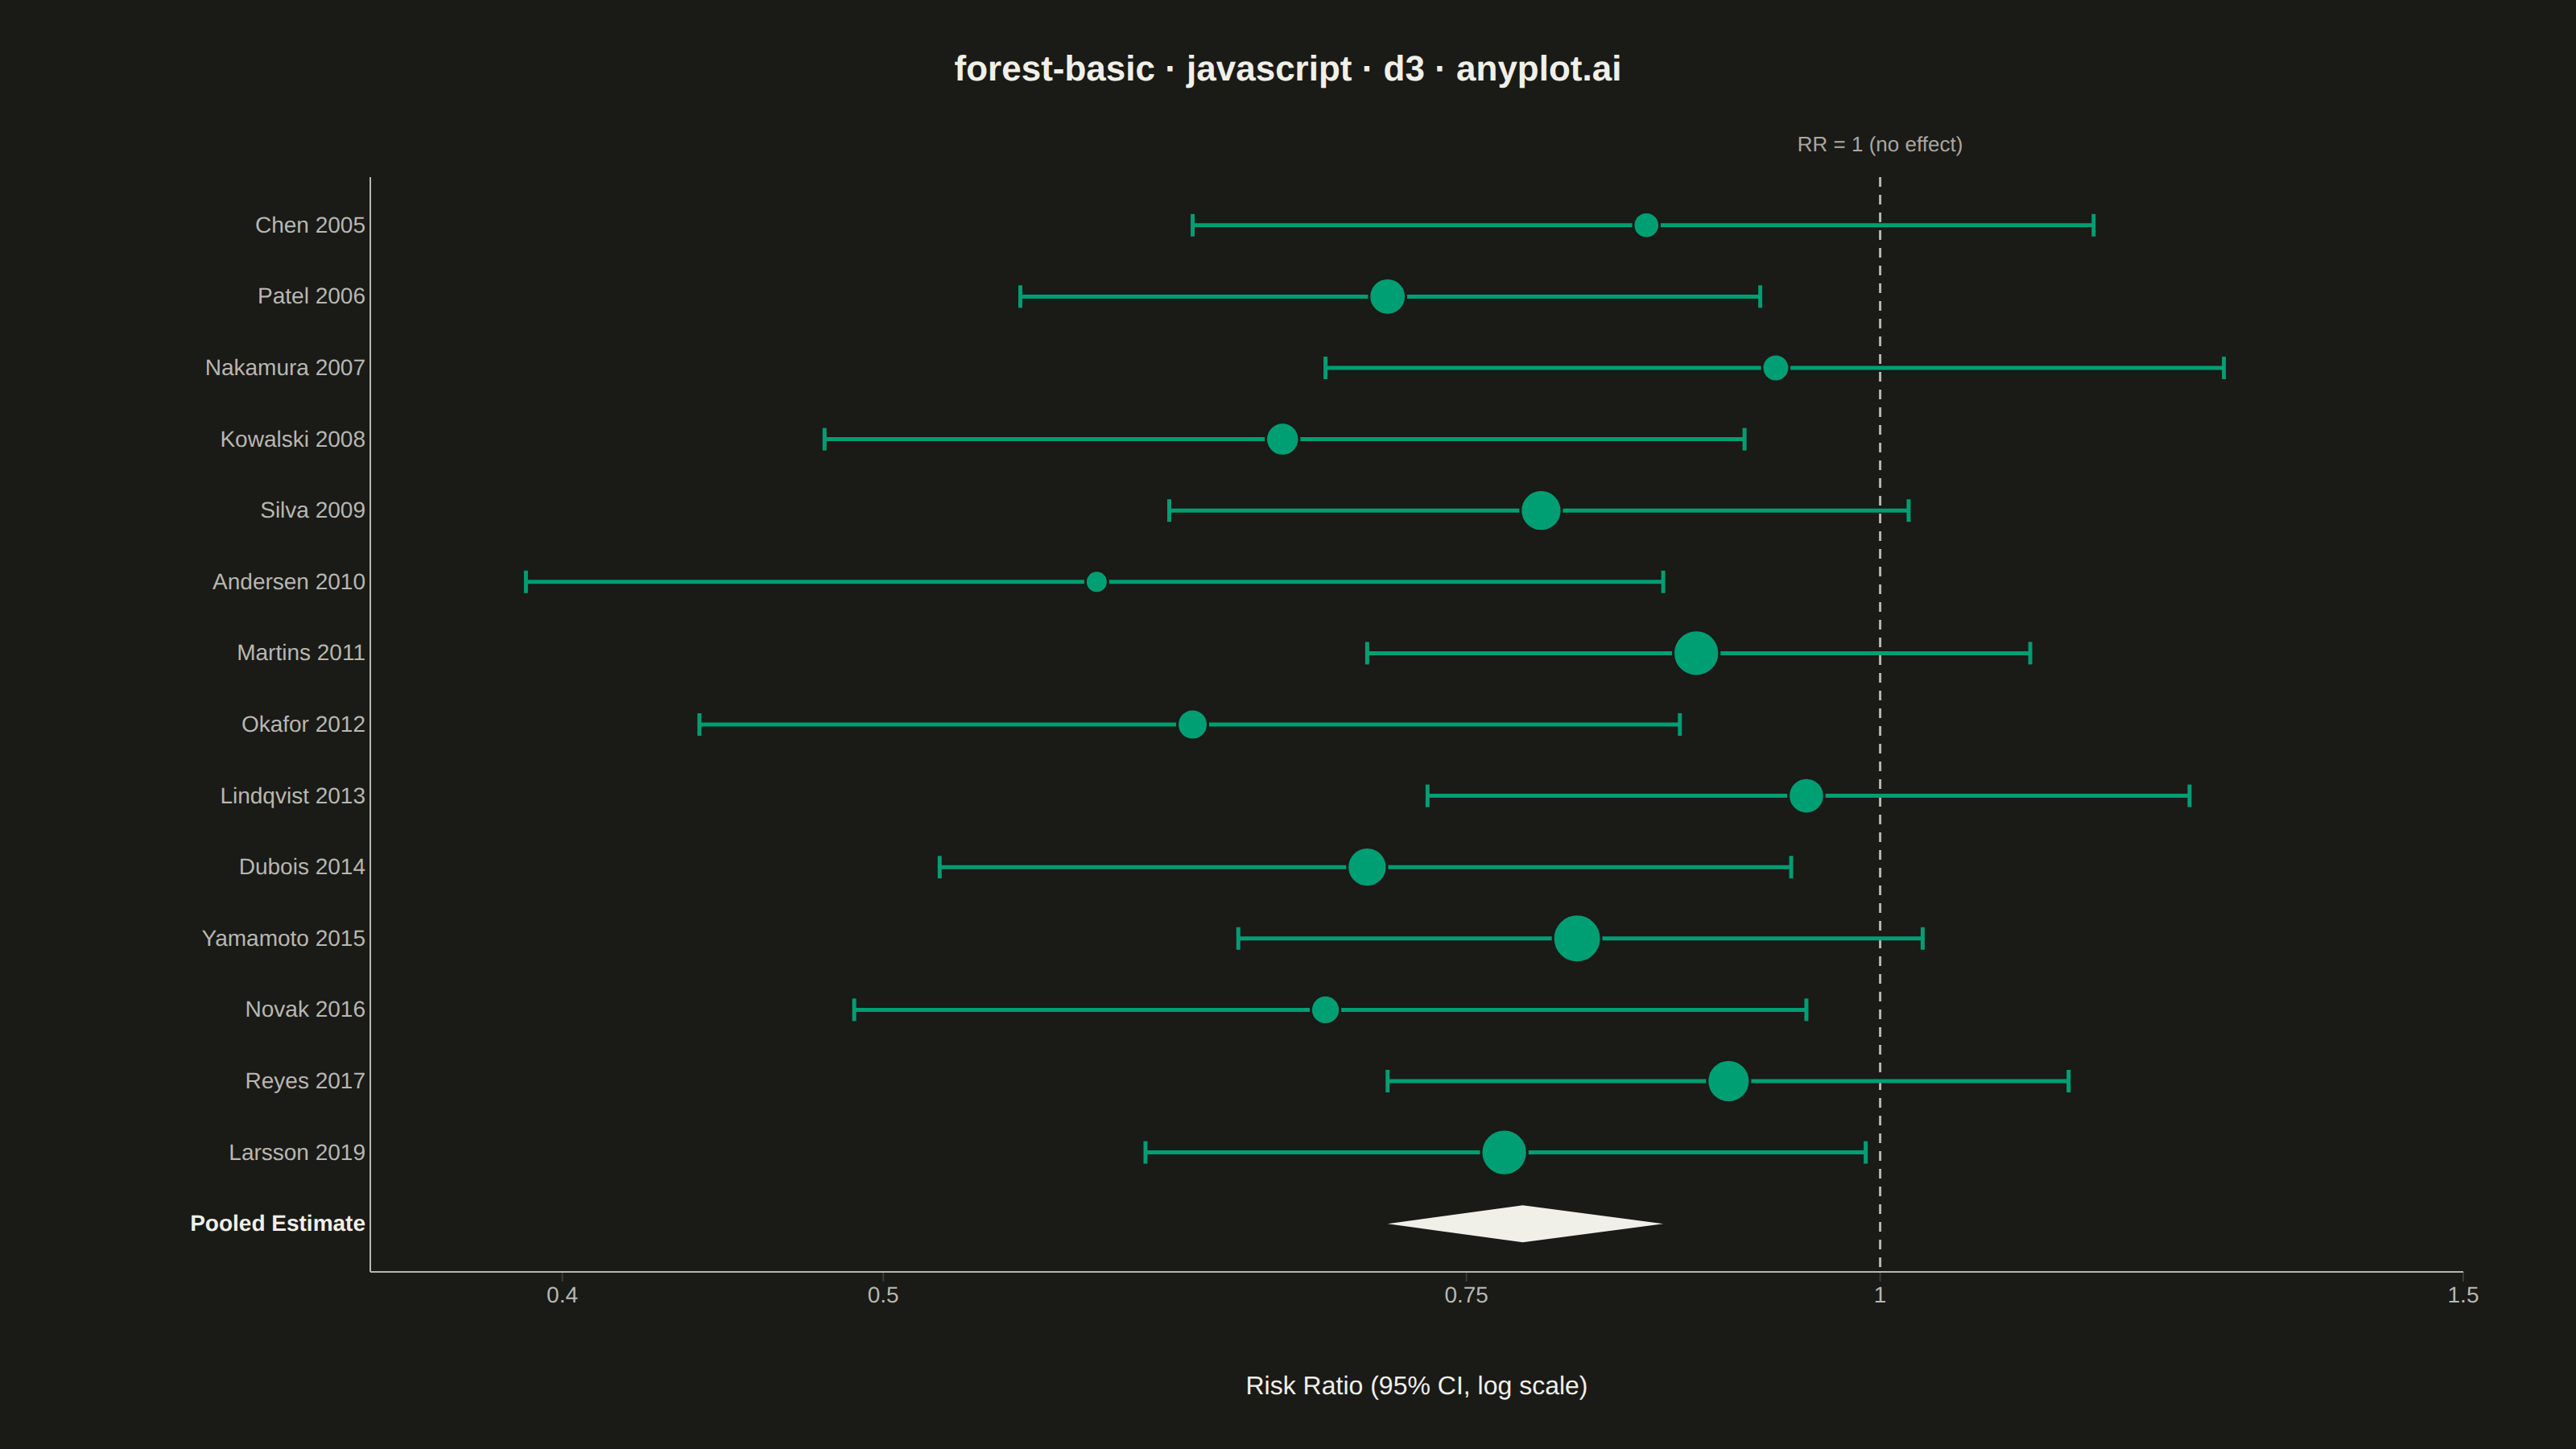
A forest plot displays effect sizes with confidence intervals from multiple studies in a meta-analysis. Each study is represented as a point estimate with horizontal whiskers showing the confidence interval, and a diamond at the bottom shows the pooled estimate. The plot includes a vertical reference line at the null effect (typically 0 or 1), making it easy to assess statistical significance and heterogeneity across studies.
// anyplot.ai
// forest-basic: Meta-Analysis Forest Plot
// Library: d3 7.9.0 | JavaScript 22.23.2
// Quality: 92/100 | Created: 2026-09-05

const t = window.ANYPLOT_TOKENS;
const { width, height } = window.ANYPLOT_SIZE;
const theme = window.ANYPLOT_THEME || "light";
const inkMuted = theme === "dark" ? "#A8A79F" : "#6B6A63";

// --- Data (in-memory, deterministic) ----------------------------------------
// Meta-analysis of 14 RCTs: antihypertensive therapy vs. placebo, risk ratio
// for stroke incidence. Ordered chronologically by publication year.
const studies = [
  { study: "Chen 2005", rr: 0.85, lo: 0.62, hi: 1.16, weight: 4.8 },
  { study: "Patel 2006", rr: 0.71, lo: 0.55, hi: 0.92, weight: 7.1 },
  { study: "Nakamura 2007", rr: 0.93, lo: 0.68, hi: 1.27, weight: 5.0 },
  { study: "Kowalski 2008", rr: 0.66, lo: 0.48, hi: 0.91, weight: 6.3 },
  { study: "Silva 2009", rr: 0.79, lo: 0.61, hi: 1.02, weight: 8.2 },
  { study: "Andersen 2010", rr: 0.58, lo: 0.39, hi: 0.86, weight: 4.1 },
  { study: "Martins 2011", rr: 0.88, lo: 0.7, hi: 1.11, weight: 9.5 },
  { study: "Okafor 2012", rr: 0.62, lo: 0.44, hi: 0.87, weight: 5.7 },
  { study: "Lindqvist 2013", rr: 0.95, lo: 0.73, hi: 1.24, weight: 6.9 },
  { study: "Dubois 2014", rr: 0.7, lo: 0.52, hi: 0.94, weight: 7.8 },
  { study: "Yamamoto 2015", rr: 0.81, lo: 0.64, hi: 1.03, weight: 10.1 },
  { study: "Novak 2016", rr: 0.68, lo: 0.49, hi: 0.95, weight: 5.4 },
  { study: "Reyes 2017", rr: 0.9, lo: 0.71, hi: 1.14, weight: 8.6 },
  { study: "Larsson 2019", rr: 0.77, lo: 0.6, hi: 0.99, weight: 9.5 },
];
const pooled = { study: "Pooled Estimate", rr: 0.78, lo: 0.71, hi: 0.86 };
const rows = [...studies.map((d) => d.study), pooled.study];

// --- SVG mount ---------------------------------------------------------------
const margin = { top: 110, right: 70, bottom: 110, left: 230 };
const iw = width - margin.left - margin.right;
const ih = height - margin.top - margin.bottom;

const svg = d3.select("#container").append("svg").attr("width", width).attr("height", height);
const g = svg.append("g").attr("transform", `translate(${margin.left},${margin.top})`);

// --- Scales -------------------------------------------------------------------
const x = d3.scaleLog().domain([0.35, 1.5]).range([0, iw]);
const y = d3.scaleBand().domain(rows).range([0, ih]).padding(0.35);
const r = d3
  .scaleSqrt()
  .domain(d3.extent(studies, (d) => d.weight))
  .range([7, 15]);

// --- Null-effect reference line (RR = 1) --------------------------------------
g.append("line")
  .attr("x1", x(1))
  .attr("x2", x(1))
  .attr("y1", 0)
  .attr("y2", ih)
  .attr("stroke", t.inkSoft)
  .attr("stroke-width", 1.5)
  .attr("stroke-dasharray", "6,5");

g.append("text")
  .attr("x", x(1))
  .attr("y", -16)
  .attr("text-anchor", "middle")
  .attr("fill", inkMuted)
  .style("font-size", "13px")
  .text("RR = 1 (no effect)");

// --- Per-study whiskers + point estimates -------------------------------------
const capH = 7;
for (const d of studies) {
  const yc = y(d.study) + y.bandwidth() / 2;

  g.append("line")
    .attr("x1", x(d.lo))
    .attr("x2", x(d.hi))
    .attr("y1", yc)
    .attr("y2", yc)
    .attr("stroke", t.palette[0])
    .attr("stroke-width", 2.5);

  for (const xv of [d.lo, d.hi]) {
    g.append("line")
      .attr("x1", x(xv))
      .attr("x2", x(xv))
      .attr("y1", yc - capH)
      .attr("y2", yc + capH)
      .attr("stroke", t.palette[0])
      .attr("stroke-width", 2.5);
  }

  g.append("circle")
    .attr("cx", x(d.rr))
    .attr("cy", yc)
    .attr("r", r(d.weight))
    .attr("fill", t.palette[0])
    .attr("stroke", t.pageBg)
    .attr("stroke-width", 1.5);
}

// --- Pooled estimate diamond (width spans the CI, height fixed) --------------
const pyc = y(pooled.study) + y.bandwidth() / 2;
const halfH = (y.bandwidth() / 2) * 0.8;
g.append("polygon")
  .attr(
    "points",
    [
      [x(pooled.lo), pyc],
      [x(pooled.rr), pyc - halfH],
      [x(pooled.hi), pyc],
      [x(pooled.rr), pyc + halfH],
    ]
      .map((p) => p.join(","))
      .join(" "),
  )
  .attr("fill", t.ink);

// --- Axes ----------------------------------------------------------------------
const xTicks = [0.4, 0.5, 0.75, 1, 1.5];
const xAxis = g
  .append("g")
  .attr("transform", `translate(0,${ih})`)
  .call(d3.axisBottom(x).tickValues(xTicks).tickFormat(d3.format(".2~f")).tickSizeOuter(0));
xAxis.selectAll("text").attr("fill", t.inkSoft).style("font-size", "14px");
xAxis.selectAll("line").attr("stroke", t.grid);
xAxis.select(".domain").attr("stroke", t.inkSoft);

const yAxis = g.append("g").call(d3.axisLeft(y).tickSize(0));
yAxis
  .selectAll("text")
  .attr("fill", (d) => (d === pooled.study ? t.ink : t.inkSoft))
  .style("font-size", "14px")
  .style("font-weight", (d) => (d === pooled.study ? "600" : "400"));
yAxis.select(".domain").attr("stroke", t.inkSoft);

// --- Axis label -----------------------------------------------------------------
svg
  .append("text")
  .attr("x", margin.left + iw / 2)
  .attr("y", height - 34)
  .attr("text-anchor", "middle")
  .attr("fill", t.ink)
  .style("font-size", "16px")
  .text("Risk Ratio (95% CI, log scale)");

// --- Title -----------------------------------------------------------------------
svg
  .append("text")
  .attr("x", width / 2)
  .attr("y", 50)
  .attr("text-anchor", "middle")
  .attr("fill", t.ink)
  .style("font-size", "22px")
  .style("font-weight", "600")
  .text("forest-basic · javascript · d3 · anyplot.ai");
Runnable source as JSON, for any HTTP client: https://api.anyplot.ai/specs/forest-basic/d3/code. Any spec id and library id listed in llms-full.txt fit the same URL shape; every URL below is complete and callable.
{
  "spec_id": "forest-basic",
  "language": "javascript",
  "library": "d3",
  "page": "https://anyplot.ai/forest-basic/javascript/d3",
  "hub": "https://anyplot.ai/forest-basic",
  "code_json": "https://api.anyplot.ai/specs/forest-basic/d3/code",
  "spec_json": "https://api.anyplot.ai/specs/forest-basic",
  "render_light_png": "https://storage.googleapis.com/anyplot-images/plots/forest-basic/javascript/d3/plot-light.png",
  "render_dark_png": "https://storage.googleapis.com/anyplot-images/plots/forest-basic/javascript/d3/plot-dark.png",
  "interactive_light_html": "https://storage.googleapis.com/anyplot-images/plots/forest-basic/javascript/d3/plot-light.html",
  "interactive_dark_html": "https://storage.googleapis.com/anyplot-images/plots/forest-basic/javascript/d3/plot-dark.html",
  "quality_score": 92.0,
  "license": "MIT",
  "guide": "https://anyplot.ai/llms.txt"
}
Part of Meta-Analysis Forest Plot on anyplot.ai.