The same plot in 14 other libraries — JavaScript: Chart.js, D3.js, Apache ECharts, Highcharts; Python: Altair, Bokeh, lets-plot, Matplotlib, Plotly, plotnine, Pygal, Seaborn; R: ggplot2; Julia: Makie.jl. Compare all 15 side by side: Meta-Analysis Forest Plot in Python, R, Julia and JavaScript.
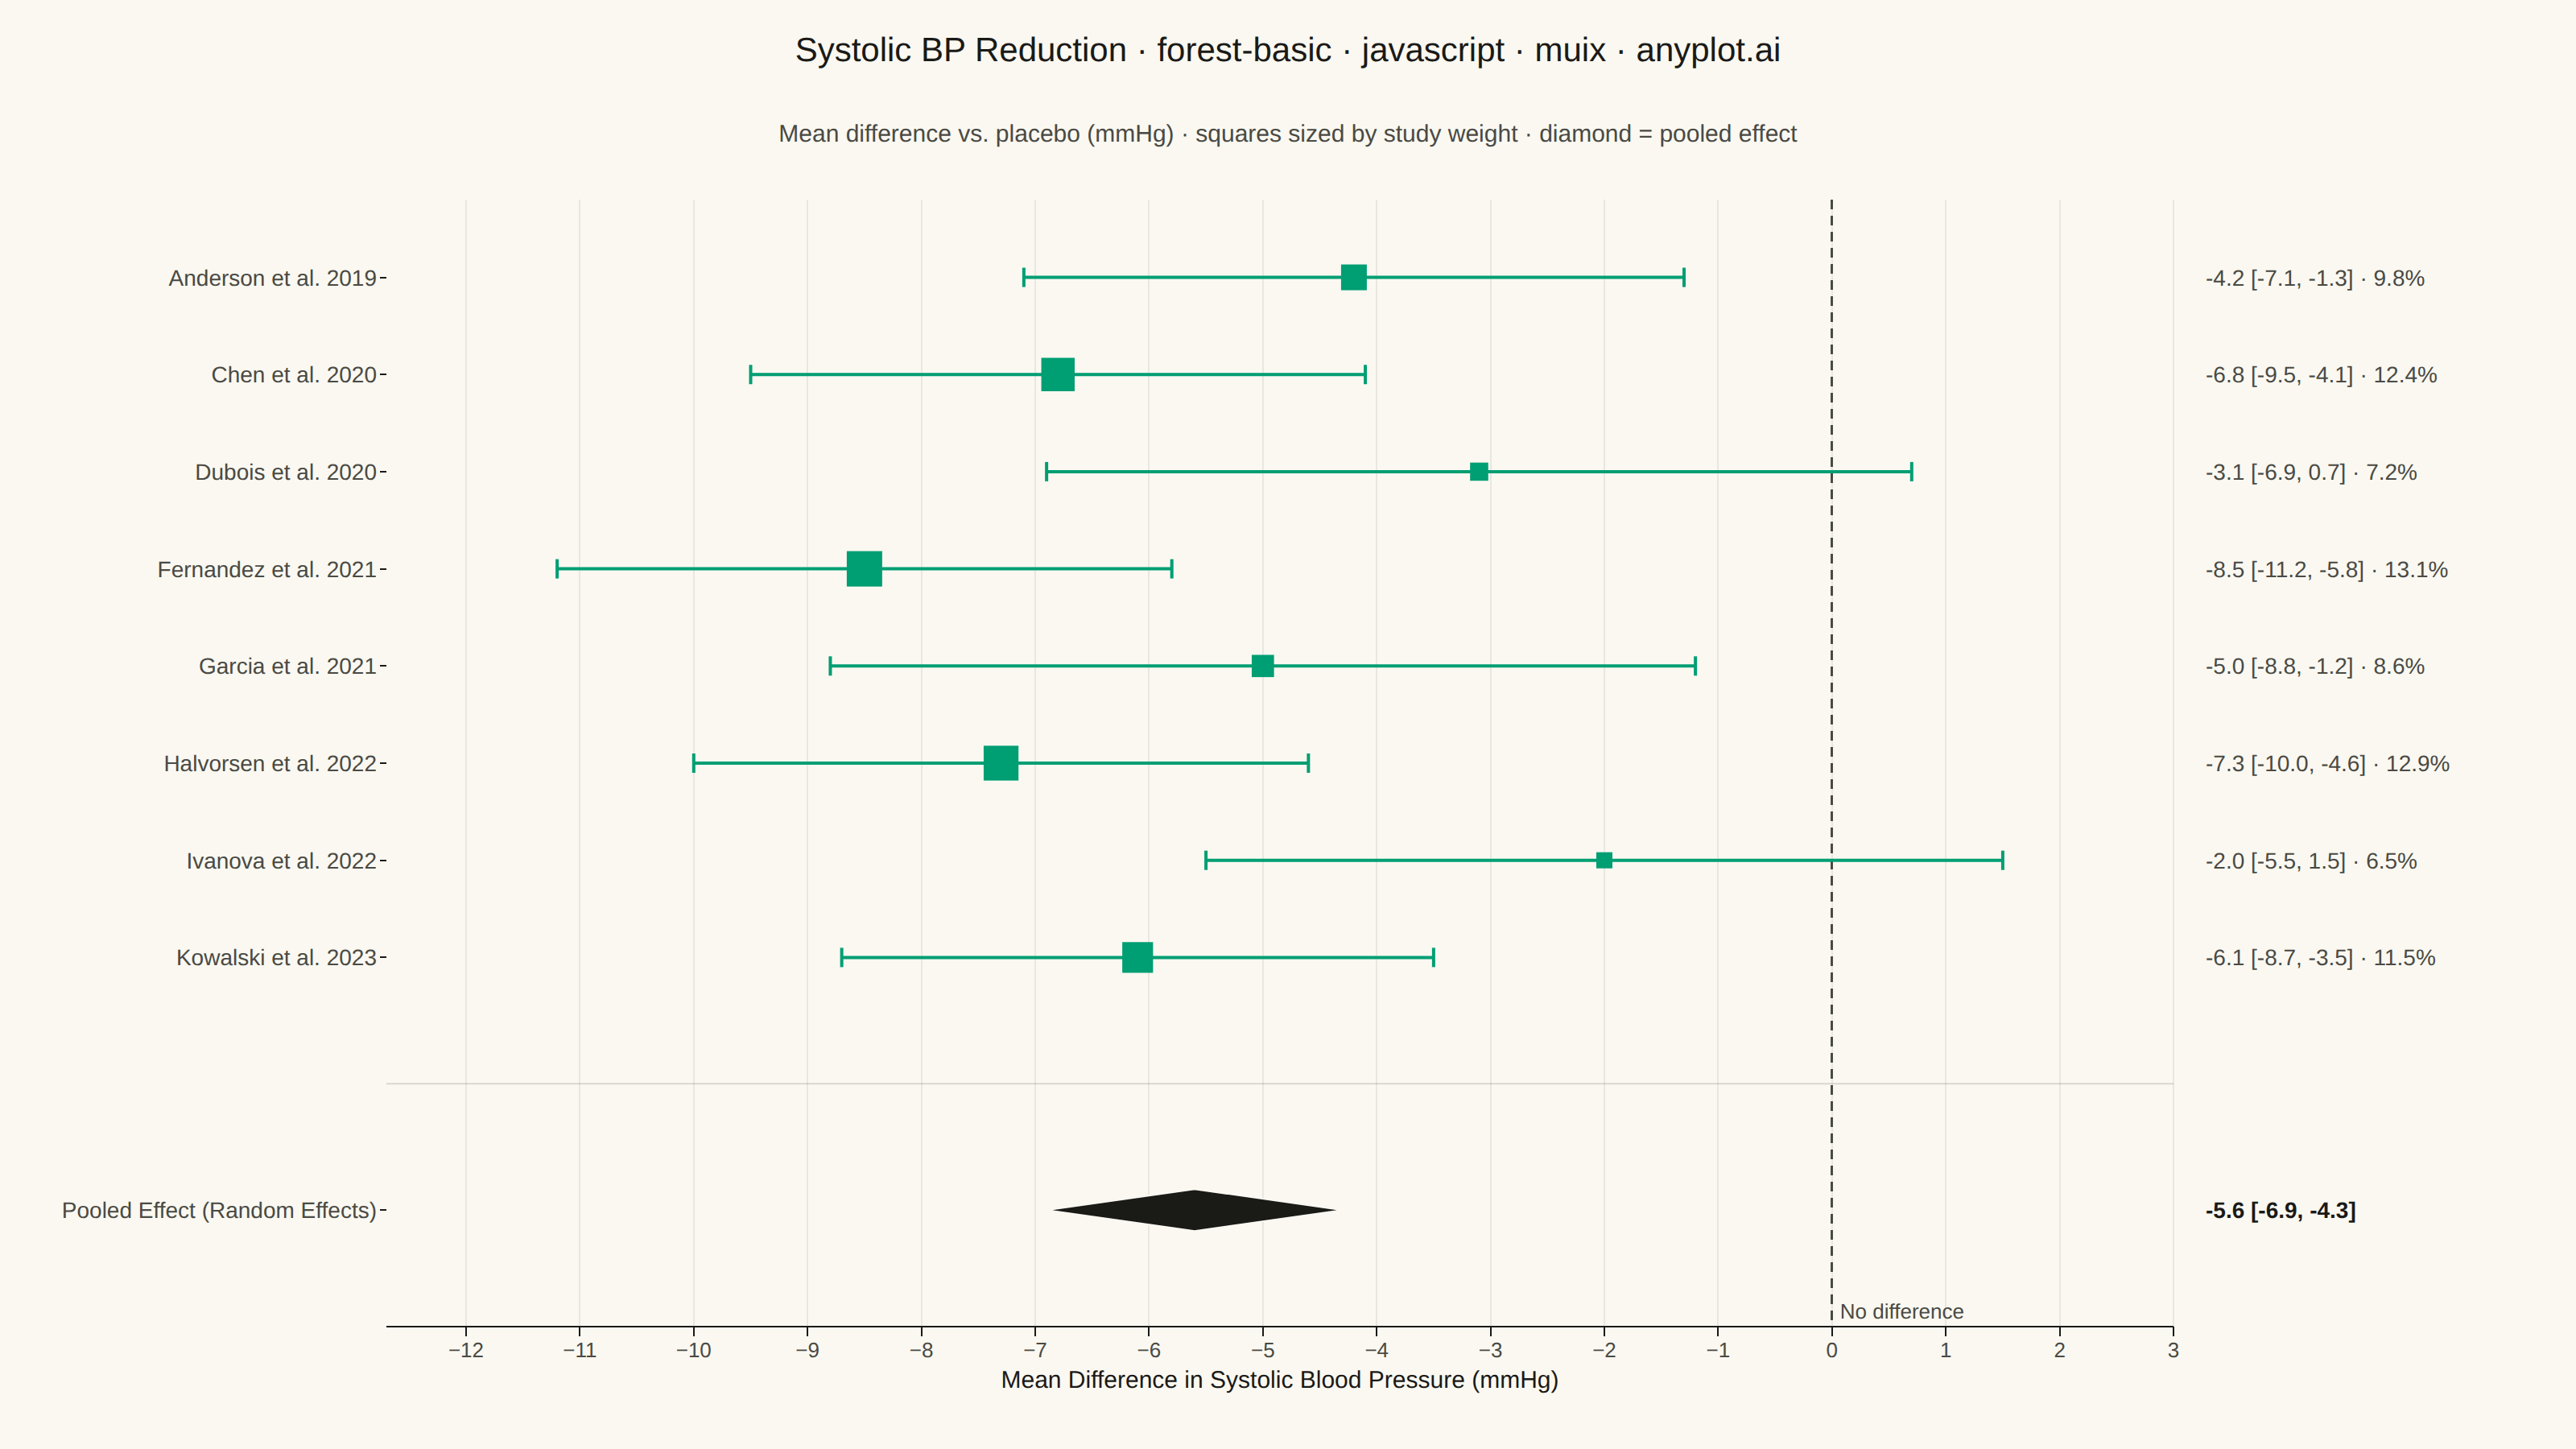
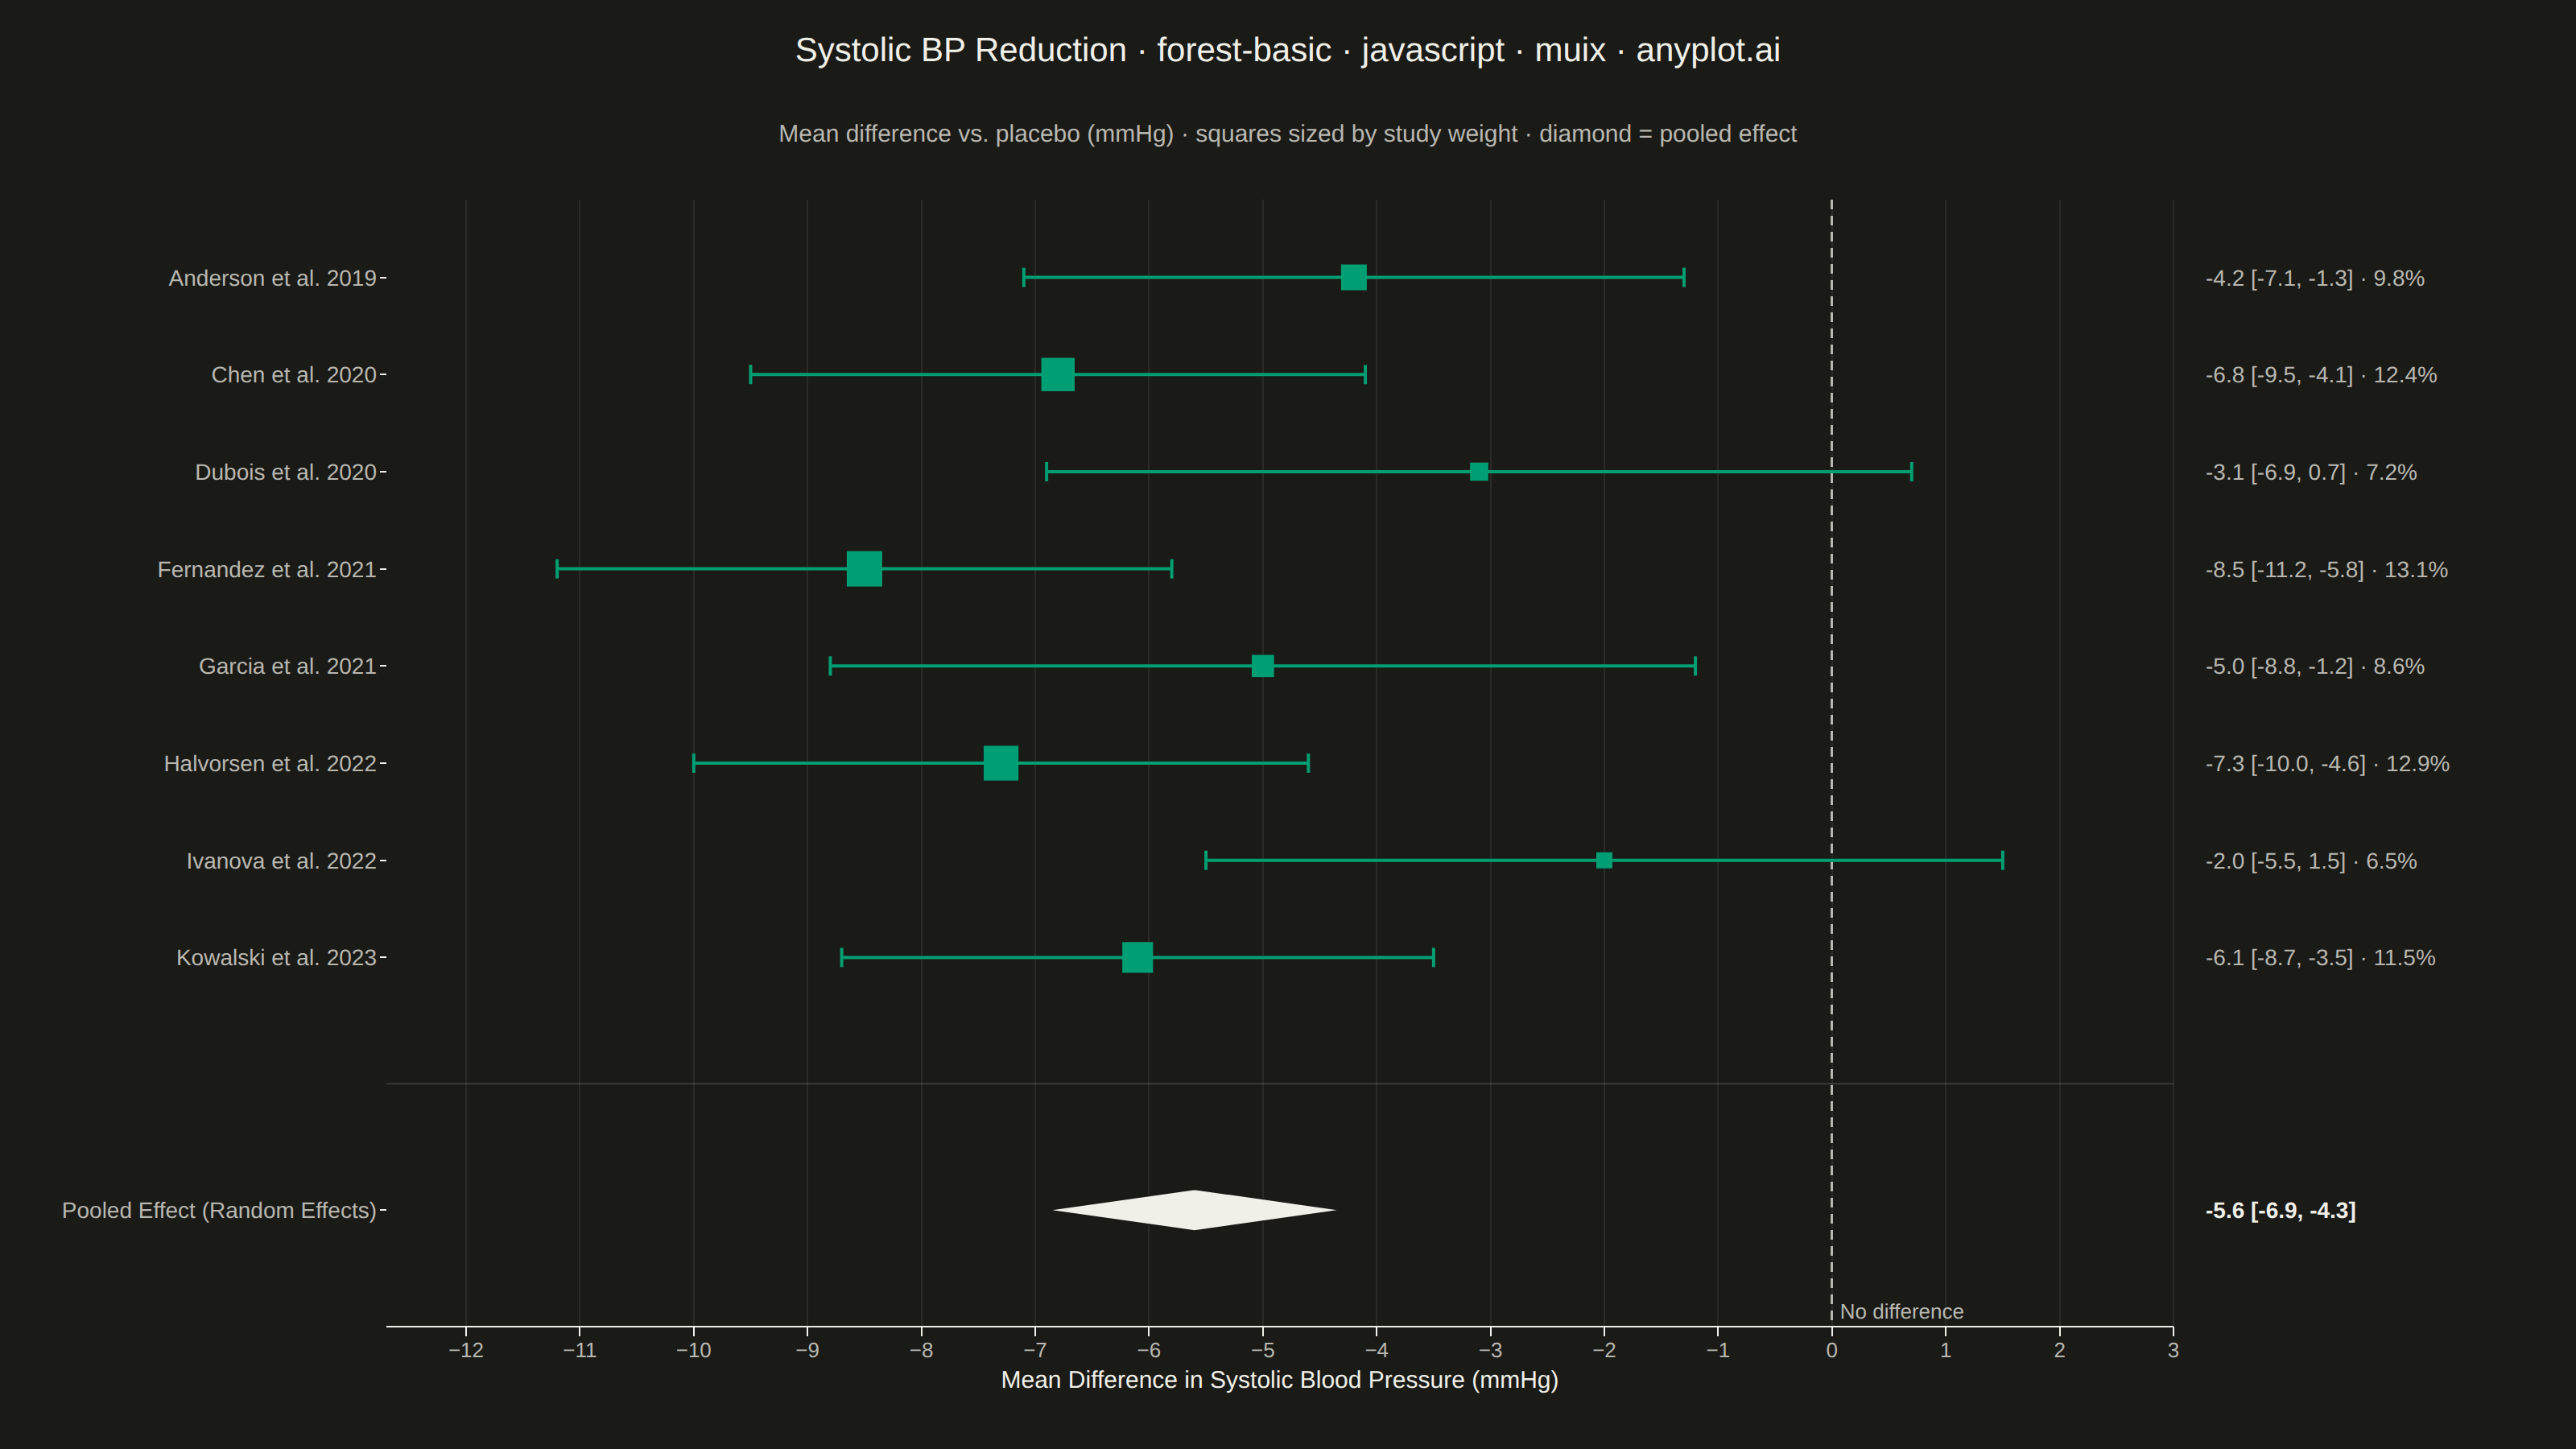
A forest plot displays effect sizes with confidence intervals from multiple studies in a meta-analysis. Each study is represented as a point estimate with horizontal whiskers showing the confidence interval, and a diamond at the bottom shows the pooled estimate. The plot includes a vertical reference line at the null effect (typically 0 or 1), making it easy to assess statistical significance and heterogeneity across studies.
// anyplot.ai
// forest-basic: Meta-Analysis Forest Plot
// Library: muix 7.29.1 | JavaScript 22.23.2
// Quality: 91/100 | Created: 2026-09-05
//# anyplot-orientation: landscape
// anyplot.ai
// forest-basic: Meta-Analysis Forest Plot
// Library: MUI X Charts | React | Node 22
// License: @mui/x-charts — MIT (community). Pro/Premium are out of scope.
// Quality: pending | Created: 2026-09-05

import { ChartContainer } from "@mui/x-charts/ChartContainer";
import { ChartsXAxis } from "@mui/x-charts/ChartsXAxis";
import { ChartsYAxis } from "@mui/x-charts/ChartsYAxis";
import { ChartsGrid } from "@mui/x-charts/ChartsGrid";
import { ChartsReferenceLine } from "@mui/x-charts/ChartsReferenceLine";
import { useXScale, useYScale, useDrawingArea } from "@mui/x-charts/hooks";
import Box from "@mui/material/Box";
import Typography from "@mui/material/Typography";

const t = window.ANYPLOT_TOKENS;

// Meta-analysis of a new antihypertensive drug vs. placebo: mean difference in
// systolic blood pressure (mmHg) across 8 RCTs. Negative = larger SBP
// reduction, favoring the drug. Weight = % contribution (inverse-variance).
const STUDIES = [
  { name: "Anderson et al. 2019",  effect: -4.2, lower: -7.1,  upper: -1.3, weight: 9.8 },
  { name: "Chen et al. 2020",      effect: -6.8, lower: -9.5,  upper: -4.1, weight: 12.4 },
  { name: "Dubois et al. 2020",    effect: -3.1, lower: -6.9,  upper: 0.7,  weight: 7.2 },
  { name: "Fernandez et al. 2021", effect: -8.5, lower: -11.2, upper: -5.8, weight: 13.1 },
  { name: "Garcia et al. 2021",    effect: -5.0, lower: -8.8,  upper: -1.2, weight: 8.6 },
  { name: "Halvorsen et al. 2022", effect: -7.3, lower: -10.0, upper: -4.6, weight: 12.9 },
  { name: "Ivanova et al. 2022",   effect: -2.0, lower: -5.5,  upper: 1.5,  weight: 6.5 },
  { name: "Kowalski et al. 2023",  effect: -6.1, lower: -8.7,  upper: -3.5, weight: 11.5 },
];

// Pooled estimate (random-effects), drawn as a diamond spanning its 95% CI.
const OVERALL = { name: "Pooled Effect (Random Effects)", effect: -5.6, lower: -6.9, upper: -4.3 };

const N = STUDIES.length;
const OVERALL_Y = -1.6;

// Row 0 (top of chart) is the first study; higher y-domain values render
// higher on screen, so row order is reversed against the y position.
const ROWS = STUDIES.map((s, i) => ({ ...s, y: N - i }));

const Y_TICKS = [...ROWS.map((r) => r.y), OVERALL_Y];
const Y_LABELS = new Map(
  Y_TICKS.map((y) => [y, y === OVERALL_Y ? OVERALL.name : ROWS.find((r) => r.y === y).name])
);

const WEIGHTS = STUDIES.map((s) => s.weight);
const MIN_WEIGHT = Math.min(...WEIGHTS);
const MAX_WEIGHT = Math.max(...WEIGHTS);
const markerHalf = (w) => 5 + ((w - MIN_WEIGHT) / (MAX_WEIGHT - MIN_WEIGHT)) * 6; // 5-11 px half-size

const X_MIN = Math.min(...STUDIES.map((s) => s.lower), OVERALL.lower) - 1.5;
const X_MAX = Math.max(...STUDIES.map((s) => s.upper), OVERALL.upper) + 1.5;

// Rendered inside ChartContainer to access the D3 coordinate scales.
function ForestMarks() {
  const xScale = useXScale();
  const yScale = useYScale();
  const drawingArea = useDrawingArea();

  const dividerY = yScale((ROWS[ROWS.length - 1].y + OVERALL_Y) / 2) ?? 0;
  const textX = drawingArea.left + drawingArea.width + 20;
  const capHalf = 6;

  return (
    <g>
      <line
        x1={drawingArea.left}
        x2={drawingArea.left + drawingArea.width}
        y1={dividerY}
        y2={dividerY}
        stroke={t.grid}
        strokeWidth={1}
      />

      {ROWS.map((r) => {
        const cx = xScale(r.effect) ?? 0;
        const cy = yScale(r.y) ?? 0;
        const x1 = xScale(r.lower) ?? 0;
        const x2 = xScale(r.upper) ?? 0;
        const half = markerHalf(r.weight);
        return (
          <g key={r.name}>
            <line x1={x1} x2={x2} y1={cy} y2={cy} stroke={t.palette[0]} strokeWidth={2} />
            <line x1={x1} x2={x1} y1={cy - capHalf} y2={cy + capHalf} stroke={t.palette[0]} strokeWidth={2} />
            <line x1={x2} x2={x2} y1={cy - capHalf} y2={cy + capHalf} stroke={t.palette[0]} strokeWidth={2} />
            <rect x={cx - half} y={cy - half} width={half * 2} height={half * 2} fill={t.palette[0]} />
            <text x={textX} y={cy + 5} fontSize={14} fill={t.inkSoft} fontFamily="sans-serif">
              {`${r.effect.toFixed(1)} [${r.lower.toFixed(1)}, ${r.upper.toFixed(1)}]  ·  ${r.weight.toFixed(1)}%`}
            </text>
          </g>
        );
      })}

      {(() => {
        const cy = yScale(OVERALL_Y) ?? 0;
        const xL = xScale(OVERALL.lower) ?? 0;
        const xC = xScale(OVERALL.effect) ?? 0;
        const xU = xScale(OVERALL.upper) ?? 0;
        const halfH = 13;
        return (
          <g>
            <polygon
              points={`${xL},${cy} ${xC},${cy - halfH} ${xU},${cy} ${xC},${cy + halfH}`}
              fill={t.ink}
              stroke={t.pageBg}
              strokeWidth={1}
            />
            <text x={textX} y={cy + 5} fontSize={14} fontWeight={700} fill={t.ink} fontFamily="sans-serif">
              {`${OVERALL.effect.toFixed(1)} [${OVERALL.lower.toFixed(1)}, ${OVERALL.upper.toFixed(1)}]`}
            </text>
          </g>
        );
      })()}
    </g>
  );
}

const TITLE = "Systolic BP Reduction · forest-basic · javascript · muix · anyplot.ai";
const TITLE_FONT_SIZE = Math.round(22 * Math.min(1, 67 / TITLE.length));
const SUBTITLE = "Mean difference vs. placebo (mmHg) · squares sized by study weight · diamond = pooled effect";
const TITLE_HEIGHT = 64;
const SUBTITLE_HEIGHT = 40;
const MARGIN = { top: 20, right: 250, bottom: 76, left: 240 };

export default function Chart() {
  const chartWidth = window.ANYPLOT_SIZE.width;
  const chartHeight = window.ANYPLOT_SIZE.height - TITLE_HEIGHT - SUBTITLE_HEIGHT;

  return (
    <Box
      sx={{
        width: chartWidth,
        height: window.ANYPLOT_SIZE.height,
        display: "flex",
        flexDirection: "column",
      }}
    >
      <Box sx={{ height: TITLE_HEIGHT, display: "flex", alignItems: "center", justifyContent: "center", flexShrink: 0 }}>
        <Typography sx={{ color: t.ink, fontSize: TITLE_FONT_SIZE, fontWeight: 500 }}>{TITLE}</Typography>
      </Box>
      <Box sx={{ height: SUBTITLE_HEIGHT, display: "flex", alignItems: "center", justifyContent: "center", flexShrink: 0 }}>
        <Typography sx={{ color: t.inkSoft, fontSize: 15 }}>{SUBTITLE}</Typography>
      </Box>

      <ChartContainer
        skipAnimation
        width={chartWidth}
        height={chartHeight}
        margin={MARGIN}
        series={[]}
        xAxis={[{
          scaleType: "linear",
          min: X_MIN,
          max: X_MAX,
          label: "Mean Difference in Systolic Blood Pressure (mmHg)",
          labelStyle: { fontSize: 15, fill: t.ink },
          tickLabelStyle: { fontSize: 13, fill: t.inkSoft },
        }]}
        yAxis={[{
          scaleType: "linear",
          min: OVERALL_Y - 1.2,
          max: N + 0.8,
          tickInterval: Y_TICKS,
          valueFormatter: (v) => Y_LABELS.get(v) ?? "",
          tickLabelStyle: { fontSize: 14, fill: t.inkSoft },
          tickSize: 4,
        }]}
        sx={{ "& .MuiChartsGrid-line": { stroke: t.grid, strokeOpacity: 0.5 } }}
      >
        <ChartsGrid vertical />
        <ChartsReferenceLine
          x={0}
          label="No difference"
          labelAlign="end"
          labelStyle={{ fontSize: 13, fill: t.inkSoft }}
          lineStyle={{ stroke: t.inkSoft, strokeDasharray: "6 4", strokeWidth: 1.5 }}
        />
        <ForestMarks />
        <ChartsXAxis />
        <ChartsYAxis disableLine />
      </ChartContainer>
    </Box>
  );
}
Runnable source as JSON, for any HTTP client: https://api.anyplot.ai/specs/forest-basic/muix/code. Any spec id and library id listed in llms-full.txt fit the same URL shape; every URL below is complete and callable.
{
  "spec_id": "forest-basic",
  "language": "javascript",
  "library": "muix",
  "page": "https://anyplot.ai/forest-basic/javascript/muix",
  "hub": "https://anyplot.ai/forest-basic",
  "code_json": "https://api.anyplot.ai/specs/forest-basic/muix/code",
  "spec_json": "https://api.anyplot.ai/specs/forest-basic",
  "render_light_png": "https://storage.googleapis.com/anyplot-images/plots/forest-basic/javascript/muix/plot-light.png",
  "render_dark_png": "https://storage.googleapis.com/anyplot-images/plots/forest-basic/javascript/muix/plot-dark.png",
  "interactive_light_html": "https://storage.googleapis.com/anyplot-images/plots/forest-basic/javascript/muix/plot-light.html",
  "interactive_dark_html": "https://storage.googleapis.com/anyplot-images/plots/forest-basic/javascript/muix/plot-dark.html",
  "quality_score": 91.0,
  "license": "MIT",
  "guide": "https://anyplot.ai/llms.txt"
}
Part of Meta-Analysis Forest Plot on anyplot.ai.