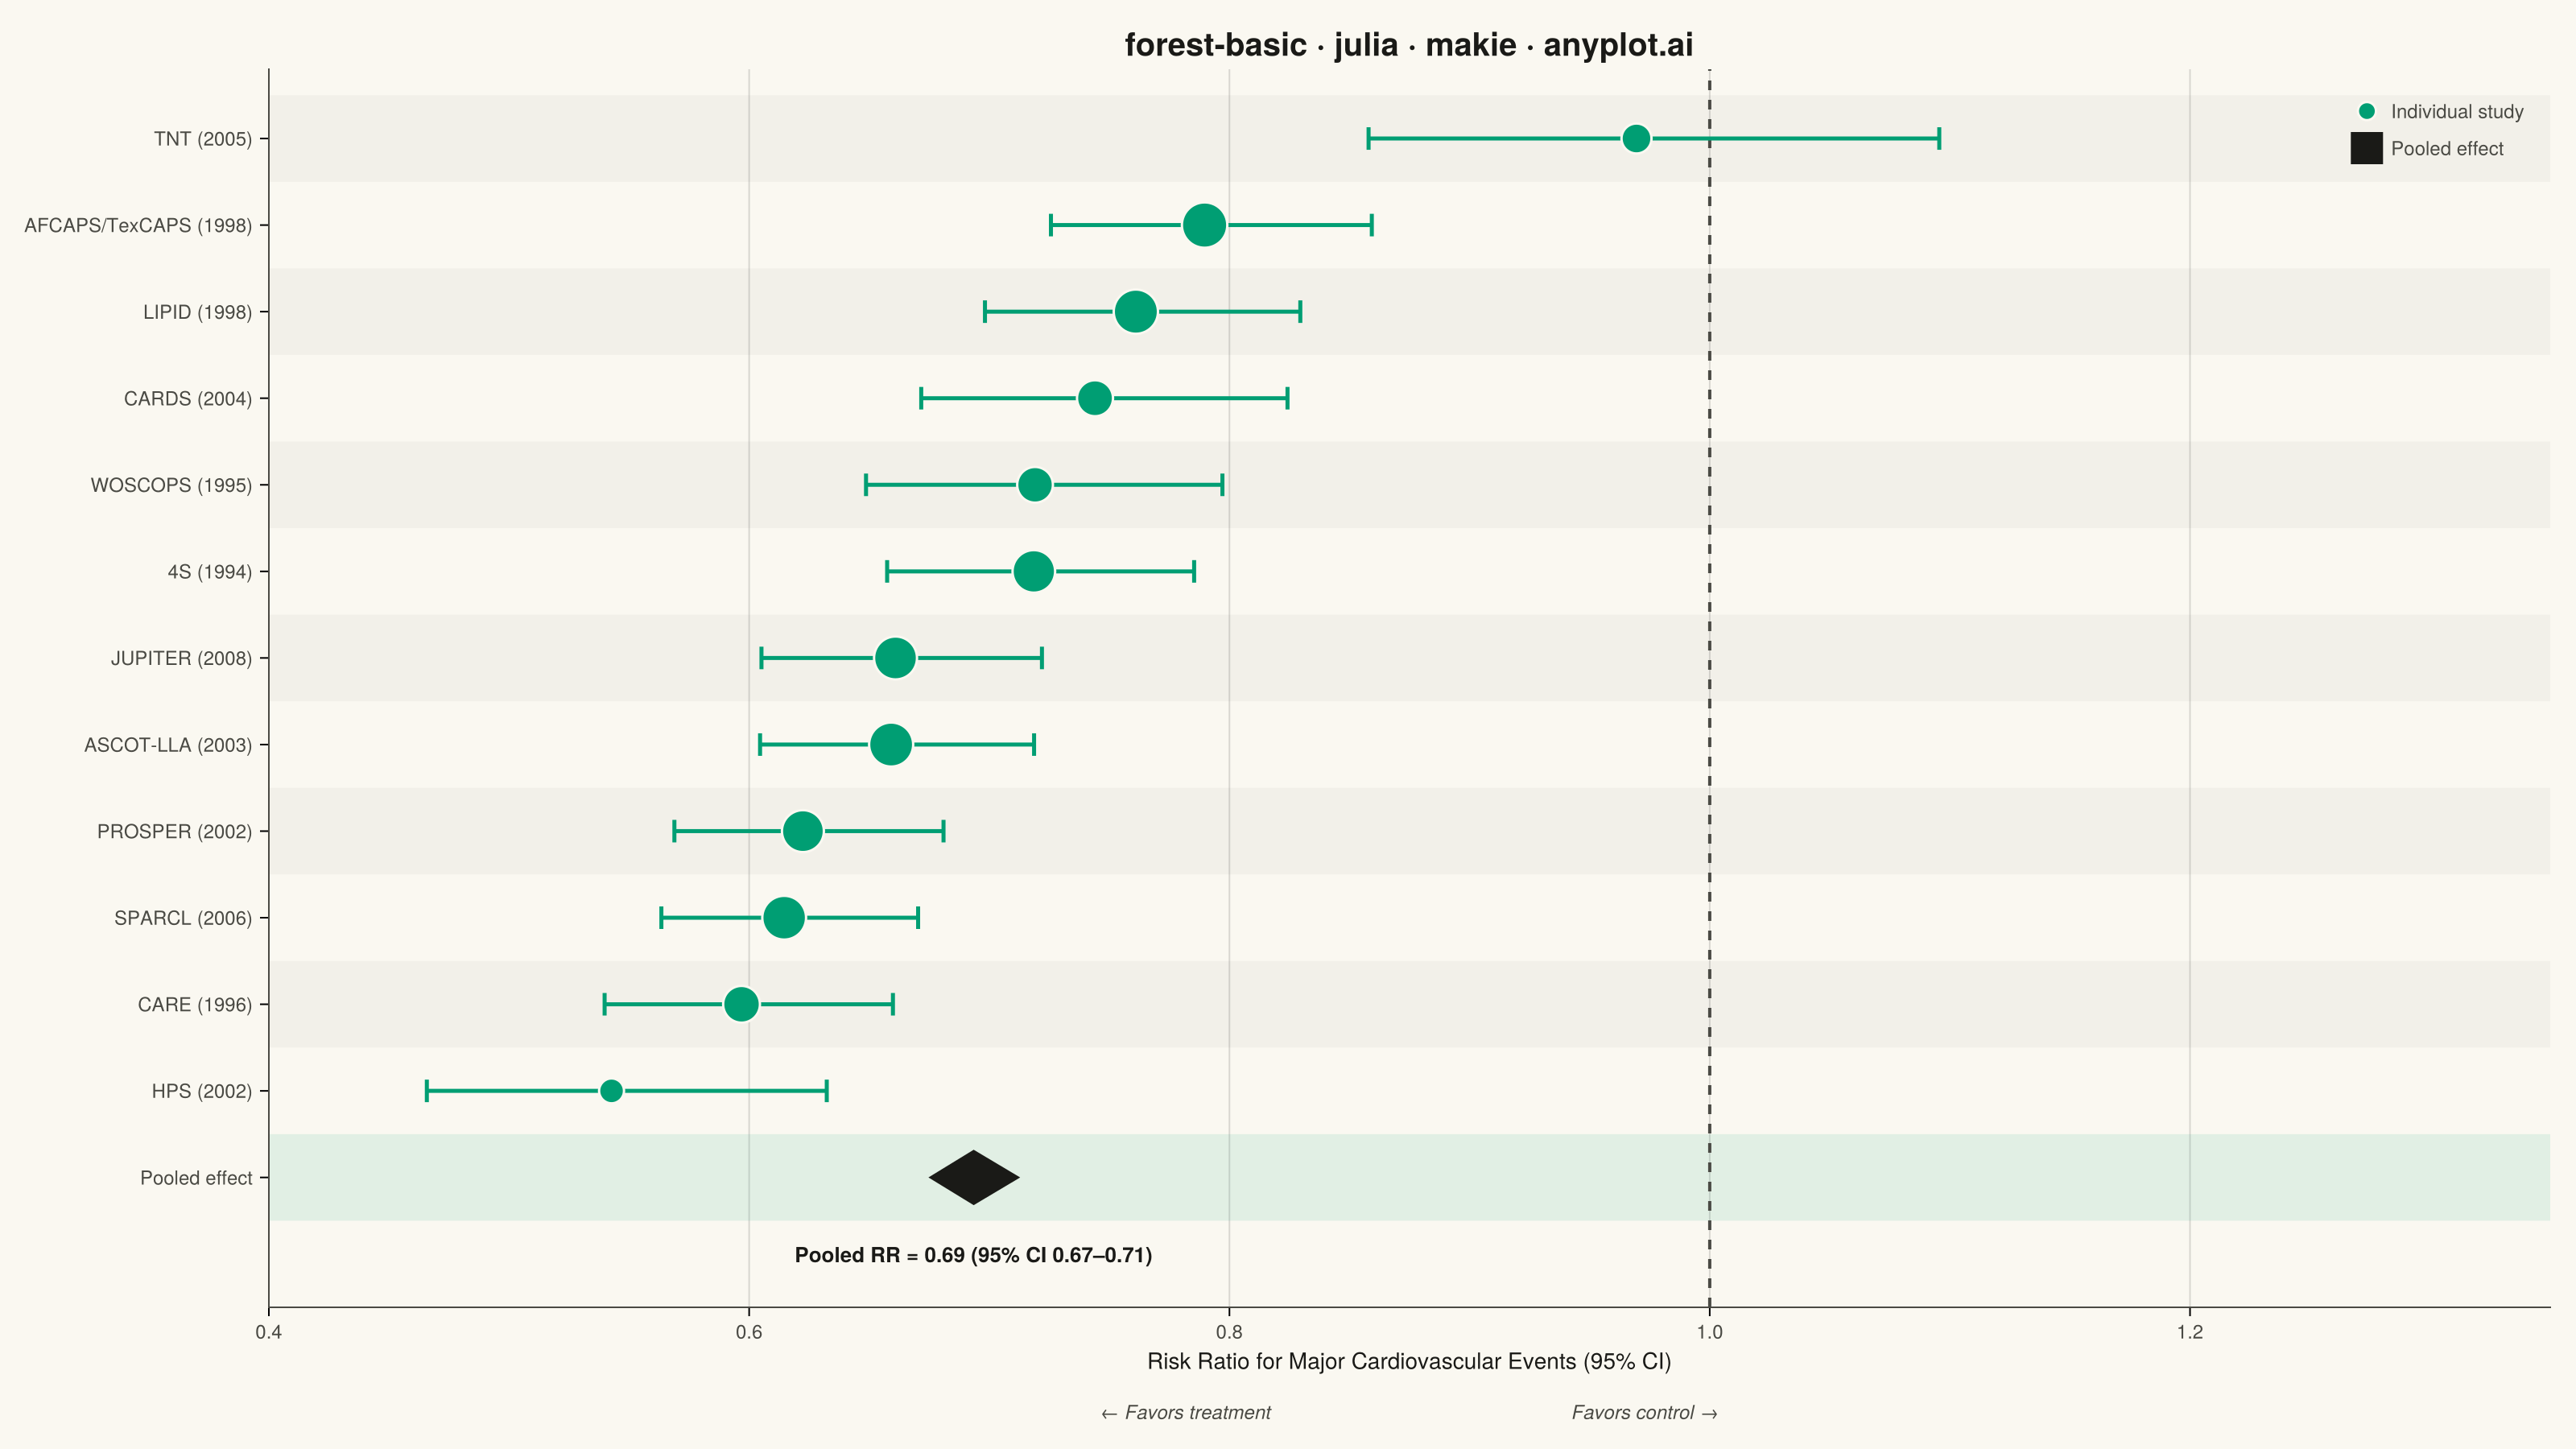
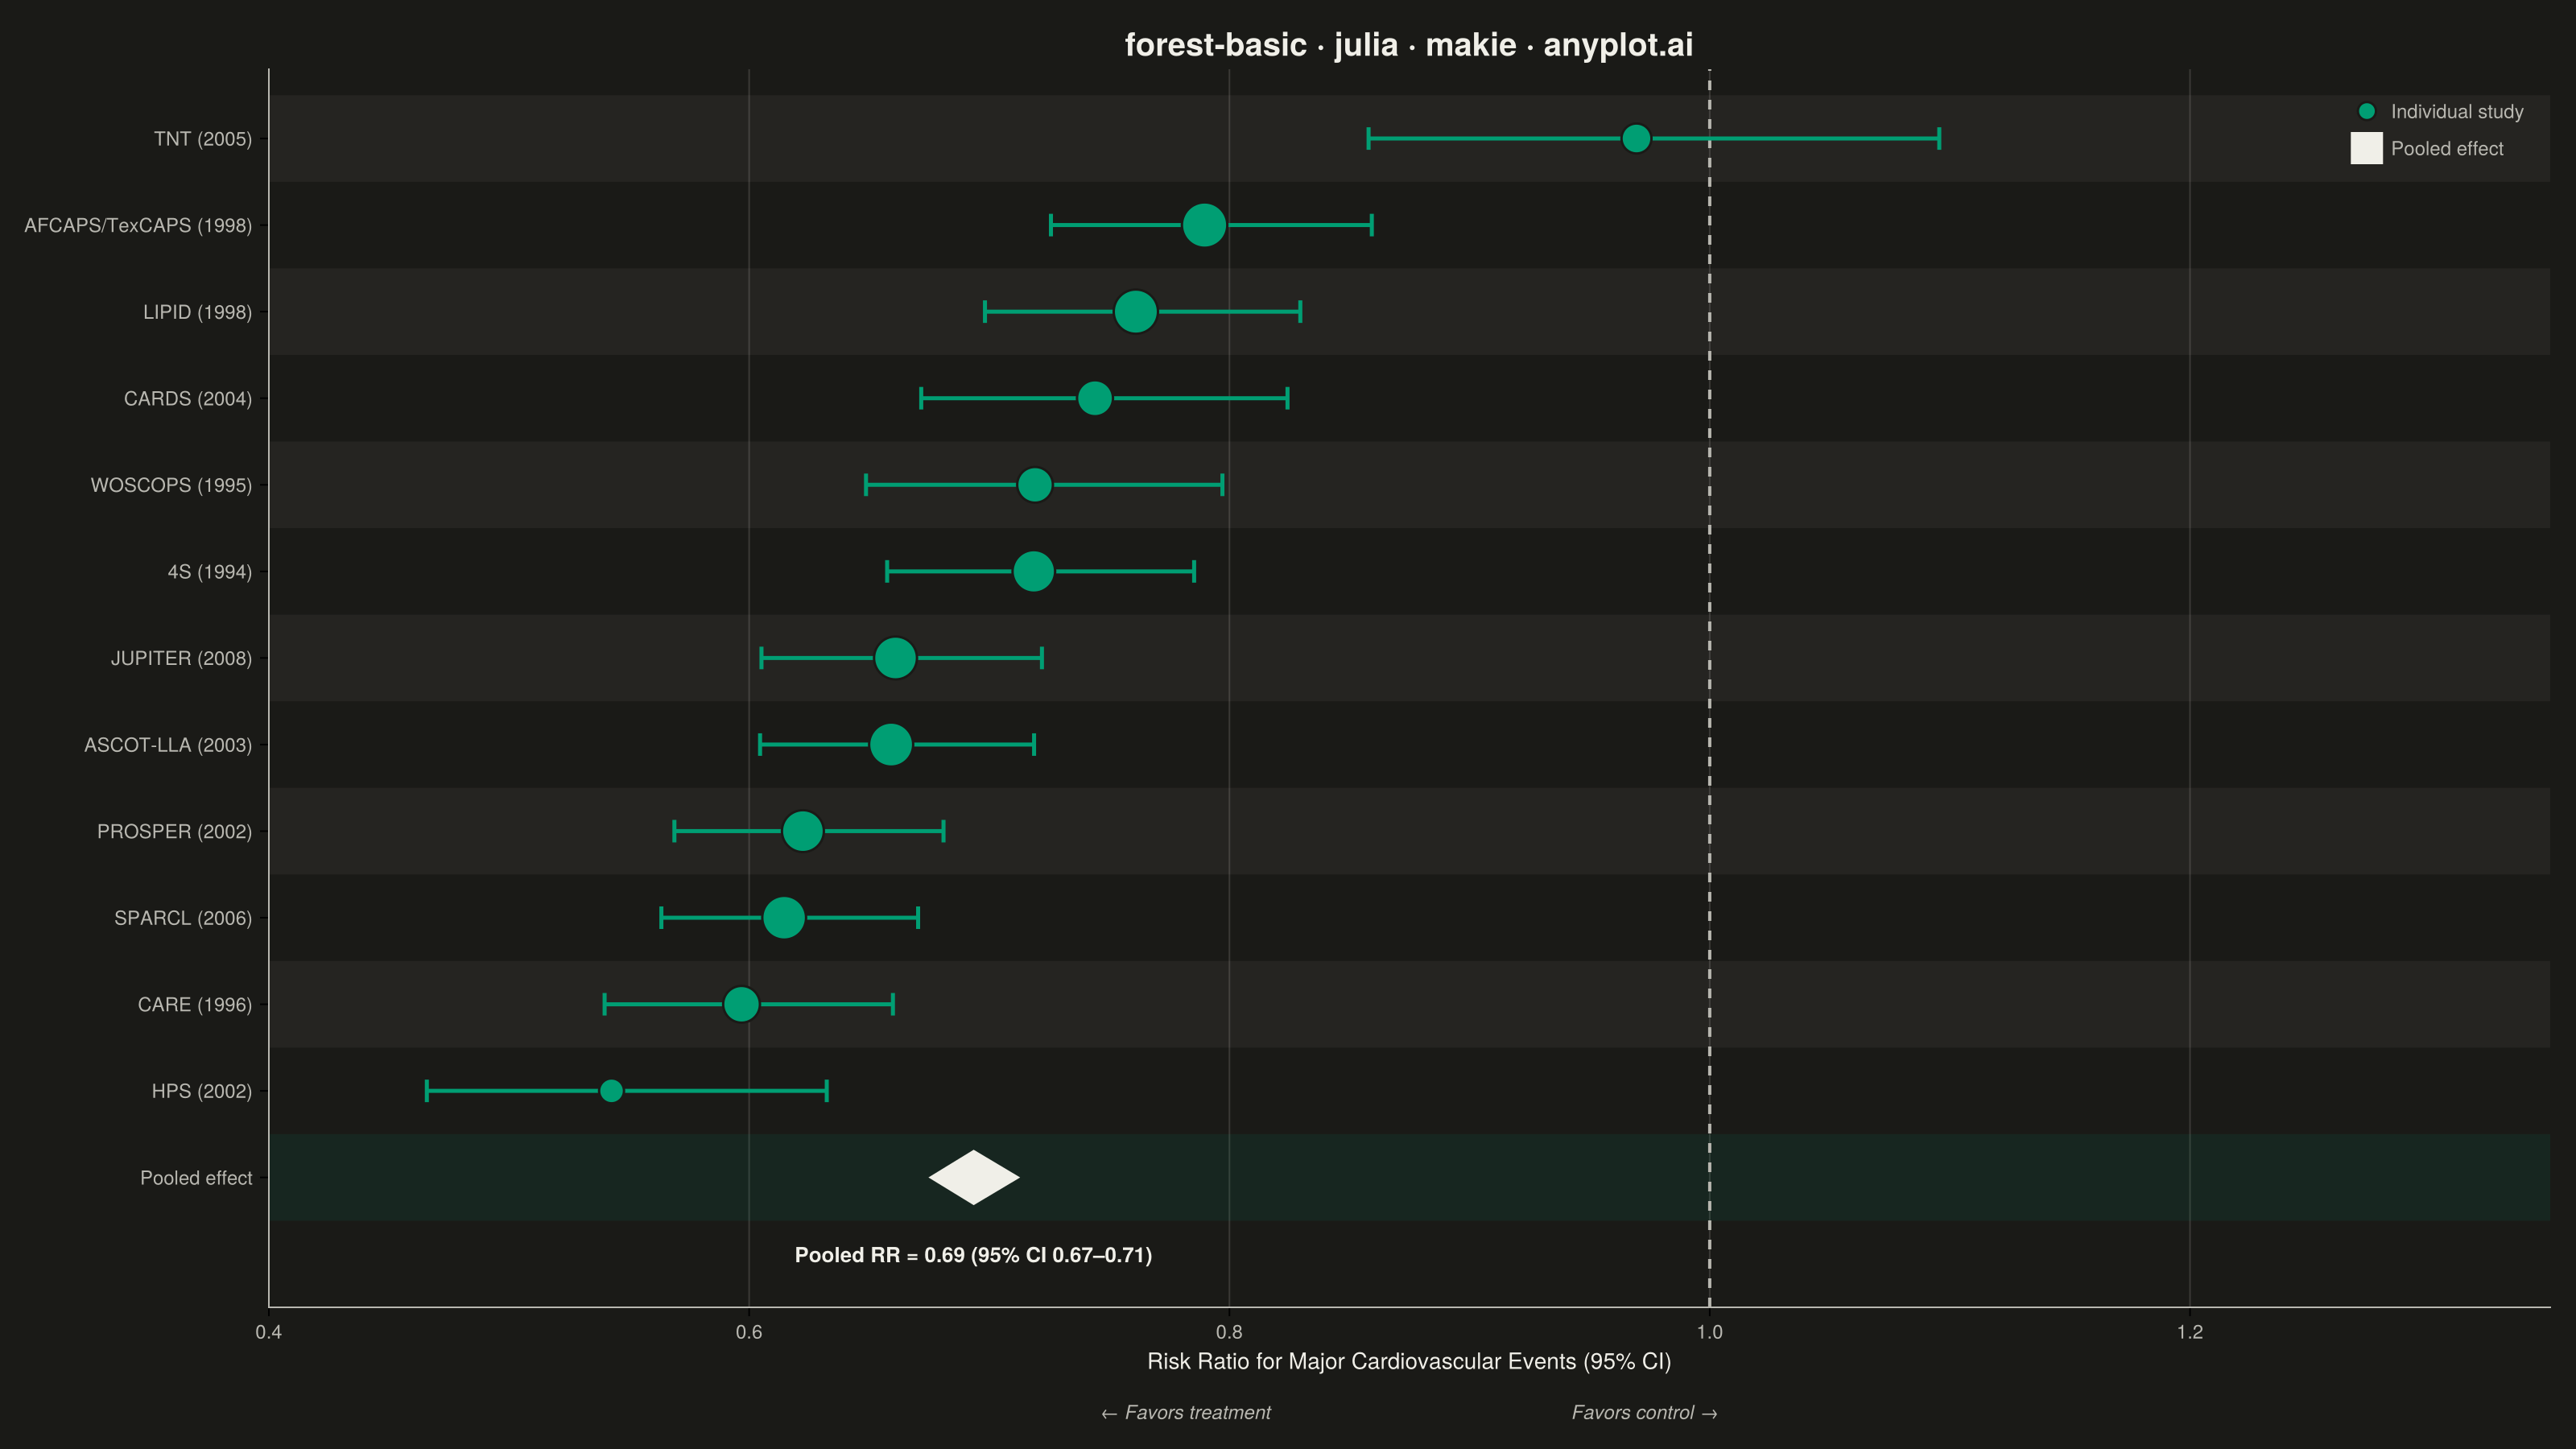
The same plot in 14 other libraries — Python: Altair, Bokeh, lets-plot, Matplotlib, Plotly, plotnine, Pygal, Seaborn; R: ggplot2; JavaScript: Chart.js, D3.js, Apache ECharts, Highcharts, MUI X Charts. Compare all 15 side by side: Meta-Analysis Forest Plot in Python, R, Julia and JavaScript.
A forest plot displays effect sizes with confidence intervals from multiple studies in a meta-analysis. Each study is represented as a point estimate with horizontal whiskers showing the confidence interval, and a diamond at the bottom shows the pooled estimate. The plot includes a vertical reference line at the null effect (typically 0 or 1), making it easy to assess statistical significance and heterogeneity across studies.
# anyplot.ai
# forest-basic: Meta-Analysis Forest Plot
# Library: makie 0.21.9 | Julia 1.11.9
# Quality: 92/100 | Created: 2026-09-05

using CairoMakie
using Colors
using Random

Random.seed!(42)

# --- Theme tokens -----------------------------------------------------------
const THEME    = get(ENV, "ANYPLOT_THEME", "light")
const PAGE_BG  = THEME == "light" ? colorant"#FAF8F1" : colorant"#1A1A17"
const INK      = THEME == "light" ? colorant"#1A1A17" : colorant"#F0EFE8"
const INK_SOFT = THEME == "light" ? colorant"#4A4A44" : colorant"#B8B7B0"
const IMPRINT_PALETTE = [
    colorant"#009E73", colorant"#C475FD", colorant"#4467A3", colorant"#BD8233",
    colorant"#AE3030", colorant"#2ABCCD", colorant"#954477", colorant"#99B314",
]
const BRAND = IMPRINT_PALETTE[1]

# --- Data: fixed-effect meta-analysis of 12 RCTs (risk ratio, event vs control) ---
n_studies = 12
sample_sizes = rand(60:900, n_studies)
study_se = 1.1 ./ sqrt.(sample_sizes)
between_study_tau = 0.22
overall_log_rr = log(0.75)
study_true_log_rr = overall_log_rr .+ randn(n_studies) .* between_study_tau
log_rr = study_true_log_rr .+ randn(n_studies) .* study_se

effect_size = exp.(log_rr)
ci_lower = exp.(log_rr .- 1.96 .* study_se)
ci_upper = exp.(log_rr .+ 1.96 .* study_se)
inverse_variance = 1 ./ study_se .^ 2
weight_pct = inverse_variance ./ sum(inverse_variance) .* 100

pooled_log_rr = sum(log_rr .* inverse_variance) / sum(inverse_variance)
pooled_se = sqrt(1 / sum(inverse_variance))
pooled_estimate = exp(pooled_log_rr)
pooled_lower = exp(pooled_log_rr - 1.96 * pooled_se)
pooled_upper = exp(pooled_log_rr + 1.96 * pooled_se)

# Landmark statin-vs-placebo RCTs for major adverse cardiovascular events
trial_names = [
    "4S (1994)", "WOSCOPS (1995)", "CARE (1996)", "AFCAPS/TexCAPS (1998)",
    "LIPID (1998)", "HPS (2002)", "PROSPER (2002)", "ASCOT-LLA (2003)",
    "CARDS (2004)", "TNT (2005)", "SPARCL (2006)", "JUPITER (2008)",
]

order = sortperm(effect_size; rev = true)
trial_names = trial_names[order]
effect_size = effect_size[order]
ci_lower = ci_lower[order]
ci_upper = ci_upper[order]
weight_pct = weight_pct[order]

study_ys = collect((n_studies + 1):-1:2)
pooled_y = 1
marker_sizes = 14 .+ 26 .* (weight_pct ./ maximum(weight_pct))

# --- Plot ---------------------------------------------------------------
fig = Figure(
    size            = (1600, 900),
    fontsize        = 14,
    backgroundcolor = PAGE_BG,
)

ax = Axis(
    fig[1, 1];
    title              = "forest-basic · julia · makie · anyplot.ai",
    titlesize          = 20,
    titlecolor         = INK,
    xlabel             = "Risk Ratio for Major Cardiovascular Events (95% CI)",
    xlabelsize         = 14,
    xlabelcolor        = INK,
    xticks             = 0.4:0.2:1.4,
    xticklabelsize     = 12,
    xticklabelcolor    = INK_SOFT,
    yticks             = (vcat(study_ys, pooled_y), vcat(trial_names, "Pooled effect")),
    yticklabelsize     = 12,
    yticklabelcolor    = INK_SOFT,
    backgroundcolor    = PAGE_BG,
    topspinevisible    = false,
    rightspinevisible  = false,
    leftspinecolor     = INK_SOFT,
    bottomspinecolor   = INK_SOFT,
    xgridvisible       = true,
    ygridvisible       = false,
    xgridcolor         = RGBAf(INK.r, INK.g, INK.b, 0.15),
)

xlims!(ax, 0.4, 1.35)
ylims!(ax, -0.5, n_studies + 1.8)

# --- Row banding: subtle zebra striping + a highlighted pooled row ---------
band_color = RGBAf(INK.r, INK.g, INK.b, THEME == "light" ? 0.035 : 0.05)
for (i, y) in enumerate(study_ys)
    if isodd(i)
        hspan!(ax, y - 0.5, y + 0.5; color = band_color)
    end
end
pooled_band_color = RGBAf(BRAND.r, BRAND.g, BRAND.b, 0.10)
hspan!(ax, pooled_y - 0.5, pooled_y + 0.5; color = pooled_band_color)

vlines!(ax, [1.0]; color = INK_SOFT, linestyle = :dash, linewidth = 2)

rangebars!(ax, study_ys, ci_lower, ci_upper;
    direction = :x, color = BRAND, linewidth = 2.5, whiskerwidth = 14)
scatter!(ax, effect_size, study_ys;
    markersize = marker_sizes, color = BRAND, strokewidth = 1.5, strokecolor = PAGE_BG)

pooled_half_height = 0.32
diamond = Point2f[
    (pooled_lower, pooled_y),
    (pooled_estimate, pooled_y + pooled_half_height),
    (pooled_upper, pooled_y),
    (pooled_estimate, pooled_y - pooled_half_height),
]
poly!(ax, diamond; color = INK, strokewidth = 0)

pooled_label = "Pooled RR = $(round(pooled_estimate, digits = 2)) " *
               "(95% CI $(round(pooled_lower, digits = 2))–$(round(pooled_upper, digits = 2)))"
text!(ax, pooled_estimate, pooled_y - 0.75;
    text = pooled_label, align = (:center, :top), fontsize = 13, color = INK, font = :bold)

legend_elements = [
    MarkerElement(marker = :circle, color = BRAND, markersize = 16,
        strokewidth = 1.5, strokecolor = PAGE_BG),
    PolyElement(color = INK),
]
Legend(fig[1, 1], legend_elements, ["Individual study", "Pooled effect"];
    tellwidth = false, tellheight = false, halign = :right, valign = :top,
    margin = (10, 10, 10, 10), framevisible = false, labelcolor = INK_SOFT,
    labelsize = 12)

Label(fig[2, 1], "← Favors treatment                                                        Favors control →";
    fontsize = 12, color = INK_SOFT, font = :italic, tellwidth = false, halign = :center)

# --- Save -------------------------------------------------------------------
save("plot-$(THEME).png", fig; px_per_unit = 2)
Runnable source as JSON, for any HTTP client: https://api.anyplot.ai/specs/forest-basic/makie/code. Any spec id and library id listed in llms-full.txt fit the same URL shape; every URL below is complete and callable.
{
  "spec_id": "forest-basic",
  "language": "julia",
  "library": "makie",
  "page": "https://anyplot.ai/forest-basic/julia/makie",
  "hub": "https://anyplot.ai/forest-basic",
  "code_json": "https://api.anyplot.ai/specs/forest-basic/makie/code",
  "spec_json": "https://api.anyplot.ai/specs/forest-basic",
  "render_light_png": "https://storage.googleapis.com/anyplot-images/plots/forest-basic/julia/makie/plot-light.png",
  "render_dark_png": "https://storage.googleapis.com/anyplot-images/plots/forest-basic/julia/makie/plot-dark.png",
  "quality_score": 92.0,
  "license": "MIT",
  "guide": "https://anyplot.ai/llms.txt"
}
Part of Meta-Analysis Forest Plot on anyplot.ai.