The same plot in 14 other libraries — JavaScript: D3.js, Apache ECharts, Highcharts, MUI X Charts; Python: Altair, Bokeh, lets-plot, Matplotlib, Plotly, plotnine, Pygal, Seaborn; R: ggplot2; Julia: Makie.jl. Compare all 15 side by side: Meta-Analysis Funnel Plot for Publication Bias in Python, R, Julia and JavaScript.
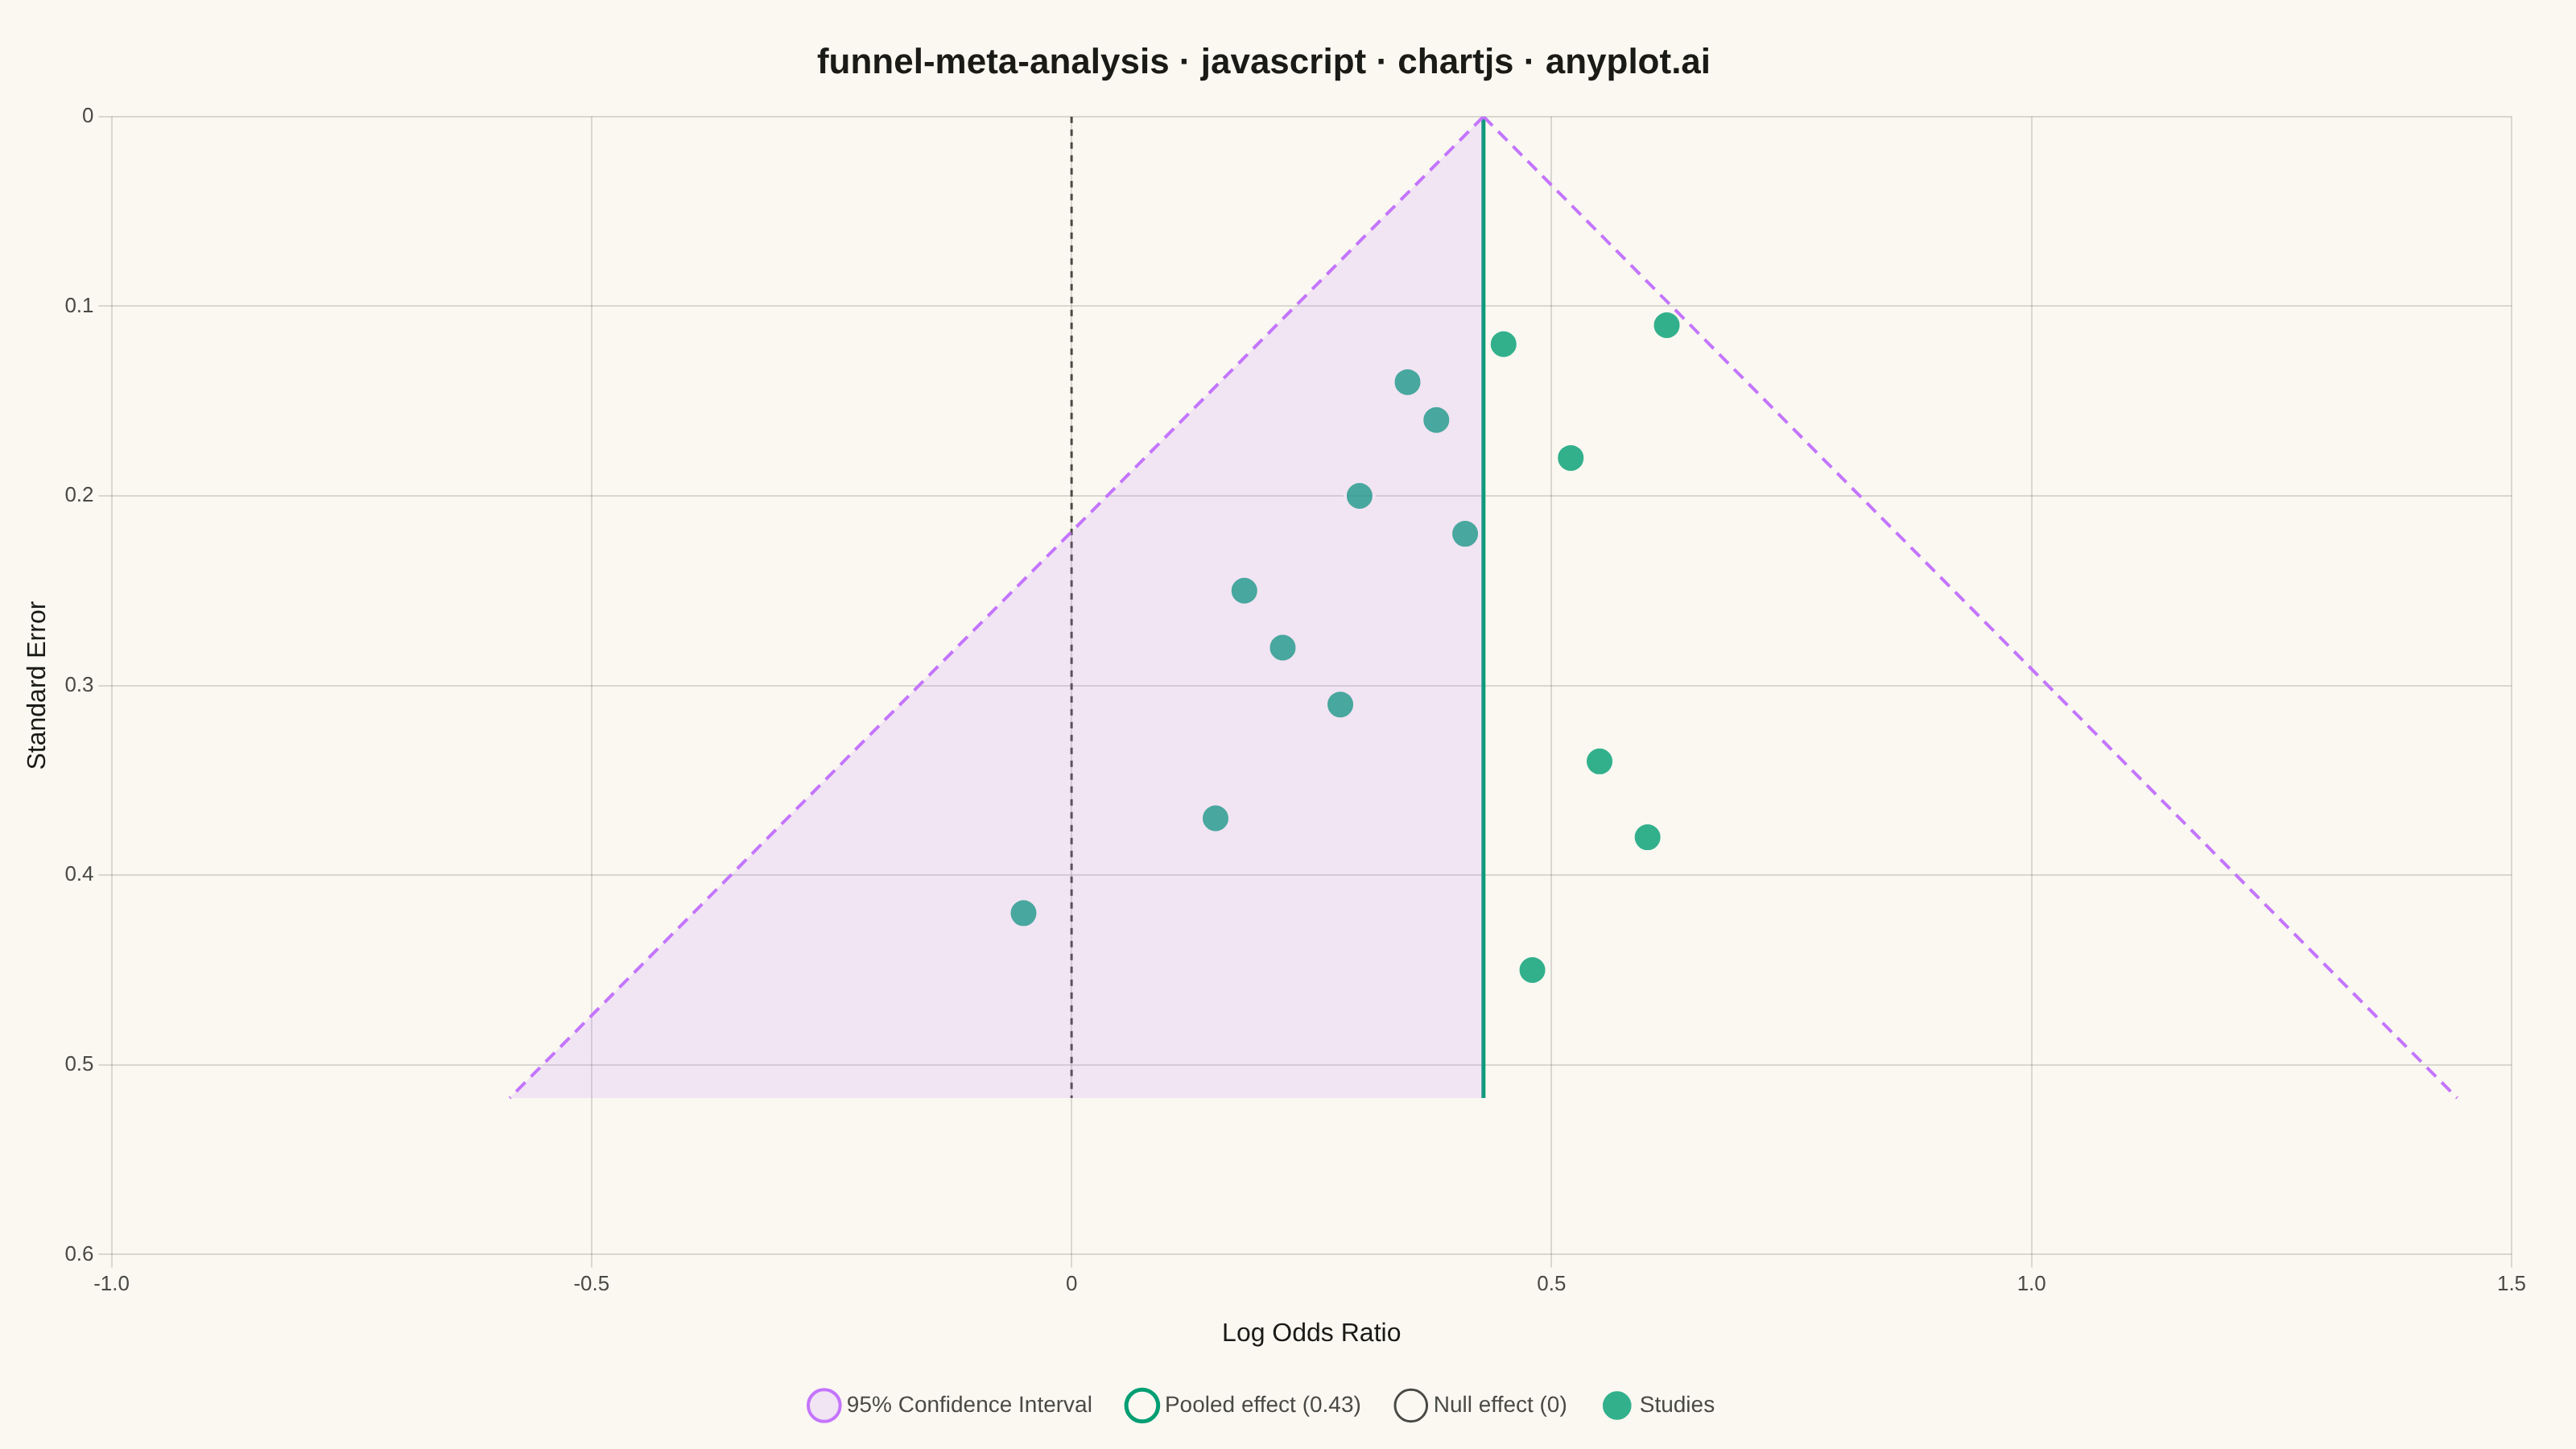
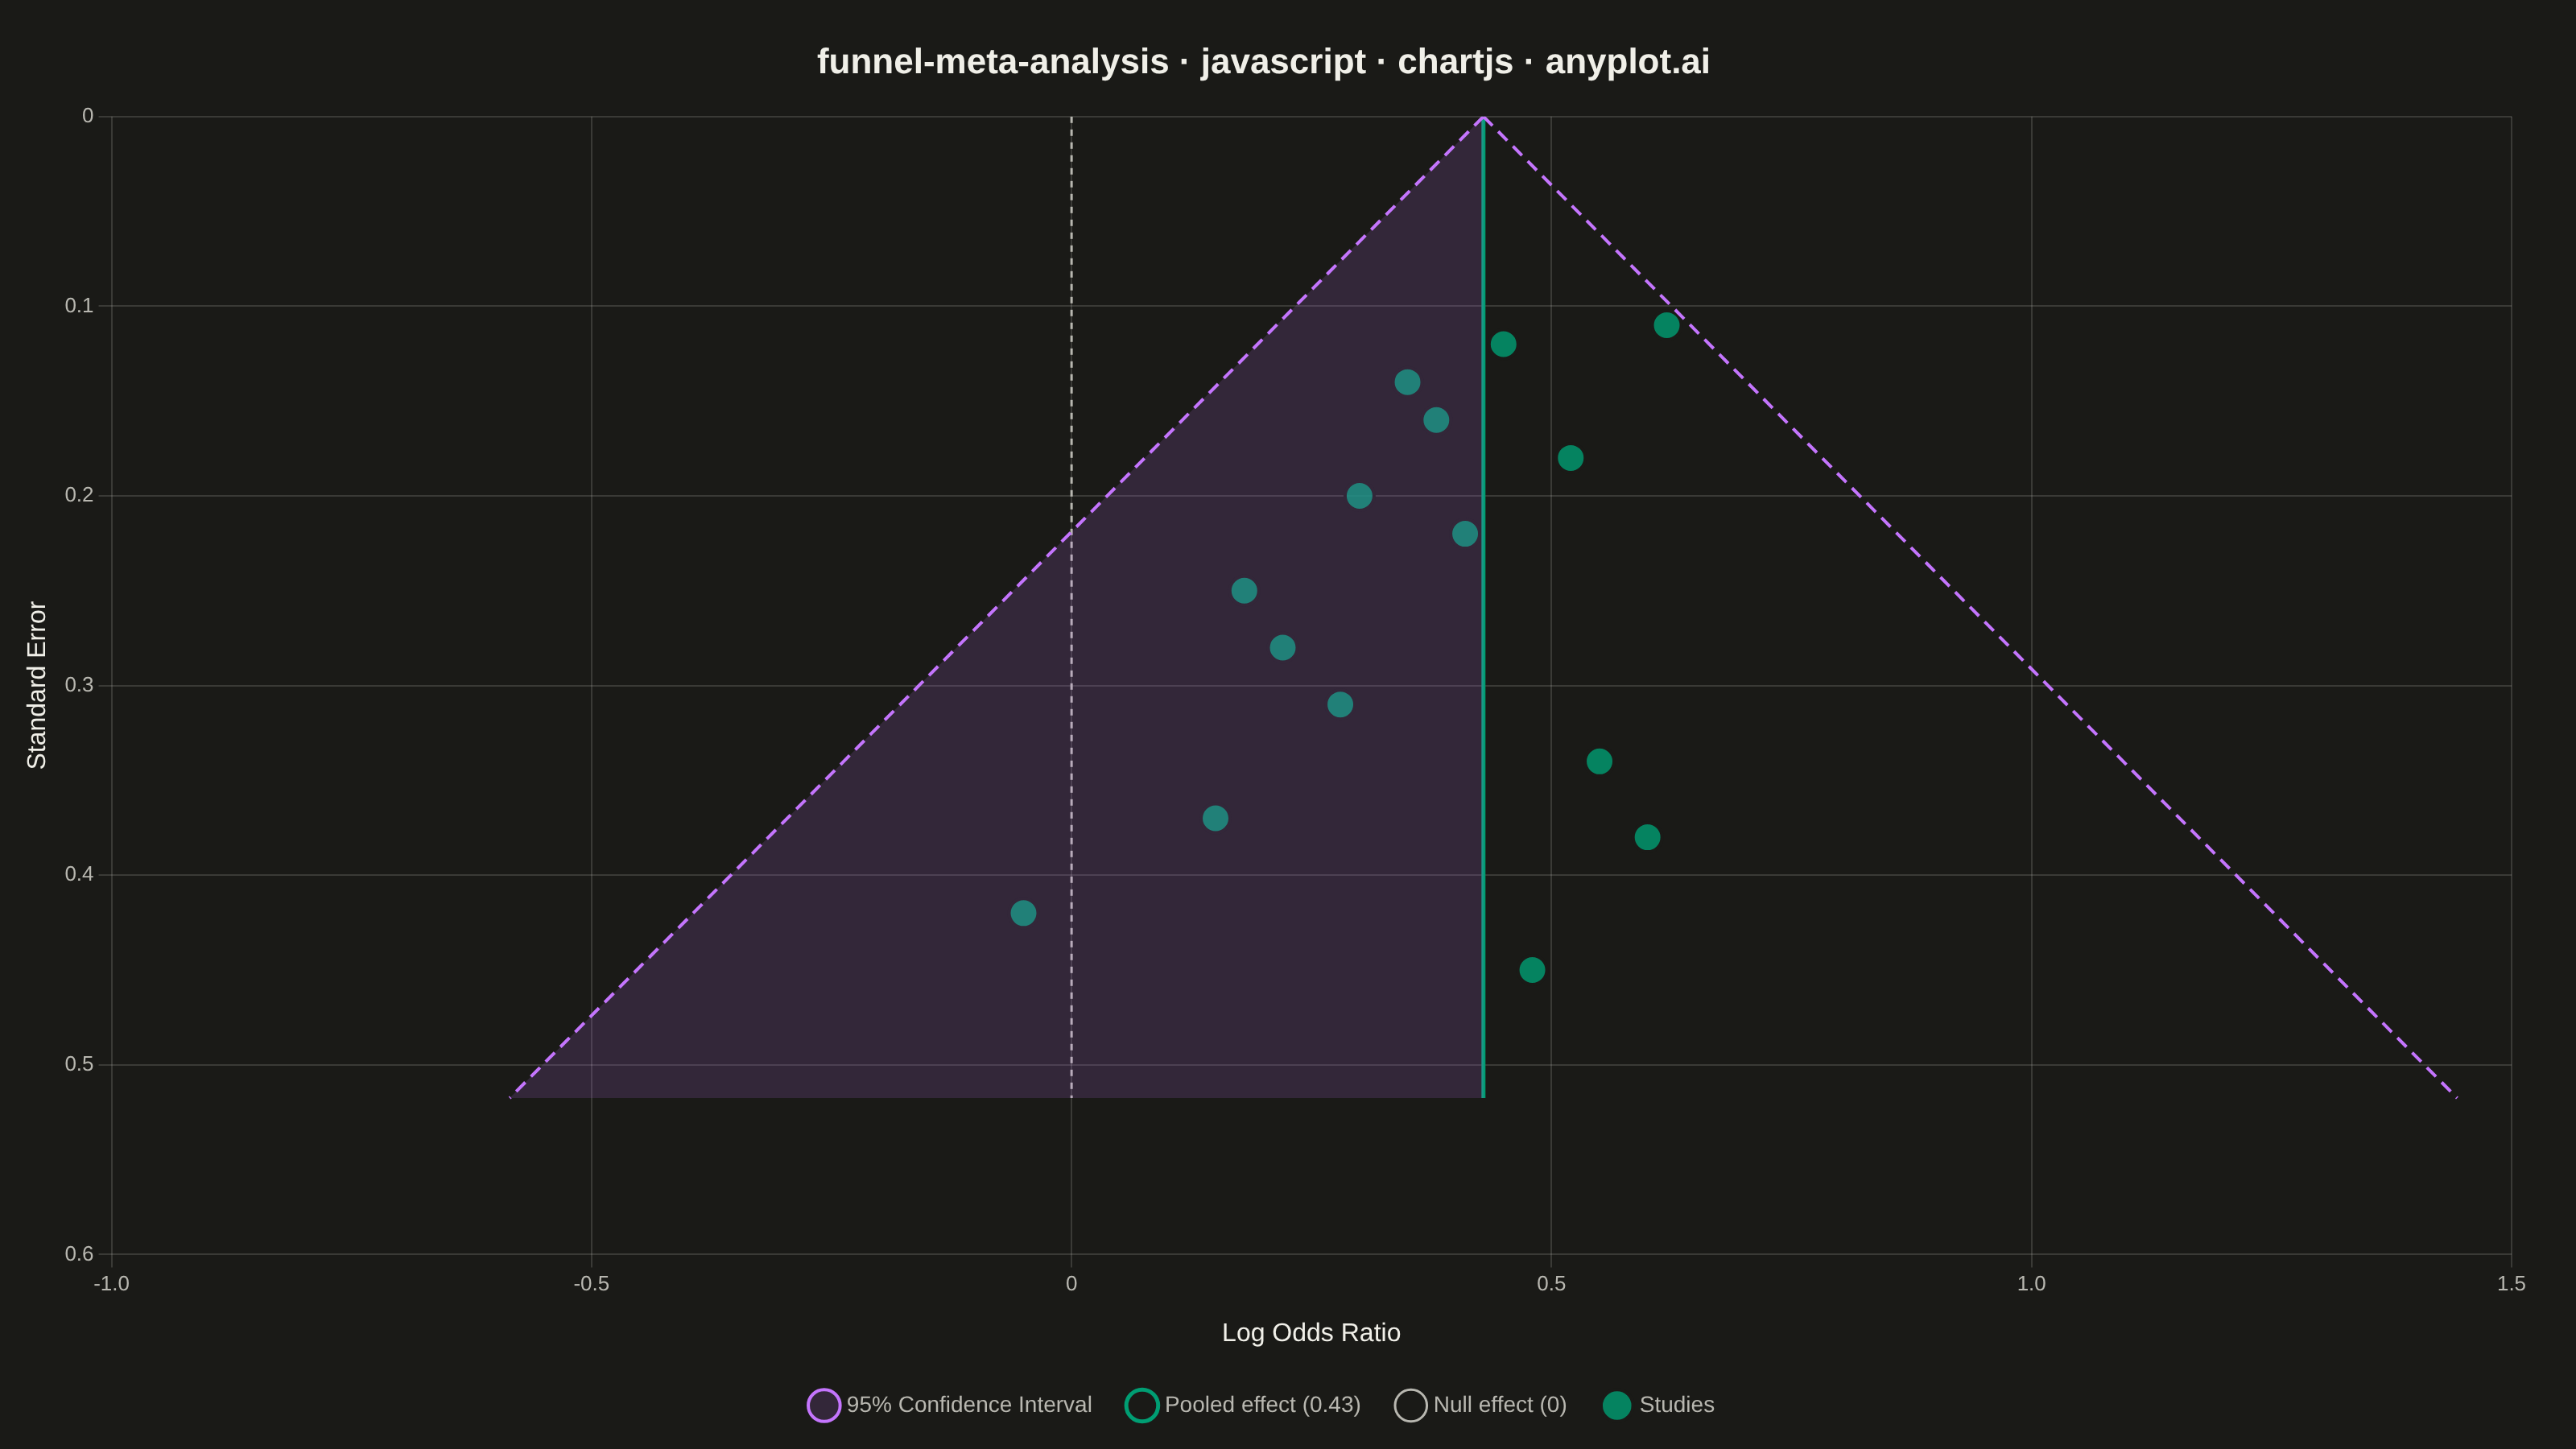
A funnel plot used in meta-analysis to assess publication bias by plotting individual study effect sizes against their precision (typically standard error). Studies scatter around a summary effect line, with pseudo 95% confidence limits forming an inverted funnel shape. In the absence of bias, studies distribute symmetrically around the summary effect; asymmetry suggests publication bias or systematic heterogeneity. This is a standard tool in systematic reviews and Cochrane-style meta-analyses.
// anyplot.ai
// funnel-meta-analysis: Meta-Analysis Funnel Plot for Publication Bias
// Library: chartjs 4.4.7 | JavaScript 22.22.3
// Quality: 89/100 | Created: 2026-06-10
//# anyplot-orientation: landscape

const t = window.ANYPLOT_TOKENS;

// 15 RCTs comparing drug vs placebo — log odds ratios and standard errors
const studies = [
  { logOR: 0.52, se: 0.18 },
  { logOR: 0.41, se: 0.22 },
  { logOR: 0.28, se: 0.31 },
  { logOR: 0.35, se: 0.14 },
  { logOR: 0.18, se: 0.25 },
  { logOR: 0.60, se: 0.38 },
  { logOR: 0.45, se: 0.12 },
  { logOR: 0.22, se: 0.28 },
  { logOR: -0.05, se: 0.42 },
  { logOR: 0.38, se: 0.16 },
  { logOR: 0.55, se: 0.34 },
  { logOR: 0.30, se: 0.20 },
  { logOR: 0.48, se: 0.45 },
  { logOR: 0.15, se: 0.37 },
  { logOR: 0.62, se: 0.11 },
];

// Inverse-variance weighted pooled effect
const weights = studies.map(s => 1 / (s.se * s.se));
const totalWeight = weights.reduce((a, b) => a + b, 0);
const summaryEffect = studies.reduce((sum, s, i) => sum + weights[i] * s.logOR, 0) / totalWeight;

const maxSE = Math.max(...studies.map(s => s.se)) * 1.15;
const axisMax = Math.ceil(maxSE * 10) / 10;  // round up to avoid duplicate boundary tick at 0.5

// Funnel boundaries: apex at (summaryEffect, 0), base at SE=maxSE
const funnelLeft  = [{ x: summaryEffect, y: 0 }, { x: summaryEffect - 1.96 * maxSE, y: maxSE }];
const funnelRight = [{ x: summaryEffect, y: 0 }, { x: summaryEffect + 1.96 * maxSE, y: maxSE }];

// Mount canvas
const canvas = document.createElement("canvas");
document.getElementById("container").appendChild(canvas);

new Chart(canvas, {
  type: "scatter",
  data: {
    datasets: [
      // Funnel left boundary — in legend as "95% CI", fills toward right boundary
      {
        type: "line",
        label: "95% Confidence Interval",
        data: funnelLeft,
        borderColor: t.palette[1],
        backgroundColor: t.palette[1] + "26",
        borderWidth: 2,
        borderDash: [8, 5],
        pointRadius: 0,
        tension: 0,
        fill: "+1",
      },
      // Funnel right boundary — hidden from legend, fill target for left boundary
      {
        type: "line",
        label: "_funnel_right",
        data: funnelRight,
        borderColor: t.palette[1],
        backgroundColor: "transparent",
        borderWidth: 2,
        borderDash: [8, 5],
        pointRadius: 0,
        tension: 0,
        fill: false,
      },
      // Pooled effect vertical line
      {
        type: "line",
        label: `Pooled effect (${summaryEffect.toFixed(2)})`,
        data: [{ x: summaryEffect, y: 0 }, { x: summaryEffect, y: maxSE }],
        borderColor: t.palette[0],
        backgroundColor: "transparent",
        borderWidth: 2.5,
        pointRadius: 0,
        tension: 0,
      },
      // Null effect reference line
      {
        type: "line",
        label: "Null effect (0)",
        data: [{ x: 0, y: 0 }, { x: 0, y: maxSE }],
        borderColor: t.inkSoft,
        backgroundColor: "transparent",
        borderWidth: 1.5,
        borderDash: [4, 4],
        pointRadius: 0,
        tension: 0,
      },
      // Individual study points — Imprint palette position 1 as first series
      {
        type: "scatter",
        label: "Studies",
        data: studies.map(s => ({ x: s.logOR, y: s.se })),
        backgroundColor: t.palette[0] + "CC",
        borderColor: t.pageBg,
        borderWidth: 2,
        pointRadius: 9,
        pointHoverRadius: 11,
      },
    ],
  },
  options: {
    responsive: true,
    maintainAspectRatio: false,
    animation: false,
    layout: { padding: { top: 10, right: 40, bottom: 10, left: 10 } },
    plugins: {
      title: {
        display: true,
        text: "funnel-meta-analysis · javascript · chartjs · anyplot.ai",
        color: t.ink,
        font: { size: 22, weight: "600" },
        padding: { top: 16, bottom: 20 },
      },
      legend: {
        display: true,
        position: "bottom",
        labels: {
          color: t.inkSoft,
          font: { size: 14 },
          padding: 24,
          usePointStyle: true,
          filter: item => !item.text.startsWith("_"),
        },
      },
    },
    scales: {
      x: {
        title: {
          display: true,
          text: "Log Odds Ratio",
          color: t.ink,
          font: { size: 16, weight: "500" },
          padding: { top: 10 },
        },
        ticks: { color: t.inkSoft, font: { size: 13 } },
        grid: { color: t.grid },
        border: { display: false },
      },
      y: {
        reverse: true,
        min: 0,
        max: axisMax,
        title: {
          display: true,
          text: "Standard Error",
          color: t.ink,
          font: { size: 16, weight: "500" },
        },
        ticks: { color: t.inkSoft, font: { size: 13 } },
        grid: { color: t.grid },
        border: { display: false },
      },
    },
  },
});
Runnable source as JSON, for any HTTP client: https://api.anyplot.ai/specs/funnel-meta-analysis/chartjs/code. Any spec id and library id listed in llms-full.txt fit the same URL shape; every URL below is complete and callable.
{
  "spec_id": "funnel-meta-analysis",
  "language": "javascript",
  "library": "chartjs",
  "page": "https://anyplot.ai/funnel-meta-analysis/javascript/chartjs",
  "hub": "https://anyplot.ai/funnel-meta-analysis",
  "code_json": "https://api.anyplot.ai/specs/funnel-meta-analysis/chartjs/code",
  "spec_json": "https://api.anyplot.ai/specs/funnel-meta-analysis",
  "render_light_png": "https://storage.googleapis.com/anyplot-images/plots/funnel-meta-analysis/javascript/chartjs/plot-light.png",
  "render_dark_png": "https://storage.googleapis.com/anyplot-images/plots/funnel-meta-analysis/javascript/chartjs/plot-dark.png",
  "interactive_light_html": "https://storage.googleapis.com/anyplot-images/plots/funnel-meta-analysis/javascript/chartjs/plot-light.html",
  "interactive_dark_html": "https://storage.googleapis.com/anyplot-images/plots/funnel-meta-analysis/javascript/chartjs/plot-dark.html",
  "quality_score": 89.0,
  "license": "MIT",
  "guide": "https://anyplot.ai/llms.txt"
}
Part of Meta-Analysis Funnel Plot for Publication Bias on anyplot.ai.