The same plot in 14 other libraries — JavaScript: Chart.js, D3.js, Highcharts, MUI X Charts; Python: Altair, Bokeh, lets-plot, Matplotlib, Plotly, plotnine, Pygal, Seaborn; R: ggplot2; Julia: Makie.jl. Compare all 15 side by side: Meta-Analysis Funnel Plot for Publication Bias in Python, R, Julia and JavaScript.
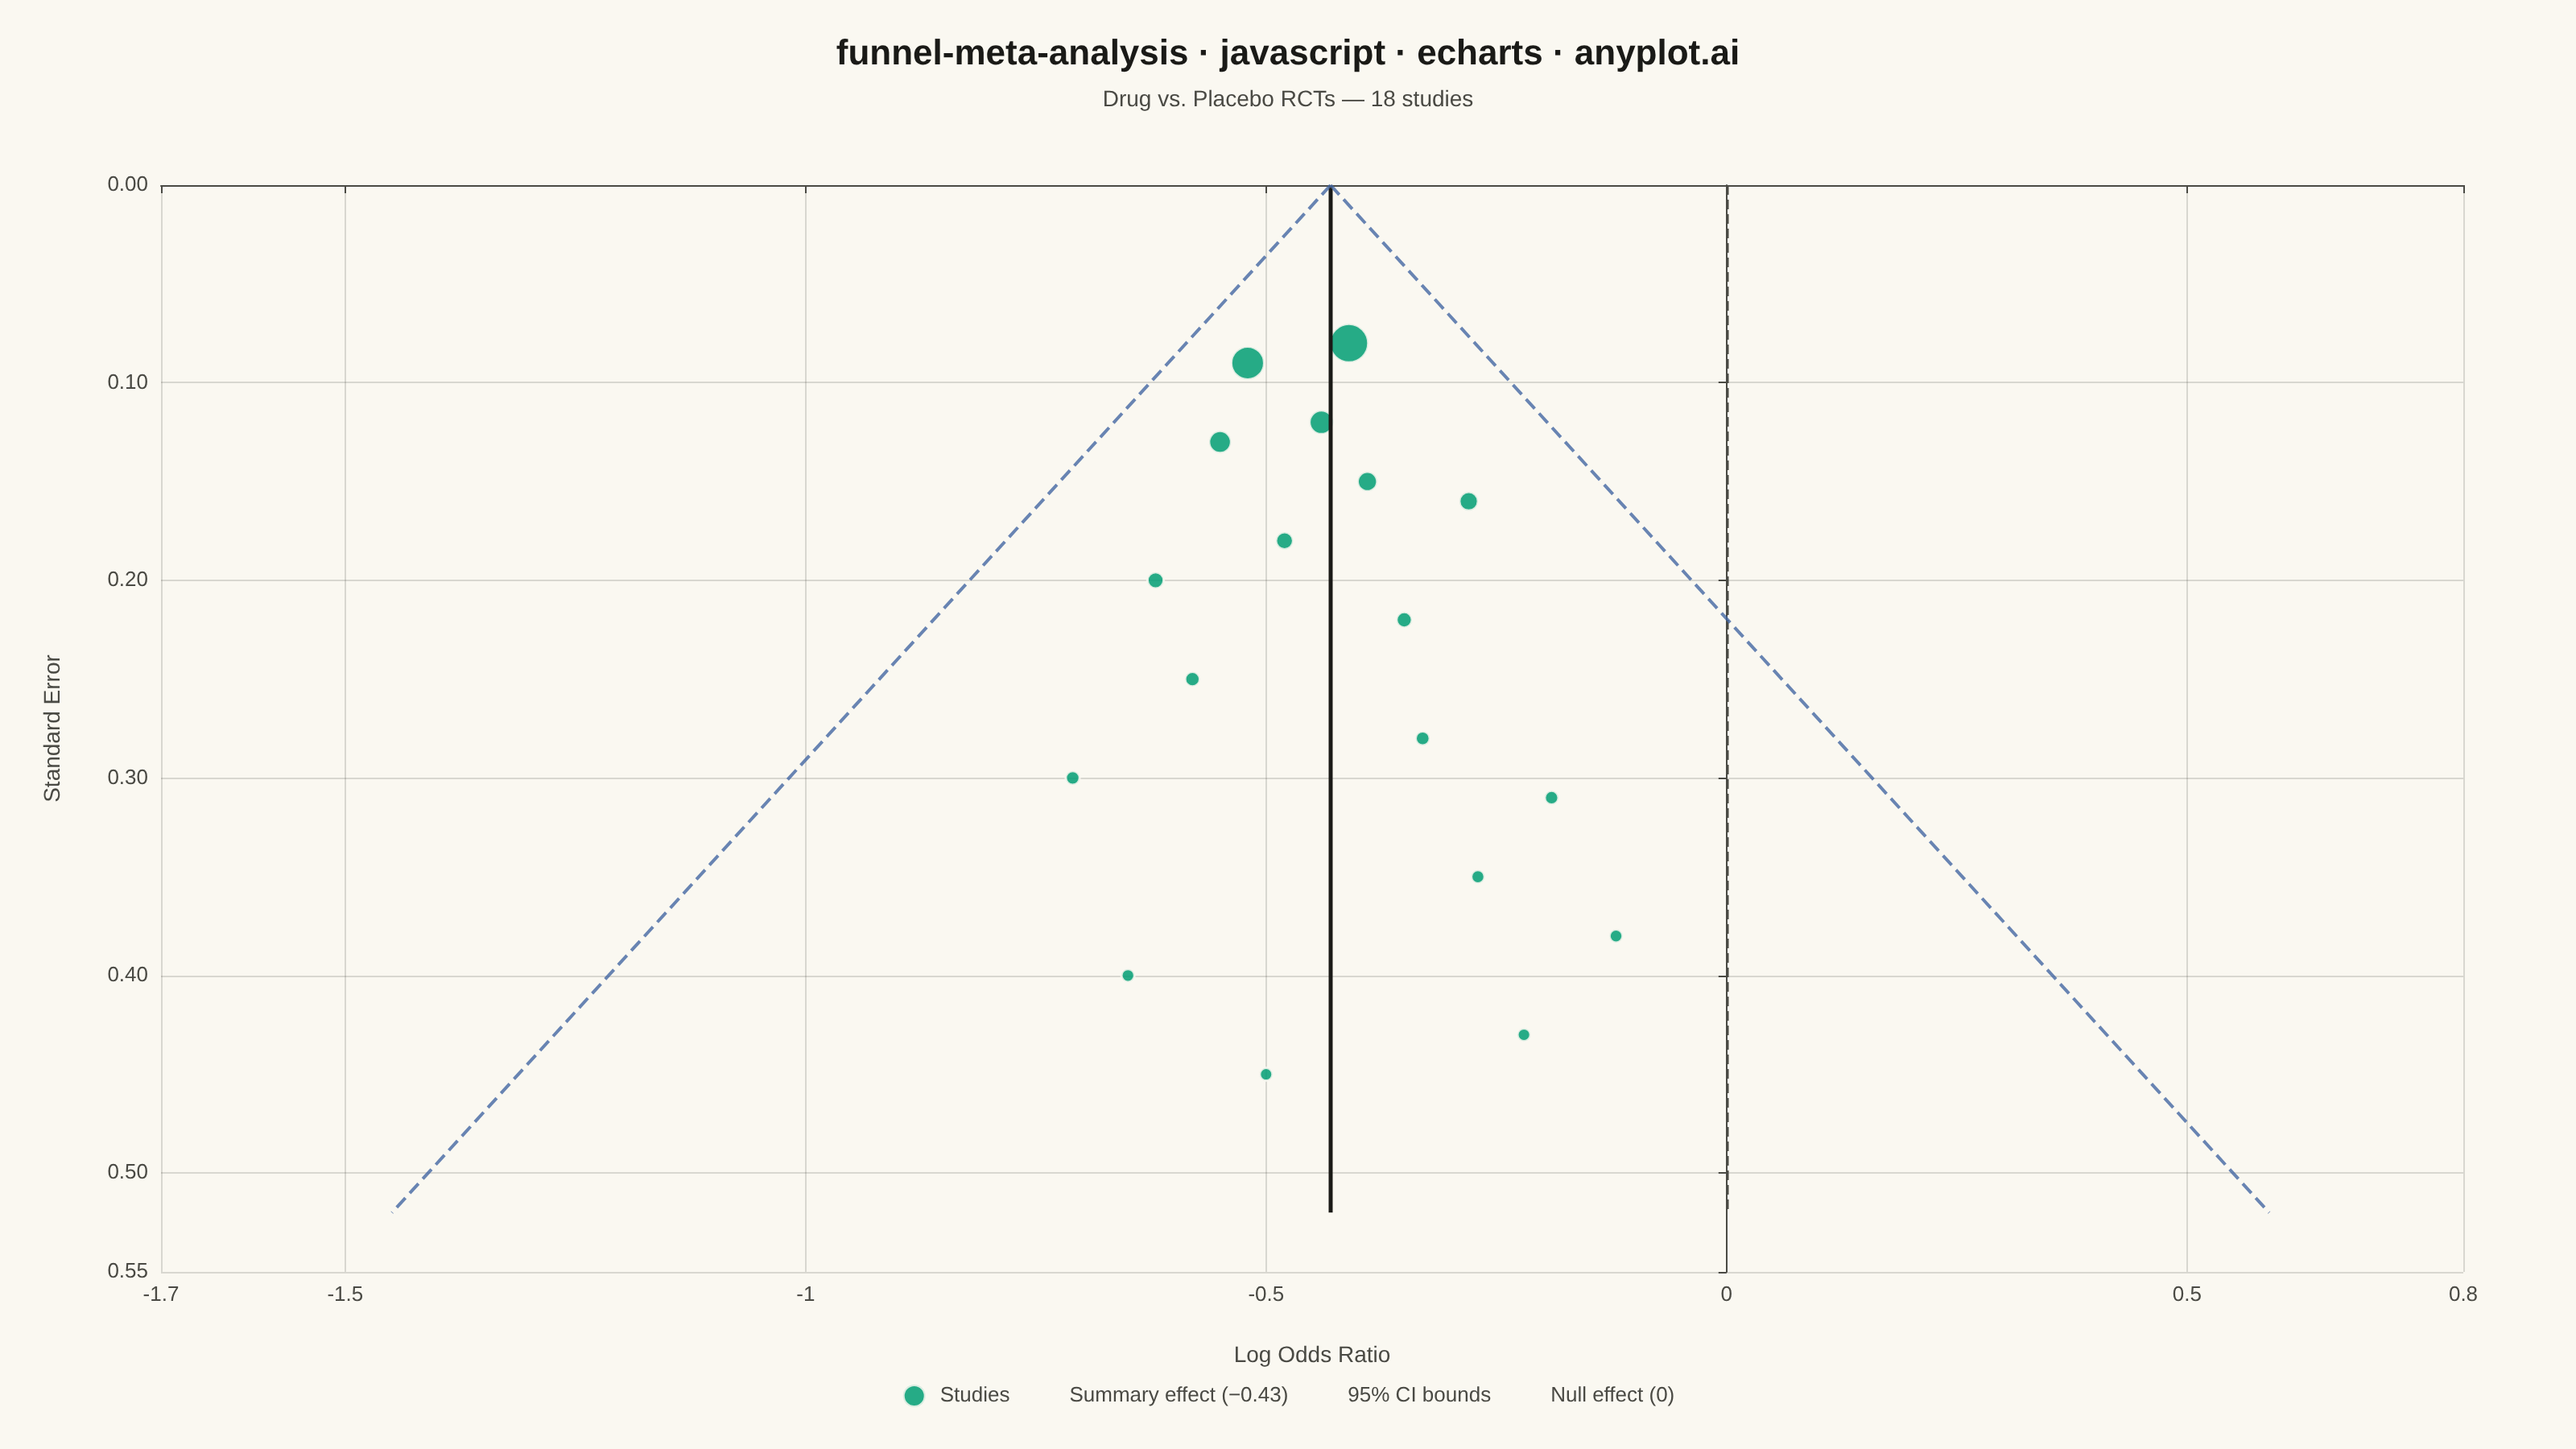
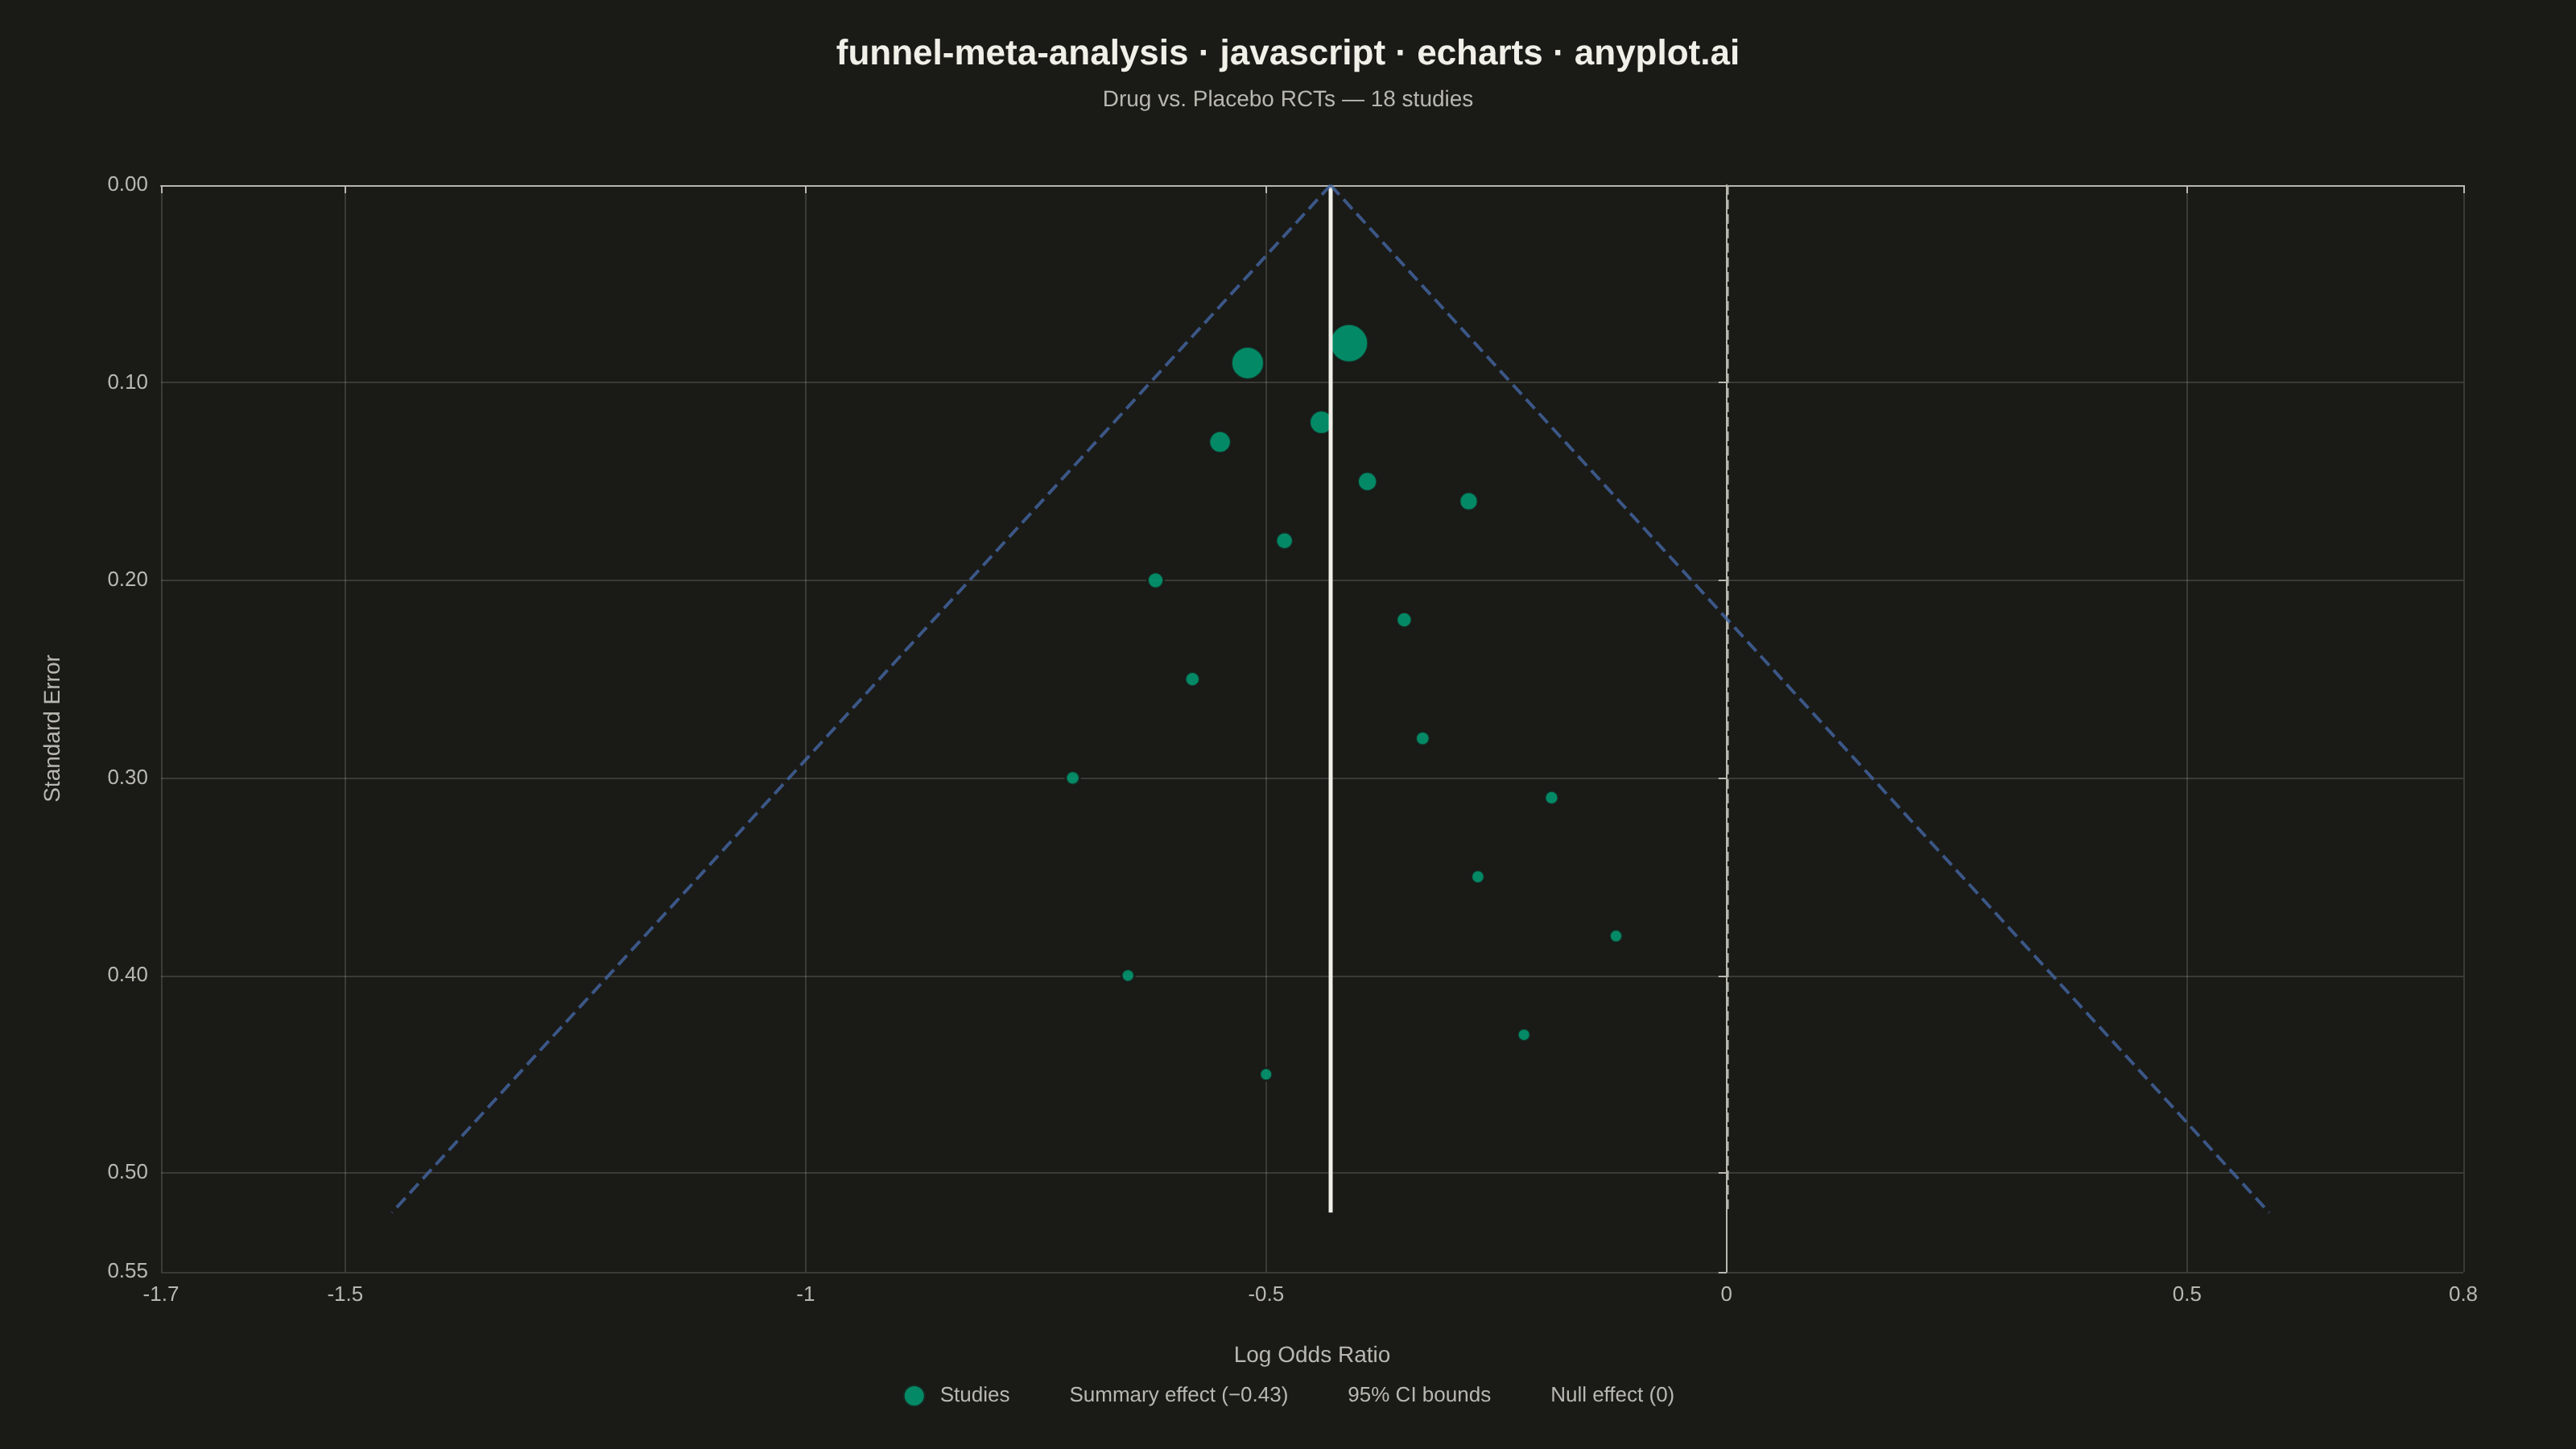
A funnel plot used in meta-analysis to assess publication bias by plotting individual study effect sizes against their precision (typically standard error). Studies scatter around a summary effect line, with pseudo 95% confidence limits forming an inverted funnel shape. In the absence of bias, studies distribute symmetrically around the summary effect; asymmetry suggests publication bias or systematic heterogeneity. This is a standard tool in systematic reviews and Cochrane-style meta-analyses.
// anyplot.ai
// funnel-meta-analysis: Meta-Analysis Funnel Plot for Publication Bias
// Library: echarts 5.5.1 | JavaScript 22.22.3
// Quality: 90/100 | Created: 2026-06-10
//# anyplot-orientation: landscape

const t = window.ANYPLOT_TOKENS;

// --- Data -------------------------------------------------------------------
// 18 RCTs comparing drug vs. placebo: log odds ratios and standard errors
const studyData = [
  [-0.41, 0.08], [-0.52, 0.09], [-0.44, 0.12], [-0.55, 0.13],
  [-0.39, 0.15], [-0.28, 0.16], [-0.48, 0.18], [-0.62, 0.20],
  [-0.35, 0.22], [-0.58, 0.25], [-0.33, 0.28], [-0.71, 0.30],
  [-0.19, 0.31], [-0.27, 0.35], [-0.12, 0.38], [-0.65, 0.40],
  [-0.22, 0.43], [-0.50, 0.45],
];

const summaryEffect = -0.43;
const maxSE = 0.52;
const boundLeft  = summaryEffect - 1.96 * maxSE;  // ≈ −1.449
const boundRight = summaryEffect + 1.96 * maxSE;  // ≈  0.589

// Precision weights for symbol sizing (inverse variance)
const weights = studyData.map(([, se]) => 1 / (se * se));
const wMin = Math.min(...weights);
const wMax = Math.max(...weights);

// --- Init -------------------------------------------------------------------
const chart = echarts.init(document.getElementById("container"));

// --- Option -----------------------------------------------------------------
chart.setOption({
  animation: false,
  color: t.palette,
  backgroundColor: "transparent",

  title: {
    text: "funnel-meta-analysis · javascript · echarts · anyplot.ai",
    subtext: "Drug vs. Placebo RCTs — 18 studies",
    left: "center",
    top: 18,
    textStyle: { color: t.ink, fontSize: 22, fontWeight: "bold" },
    subtextStyle: { color: t.inkSoft, fontSize: 14 },
  },

  legend: {
    data: [
      { name: "Studies",               icon: "circle" },
      { name: "Summary effect (−0.43)", icon: "line"  },
      { name: "95% CI bounds",          icon: "line"  },
      { name: "Null effect (0)",         icon: "line"  },
    ],
    bottom: 20,
    left: "center",
    itemWidth: 22,
    itemHeight: 14,
    textStyle: { color: t.inkSoft, fontSize: 13 },
  },

  tooltip: {
    trigger: "item",
    backgroundColor: t.elevatedBg,
    borderColor: t.inkSoft,
    textStyle: { color: t.ink, fontSize: 13 },
    formatter: params => {
      if (params.seriesName !== "Studies") return "";
      const [es, se] = params.data;
      return `Study ${params.dataIndex + 1}<br/>LOR: ${es.toFixed(3)}<br/>SE: ${se.toFixed(3)}`;
    },
  },

  grid: { left: 100, right: 70, top: 115, bottom: 110 },

  xAxis: {
    type: "value",
    name: "Log Odds Ratio",
    nameLocation: "center",
    nameGap: 45,
    nameTextStyle: { color: t.inkSoft, fontSize: 14 },
    min: -1.7,
    max: 0.8,
    axisLabel: { color: t.inkSoft, fontSize: 13 },
    axisLine:  { lineStyle: { color: t.inkSoft } },
    axisTick:  { lineStyle: { color: t.inkSoft } },
    splitLine: { lineStyle: { color: t.grid } },
  },

  yAxis: {
    type: "value",
    name: "Standard Error",
    nameLocation: "center",
    nameGap: 60,
    nameTextStyle: { color: t.inkSoft, fontSize: 14 },
    inverse: true,
    min: 0,
    max: 0.55,
    axisLabel: {
      color: t.inkSoft,
      fontSize: 13,
      formatter: val => val.toFixed(2),
    },
    axisLine:  { lineStyle: { color: t.inkSoft } },
    axisTick:  { lineStyle: { color: t.inkSoft } },
    splitLine: { lineStyle: { color: t.grid } },
  },

  series: [
    {
      name: "Studies",
      type: "scatter",
      data: studyData,
      symbolSize: data => {
        const w = 1 / (data[1] * data[1]);
        return 8 + ((w - wMin) / (wMax - wMin)) * 16;
      },
      itemStyle: {
        color: t.palette[0],
        opacity: 0.85,
        borderColor: t.pageBg,
        borderWidth: 1.5,
      },
      markLine: {
        silent: true,
        symbol: ["none", "none"],
        label: { show: false },
        data: [
          // Null effect reference (LOR = 0)
          [
            { coord: [0, 0],             lineStyle: { color: t.inkSoft, type: "dashed", width: 1.5 } },
            { coord: [0, maxSE] },
          ],
          // Summary effect (LOR = −0.43)
          [
            { coord: [summaryEffect, 0],     lineStyle: { color: t.ink, type: "solid", width: 2.5 } },
            { coord: [summaryEffect, maxSE] },
          ],
          // Left funnel boundary (pseudo 95% CI)
          [
            { coord: [summaryEffect, 0],  lineStyle: { color: t.palette[2], type: "dashed", width: 2, opacity: 0.8 } },
            { coord: [boundLeft,  maxSE] },
          ],
          // Right funnel boundary (pseudo 95% CI)
          [
            { coord: [summaryEffect, 0],  lineStyle: { color: t.palette[2], type: "dashed", width: 2, opacity: 0.8 } },
            { coord: [boundRight, maxSE] },
          ],
        ],
      },
    },
    // Dummy series used only for legend icons
    {
      name: "Summary effect (−0.43)",
      type: "line",
      data: [],
      lineStyle: { color: t.ink, type: "solid", width: 2.5 },
      symbolSize: 0,
      legendHoverLink: false,
    },
    {
      name: "95% CI bounds",
      type: "line",
      data: [],
      lineStyle: { color: t.palette[2], type: "dashed", width: 2 },
      symbolSize: 0,
      legendHoverLink: false,
    },
    {
      name: "Null effect (0)",
      type: "line",
      data: [],
      lineStyle: { color: t.inkSoft, type: "dashed", width: 1.5 },
      symbolSize: 0,
      legendHoverLink: false,
    },
  ],
});
Runnable source as JSON, for any HTTP client: https://api.anyplot.ai/specs/funnel-meta-analysis/echarts/code. Any spec id and library id listed in llms-full.txt fit the same URL shape; every URL below is complete and callable.
{
  "spec_id": "funnel-meta-analysis",
  "language": "javascript",
  "library": "echarts",
  "page": "https://anyplot.ai/funnel-meta-analysis/javascript/echarts",
  "hub": "https://anyplot.ai/funnel-meta-analysis",
  "code_json": "https://api.anyplot.ai/specs/funnel-meta-analysis/echarts/code",
  "spec_json": "https://api.anyplot.ai/specs/funnel-meta-analysis",
  "render_light_png": "https://storage.googleapis.com/anyplot-images/plots/funnel-meta-analysis/javascript/echarts/plot-light.png",
  "render_dark_png": "https://storage.googleapis.com/anyplot-images/plots/funnel-meta-analysis/javascript/echarts/plot-dark.png",
  "interactive_light_html": "https://storage.googleapis.com/anyplot-images/plots/funnel-meta-analysis/javascript/echarts/plot-light.html",
  "interactive_dark_html": "https://storage.googleapis.com/anyplot-images/plots/funnel-meta-analysis/javascript/echarts/plot-dark.html",
  "quality_score": 90.0,
  "license": "MIT",
  "guide": "https://anyplot.ai/llms.txt"
}
Part of Meta-Analysis Funnel Plot for Publication Bias on anyplot.ai.