The same plot in 14 other libraries — JavaScript: Chart.js, Apache ECharts, Highcharts, MUI X Charts; Python: Altair, Bokeh, lets-plot, Matplotlib, Plotly, plotnine, Pygal, Seaborn; R: ggplot2; Julia: Makie.jl. Compare all 15 side by side: Meta-Analysis Funnel Plot for Publication Bias in Python, R, Julia and JavaScript.
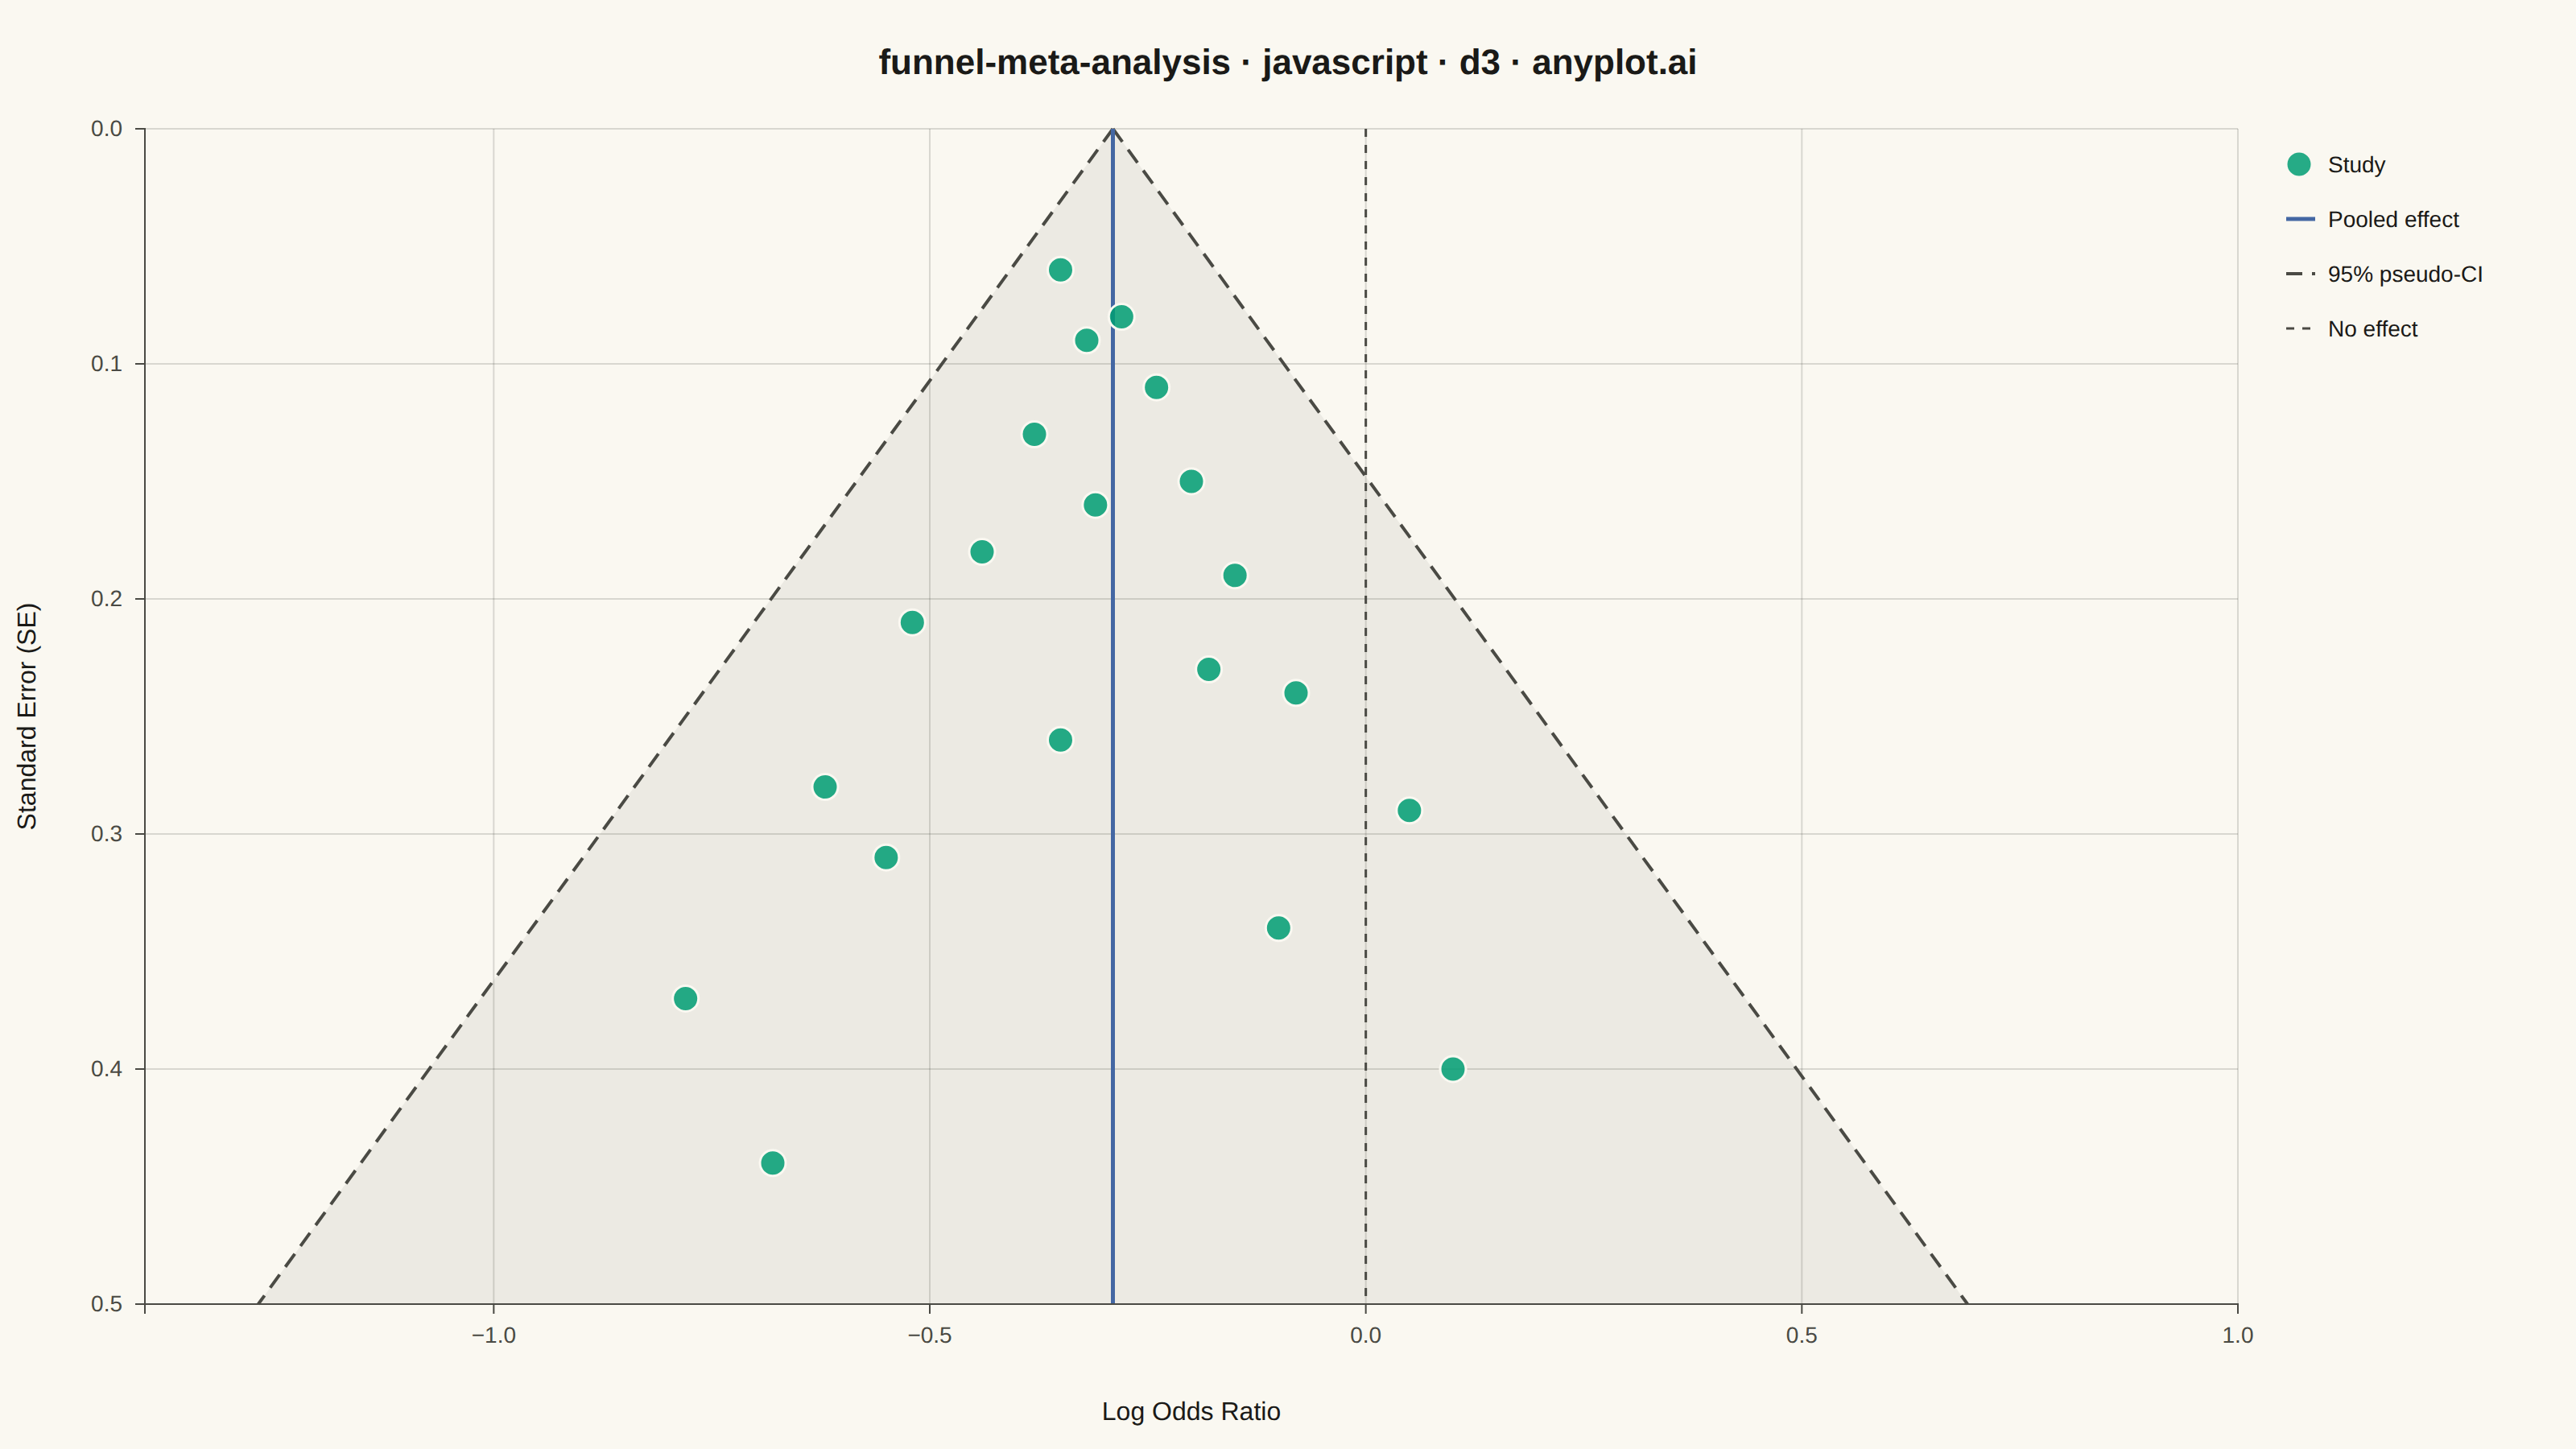
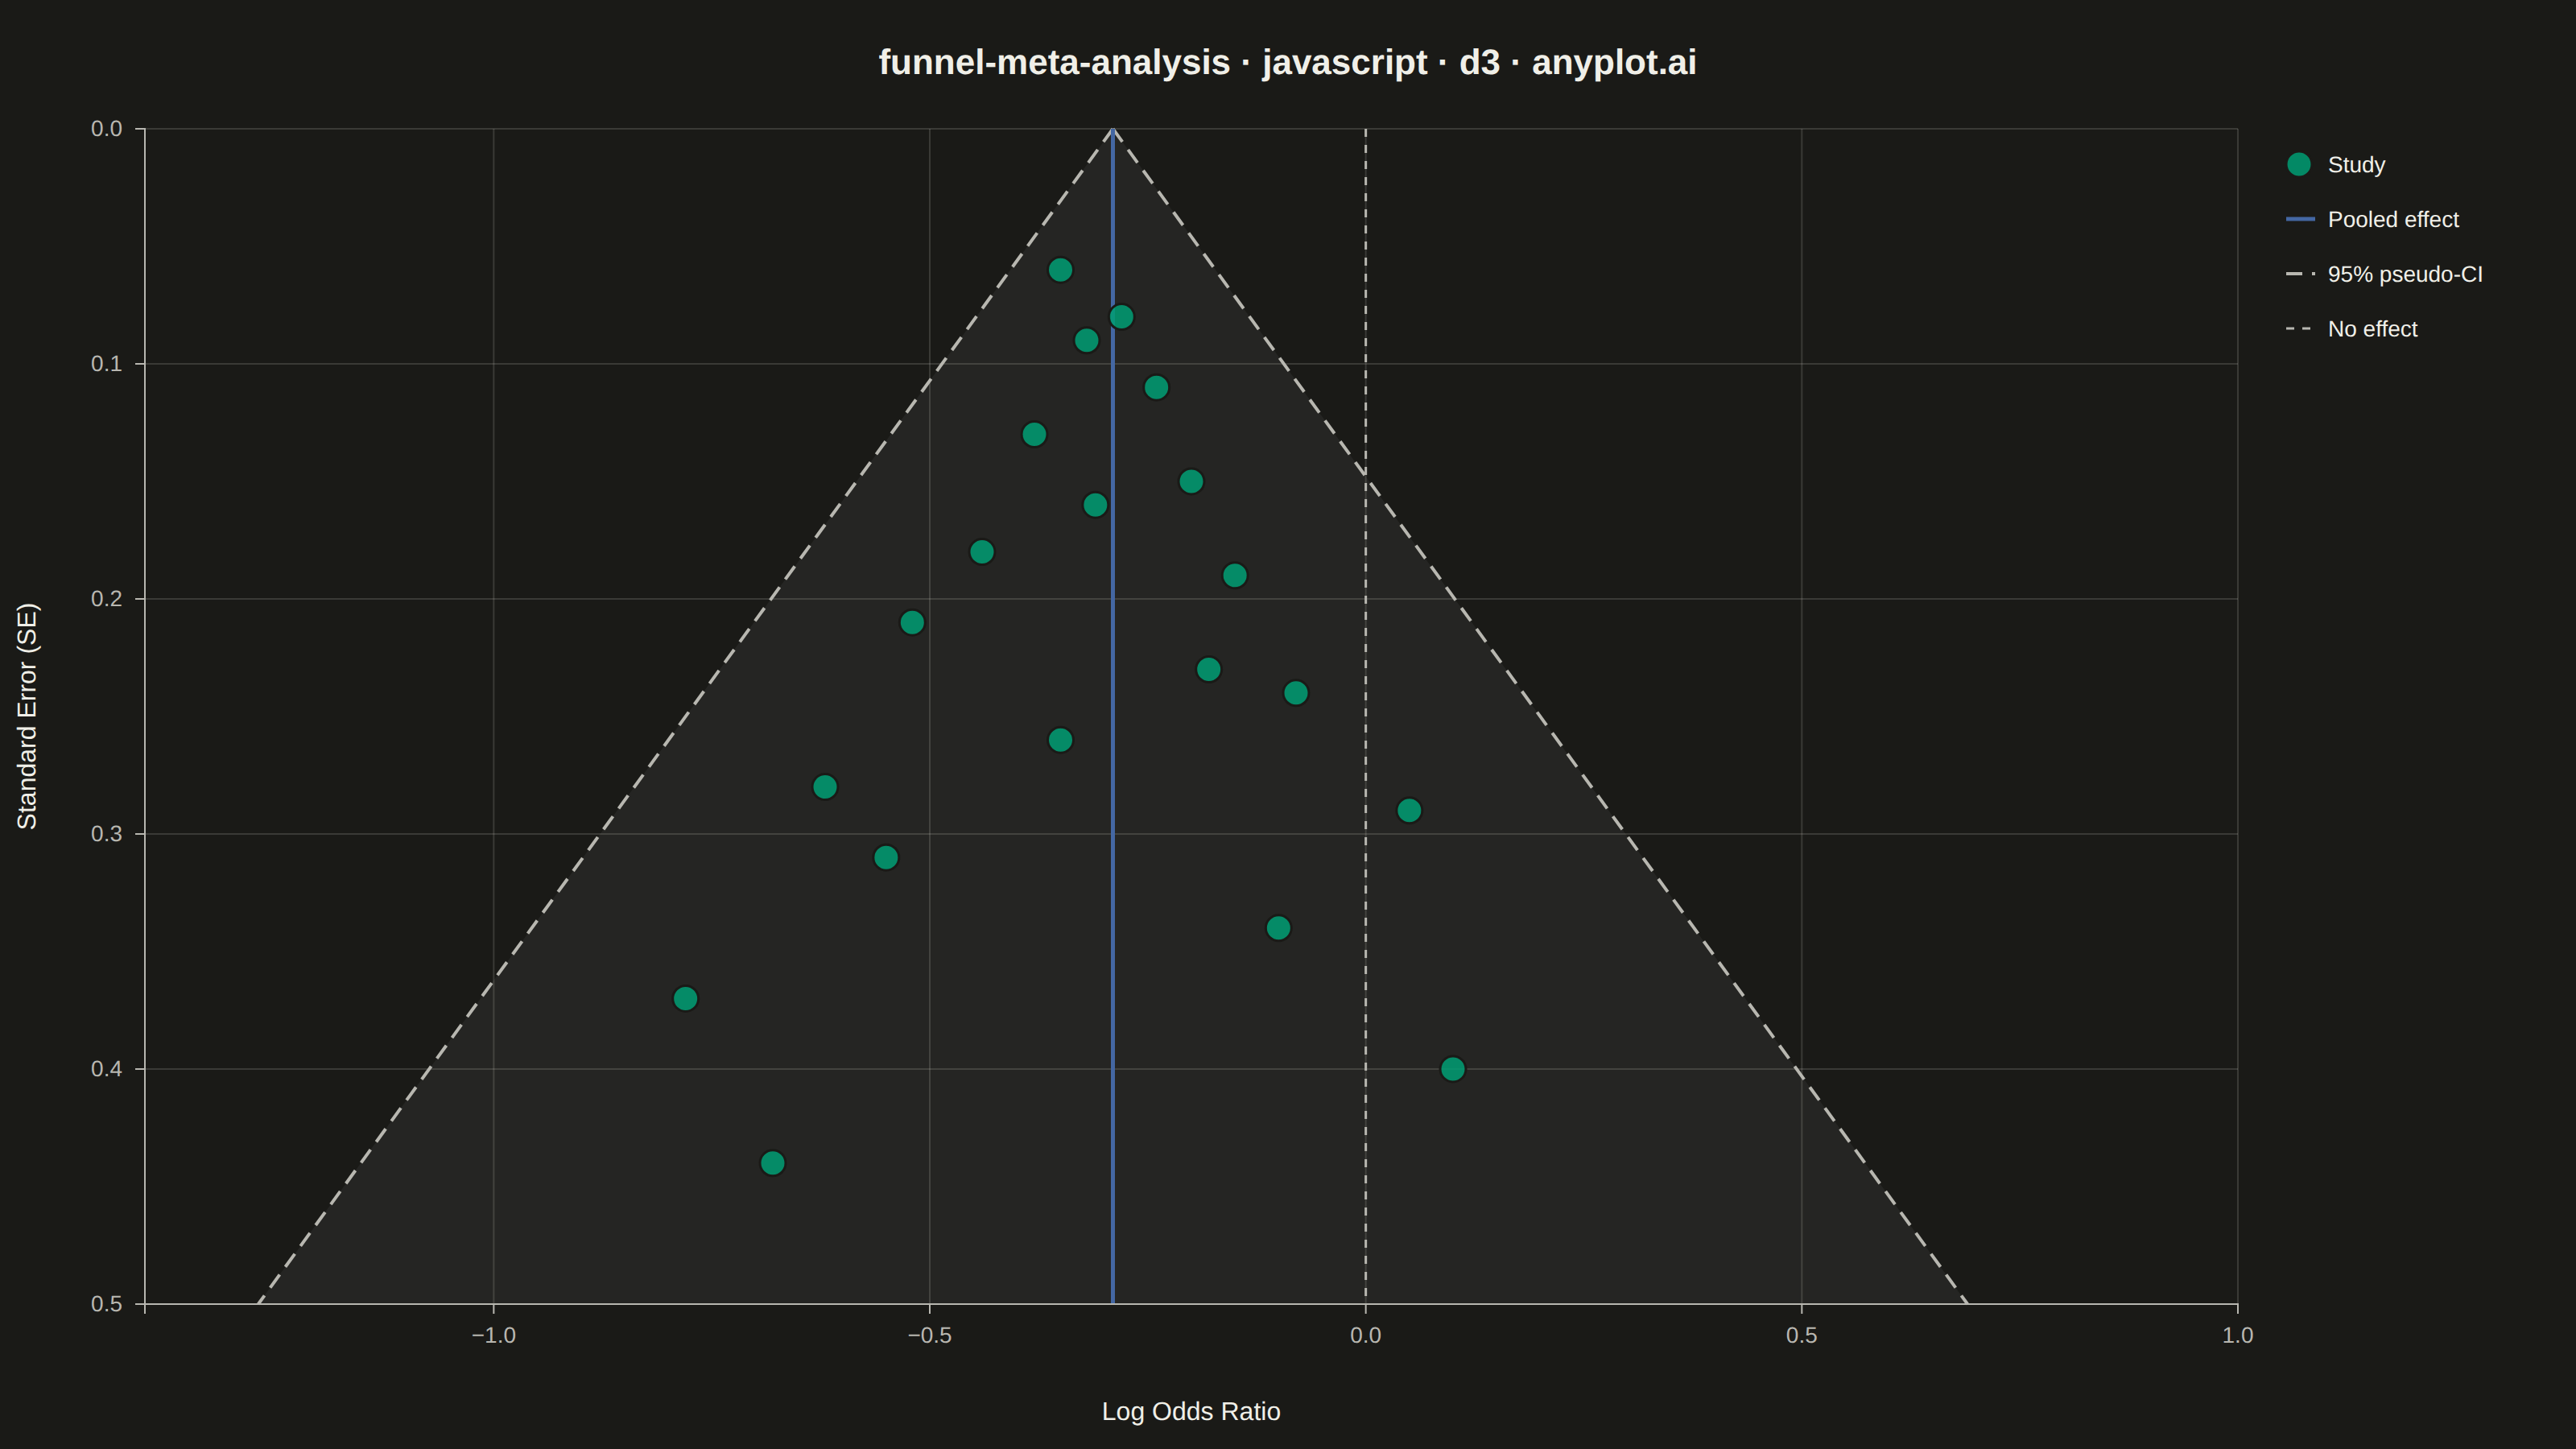
A funnel plot used in meta-analysis to assess publication bias by plotting individual study effect sizes against their precision (typically standard error). Studies scatter around a summary effect line, with pseudo 95% confidence limits forming an inverted funnel shape. In the absence of bias, studies distribute symmetrically around the summary effect; asymmetry suggests publication bias or systematic heterogeneity. This is a standard tool in systematic reviews and Cochrane-style meta-analyses.
// anyplot.ai
// funnel-meta-analysis: Meta-Analysis Funnel Plot for Publication Bias
// Library: d3 7.9.0 | JavaScript 22.22.3
// Quality: 91/100 | Created: 2026-06-10
//# anyplot-orientation: landscape

const t = window.ANYPLOT_TOKENS;
const { width, height } = window.ANYPLOT_SIZE;
const margin = { top: 80, right: 210, bottom: 90, left: 90 };
const iw = width - margin.left - margin.right;
const ih = height - margin.top - margin.bottom;

// --- Data (drug vs placebo RCT meta-analysis, 20 studies, deterministic) ---
const summaryEffect = -0.29;
const nullEffect = 0;
const maxSE = 0.50;

const studies = [
  { se: 0.06, logOR: -0.35 },
  { se: 0.08, logOR: -0.28 },
  { se: 0.09, logOR: -0.32 },
  { se: 0.11, logOR: -0.24 },
  { se: 0.13, logOR: -0.38 },
  { se: 0.15, logOR: -0.20 },
  { se: 0.16, logOR: -0.31 },
  { se: 0.18, logOR: -0.44 },
  { se: 0.19, logOR: -0.15 },
  { se: 0.21, logOR: -0.52 },
  { se: 0.23, logOR: -0.18 },
  { se: 0.24, logOR: -0.08 },
  { se: 0.26, logOR: -0.35 },
  { se: 0.28, logOR: -0.62 },
  { se: 0.29, logOR:  0.05 },
  { se: 0.31, logOR: -0.55 },
  { se: 0.34, logOR: -0.10 },
  { se: 0.37, logOR: -0.78 },
  { se: 0.40, logOR:  0.10 },
  { se: 0.44, logOR: -0.68 },
];

// --- SVG mount ---
const svg = d3.select("#container")
  .append("svg")
  .attr("width", width)
  .attr("height", height);

const g = svg.append("g")
  .attr("transform", `translate(${margin.left},${margin.top})`);

// --- Scales ---
const funnelHalfWidth = 1.96 * maxSE;
const x = d3.scaleLinear()
  .domain([summaryEffect - funnelHalfWidth - 0.12, summaryEffect + funnelHalfWidth + 0.12])
  .range([0, iw])
  .nice();
const y = d3.scaleLinear()
  .domain([0, maxSE])
  .range([0, ih]);

// --- Gridlines ---
g.selectAll(".hgrid")
  .data(y.ticks(5))
  .join("line").attr("class", "hgrid")
  .attr("x1", 0).attr("x2", iw)
  .attr("y1", d => y(d)).attr("y2", d => y(d))
  .attr("stroke", t.grid).attr("stroke-width", 1);

g.selectAll(".vgrid")
  .data(x.ticks(6))
  .join("line").attr("class", "vgrid")
  .attr("x1", d => x(d)).attr("x2", d => x(d))
  .attr("y1", 0).attr("y2", ih)
  .attr("stroke", t.grid).attr("stroke-width", 1);

// --- Funnel pseudo-95%-CI region ---
const apexX = x(summaryEffect);
const apexY = y(0);
const baseY = y(maxSE);
const baseLeftX = x(summaryEffect - funnelHalfWidth);
const baseRightX = x(summaryEffect + funnelHalfWidth);

g.append("polygon")
  .attr("points", `${apexX},${apexY} ${baseLeftX},${baseY} ${baseRightX},${baseY}`)
  .attr("fill", t.inkSoft)
  .attr("fill-opacity", 0.08);

g.append("line")
  .attr("x1", apexX).attr("y1", apexY)
  .attr("x2", baseLeftX).attr("y2", baseY)
  .attr("stroke", t.inkSoft).attr("stroke-width", 2)
  .attr("stroke-dasharray", "10,6");

g.append("line")
  .attr("x1", apexX).attr("y1", apexY)
  .attr("x2", baseRightX).attr("y2", baseY)
  .attr("stroke", t.inkSoft).attr("stroke-width", 2)
  .attr("stroke-dasharray", "10,6");

// --- Null effect vertical reference line ---
g.append("line")
  .attr("x1", x(nullEffect)).attr("x2", x(nullEffect))
  .attr("y1", 0).attr("y2", ih)
  .attr("stroke", t.inkSoft).attr("stroke-width", 1.5)
  .attr("stroke-dasharray", "5,5");

// --- Pooled effect vertical line ---
g.append("line")
  .attr("x1", x(summaryEffect)).attr("x2", x(summaryEffect))
  .attr("y1", 0).attr("y2", ih)
  .attr("stroke", t.palette[2]).attr("stroke-width", 2.5);

// --- Study points ---
g.selectAll(".study")
  .data(studies)
  .join("circle").attr("class", "study")
  .attr("cx", d => x(d.logOR))
  .attr("cy", d => y(d.se))
  .attr("r", 8)
  .attr("fill", t.palette[0]).attr("fill-opacity", 0.85)
  .attr("stroke", t.pageBg).attr("stroke-width", 1.5);

// --- X axis ---
const xAxis = g.append("g")
  .attr("transform", `translate(0,${ih})`)
  .call(d3.axisBottom(x).ticks(6).tickSize(6).tickPadding(8));

xAxis.select(".domain").attr("stroke", t.inkSoft);
xAxis.selectAll(".tick line").attr("stroke", t.inkSoft);
xAxis.selectAll(".tick text").attr("fill", t.inkSoft).style("font-size", "14px");

// --- Y axis ---
const yAxis = g.append("g")
  .call(d3.axisLeft(y).ticks(5).tickSize(6).tickPadding(8));

yAxis.select(".domain").attr("stroke", t.inkSoft);
yAxis.selectAll(".tick line").attr("stroke", t.inkSoft);
yAxis.selectAll(".tick text").attr("fill", t.inkSoft).style("font-size", "14px");

// --- Axis labels ---
svg.append("text")
  .attr("x", margin.left + iw / 2)
  .attr("y", height - 18)
  .attr("text-anchor", "middle")
  .attr("fill", t.ink).style("font-size", "16px")
  .text("Log Odds Ratio");

svg.append("text")
  .attr("transform", `translate(22,${margin.top + ih / 2}) rotate(-90)`)
  .attr("text-anchor", "middle")
  .attr("fill", t.ink).style("font-size", "16px")
  .text("Standard Error (SE)");

// --- Legend ---
const legendItems = [
  { y: 0,  symbol: "circle", color: t.palette[0], dash: null,   sw: 2.5, label: "Study" },
  { y: 34, symbol: "line",   color: t.palette[2], dash: null,   sw: 2.5, label: "Pooled effect" },
  { y: 68, symbol: "line",   color: t.inkSoft,    dash: "10,6", sw: 2,   label: "95% pseudo-CI" },
  { y: 102, symbol: "line",  color: t.inkSoft,    dash: "5,5",  sw: 1.5, label: "No effect" },
];

const legend = svg.append("g")
  .attr("transform", `translate(${margin.left + iw + 30},${margin.top + 20})`);

legendItems.forEach(item => {
  if (item.symbol === "circle") {
    legend.append("circle")
      .attr("cx", 8).attr("cy", item.y + 2)
      .attr("r", 8)
      .attr("fill", item.color).attr("fill-opacity", 0.85)
      .attr("stroke", t.pageBg).attr("stroke-width", 1.5);
  } else {
    const ln = legend.append("line")
      .attr("x1", 0).attr("x2", 18)
      .attr("y1", item.y + 2).attr("y2", item.y + 2)
      .attr("stroke", item.color)
      .attr("stroke-width", item.sw);
    if (item.dash) ln.attr("stroke-dasharray", item.dash);
  }
  legend.append("text")
    .attr("x", 26).attr("y", item.y + 7)
    .attr("fill", t.ink).style("font-size", "14px")
    .text(item.label);
});

// --- Title ---
svg.append("text")
  .attr("x", width / 2).attr("y", 46)
  .attr("text-anchor", "middle")
  .attr("fill", t.ink)
  .style("font-size", "22px").style("font-weight", "600")
  .text("funnel-meta-analysis · javascript · d3 · anyplot.ai");
Runnable source as JSON, for any HTTP client: https://api.anyplot.ai/specs/funnel-meta-analysis/d3/code. Any spec id and library id listed in llms-full.txt fit the same URL shape; every URL below is complete and callable.
{
  "spec_id": "funnel-meta-analysis",
  "language": "javascript",
  "library": "d3",
  "page": "https://anyplot.ai/funnel-meta-analysis/javascript/d3",
  "hub": "https://anyplot.ai/funnel-meta-analysis",
  "code_json": "https://api.anyplot.ai/specs/funnel-meta-analysis/d3/code",
  "spec_json": "https://api.anyplot.ai/specs/funnel-meta-analysis",
  "render_light_png": "https://storage.googleapis.com/anyplot-images/plots/funnel-meta-analysis/javascript/d3/plot-light.png",
  "render_dark_png": "https://storage.googleapis.com/anyplot-images/plots/funnel-meta-analysis/javascript/d3/plot-dark.png",
  "interactive_light_html": "https://storage.googleapis.com/anyplot-images/plots/funnel-meta-analysis/javascript/d3/plot-light.html",
  "interactive_dark_html": "https://storage.googleapis.com/anyplot-images/plots/funnel-meta-analysis/javascript/d3/plot-dark.html",
  "quality_score": 91.0,
  "license": "MIT",
  "guide": "https://anyplot.ai/llms.txt"
}
Part of Meta-Analysis Funnel Plot for Publication Bias on anyplot.ai.