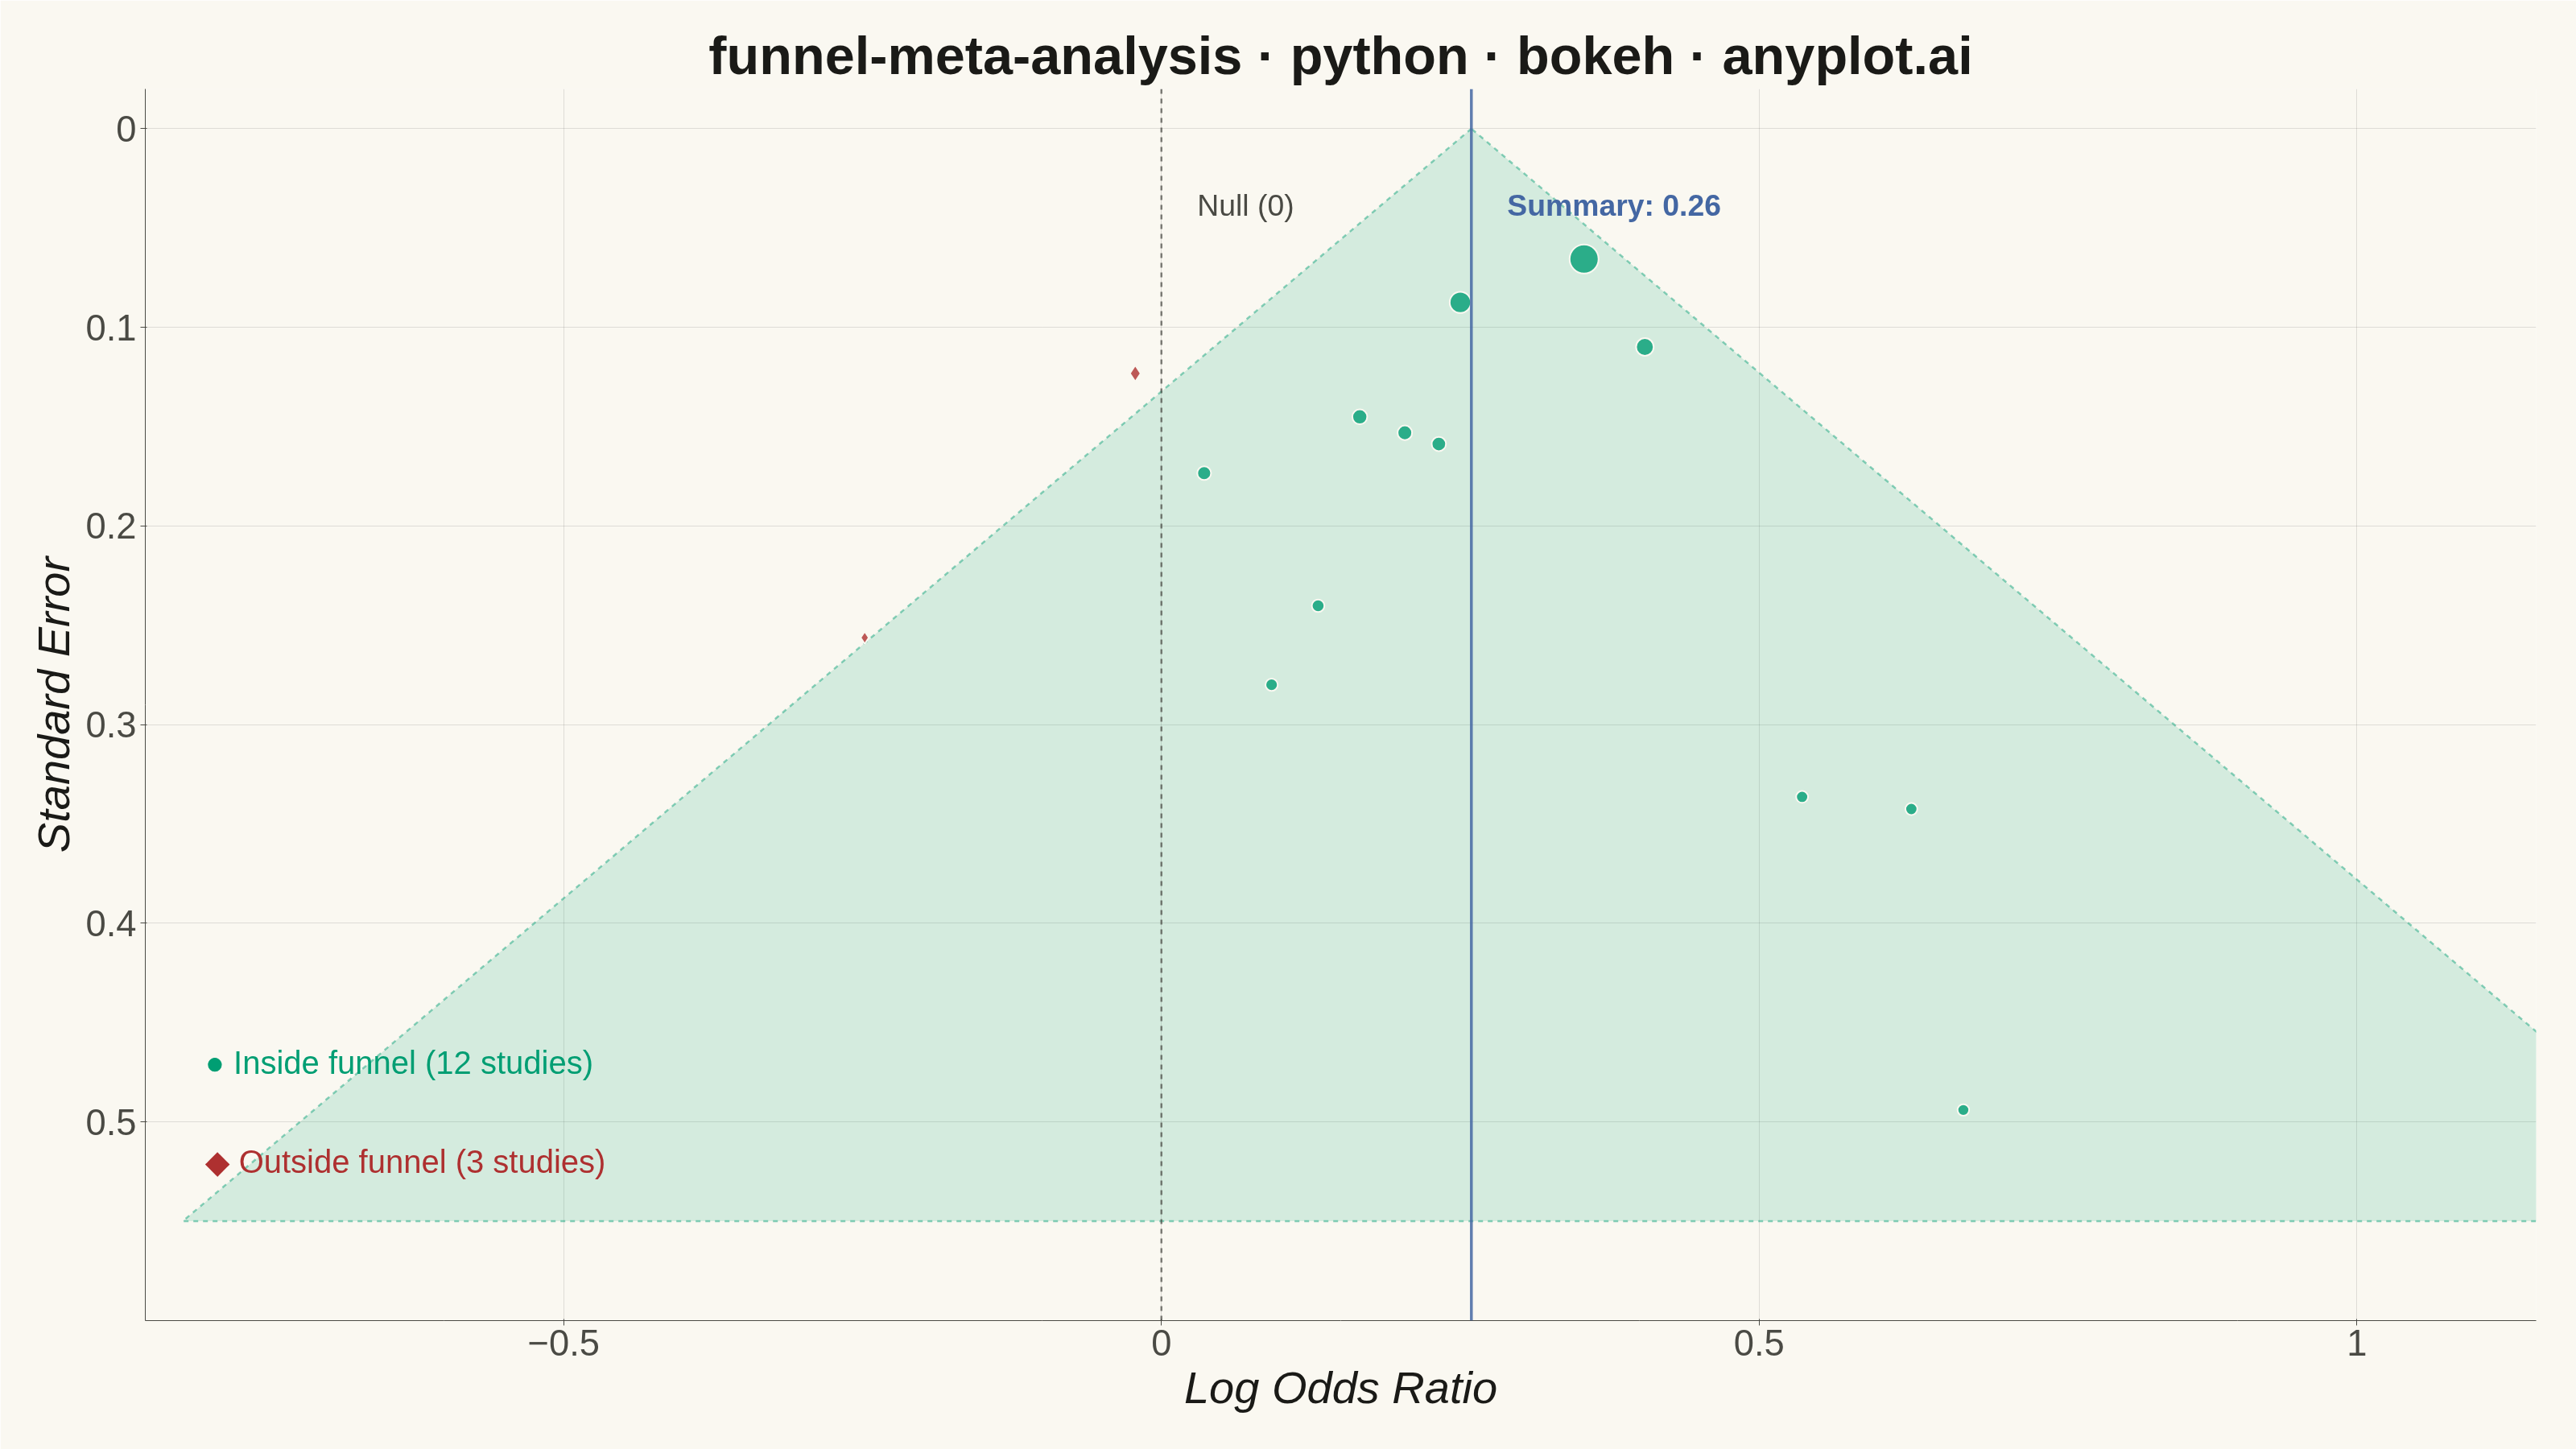
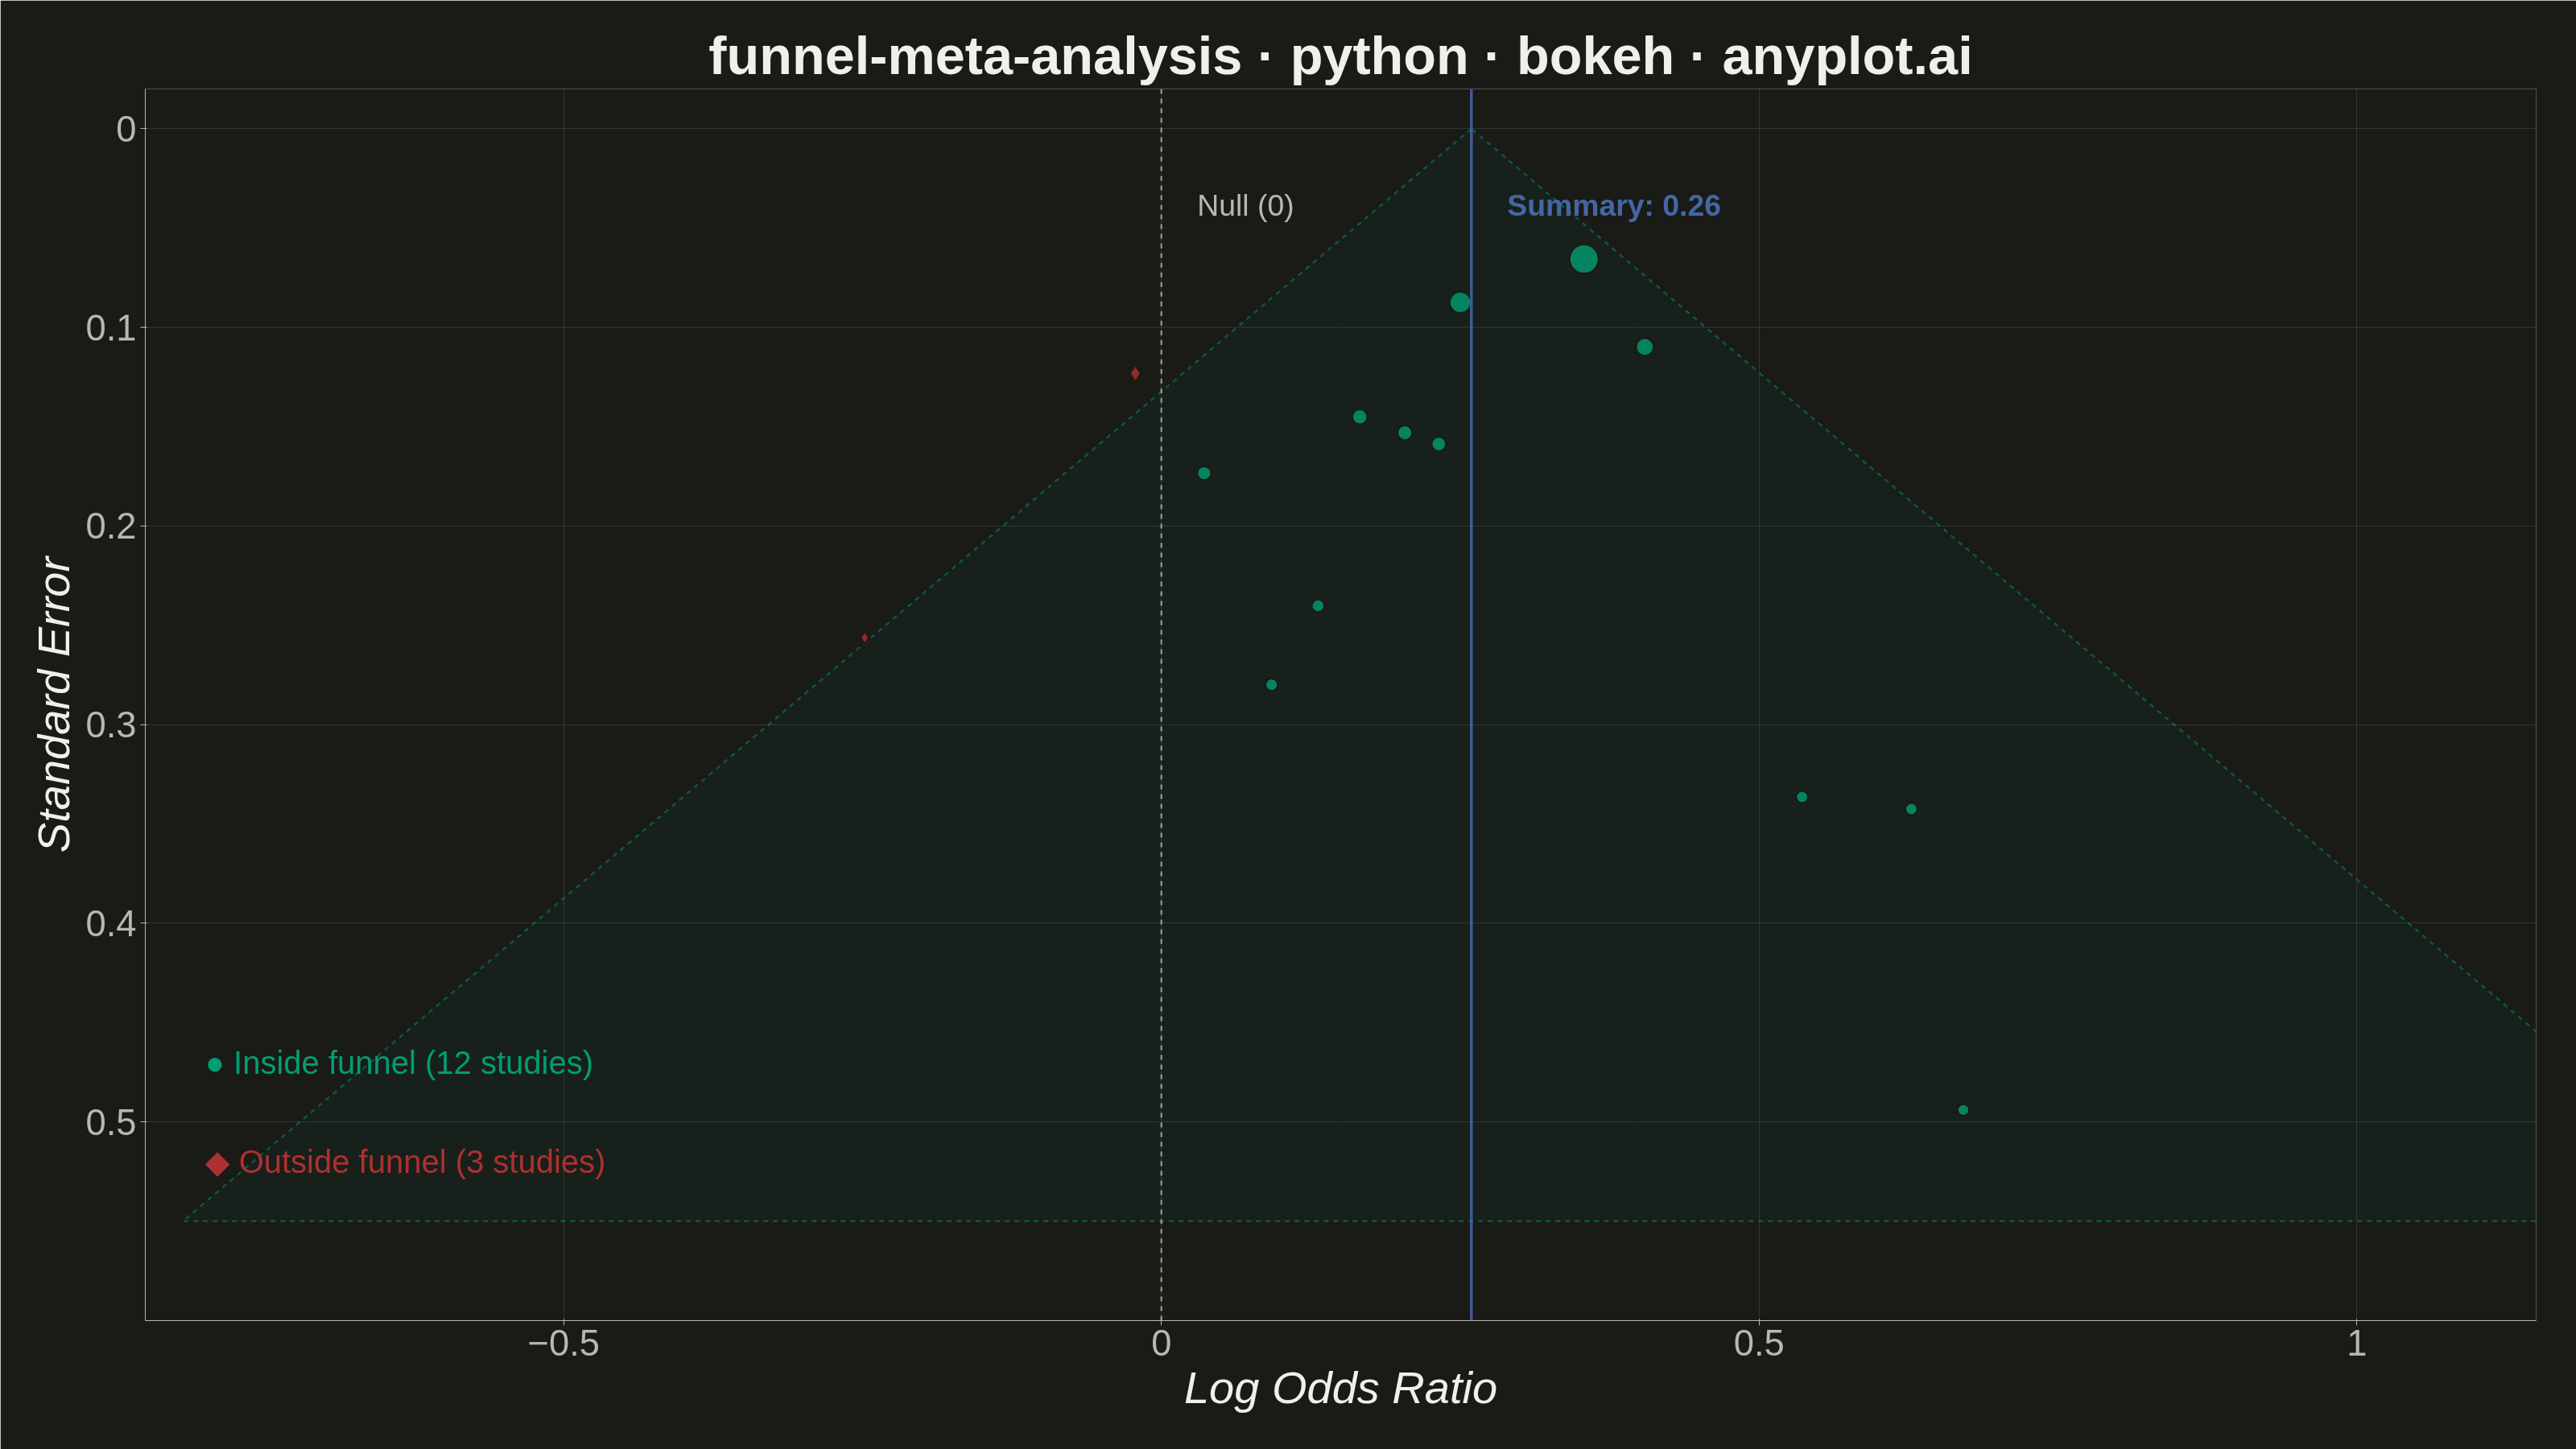
A funnel plot used in meta-analysis to assess publication bias by plotting individual study effect sizes against their precision (typically standard error). Studies scatter around a summary effect line, with pseudo 95% confidence limits forming an inverted funnel shape. In the absence of bias, studies distribute symmetrically around the summary effect; asymmetry suggests publication bias or systematic heterogeneity. This is a standard tool in systematic reviews and Cochrane-style meta-analyses.
""" anyplot.ai
funnel-meta-analysis: Meta-Analysis Funnel Plot for Publication Bias
Library: bokeh 3.9.1 | Python 3.13.13
Quality: 89/100 | Updated: 2026-06-10
"""

import os
import time
from pathlib import Path

import numpy as np
from bokeh.io import output_file, save
from bokeh.models import ColumnDataSource, HoverTool, Label, Span
from bokeh.plotting import figure
from selenium import webdriver
from selenium.webdriver.chrome.options import Options


# Theme tokens — Imprint palette chrome
THEME = os.getenv("ANYPLOT_THEME", "light")
PAGE_BG = "#FAF8F1" if THEME == "light" else "#1A1A17"
ELEVATED_BG = "#FFFDF6" if THEME == "light" else "#242420"
INK = "#1A1A17" if THEME == "light" else "#F0EFE8"
INK_SOFT = "#4A4A44" if THEME == "light" else "#B8B7B0"

# Imprint categorical palette positions
BRAND = "#009E73"  # position 1 — inside funnel (first series)
BLUE = "#4467A3"  # position 3 — summary effect line
RED = "#AE3030"  # semantic anchor — outside funnel (bad/error)

# Data — Meta-analysis of 15 RCTs comparing drug vs placebo (log odds ratios)
np.random.seed(42)

n_studies = 15
true_effect = 0.3

std_errors = np.concatenate(
    [np.random.uniform(0.05, 0.15, 5), np.random.uniform(0.15, 0.30, 6), np.random.uniform(0.30, 0.50, 4)]
)

effect_sizes = true_effect + np.random.normal(0, 1, n_studies) * std_errors
# Slight positive bias for small studies (simulating publication bias)
small_study_mask = std_errors > 0.30
effect_sizes[small_study_mask] += np.random.uniform(0.05, 0.20, small_study_mask.sum())

# Summary effect (inverse-variance weighted)
weights = 1 / std_errors**2
summary_effect = np.sum(weights * effect_sizes) / np.sum(weights)

# Marker sizes proportional to study weight (inverse variance)
normalized_weights = weights / weights.max()
marker_sizes = 14 + normalized_weights * 22  # range 14–36 px (tighter to reduce crowding)

# Inside/outside funnel classification (semantic coloring + shape redundancy for CVD)
expected_lower = summary_effect - 1.96 * std_errors
expected_upper = summary_effect + 1.96 * std_errors
outside_funnel = (effect_sizes < expected_lower) | (effect_sizes > expected_upper)
marker_colors = np.where(outside_funnel, RED, BRAND)
marker_types = np.where(outside_funnel, "diamond", "circle")

# Funnel pseudo-95% confidence limits
se_range = np.linspace(0, 0.55, 100)
upper_limit = summary_effect + 1.96 * se_range
lower_limit = summary_effect - 1.96 * se_range

studies = [f"Study {i + 1}" for i in range(n_studies)]

# Plot
source = ColumnDataSource(
    data={
        "effect_size": effect_sizes,
        "std_error": std_errors,
        "study": studies,
        "weight": np.round(weights, 1),
        "marker_size": marker_sizes,
        "marker_color": marker_colors.tolist(),
        "status": ["Outside funnel" if o else "Inside funnel" for o in outside_funnel],
        "marker_type": marker_types.tolist(),
    }
)

title = "funnel-meta-analysis · python · bokeh · anyplot.ai"

p = figure(
    width=3200,
    height=1800,
    title=title,
    x_axis_label="Log Odds Ratio",
    y_axis_label="Standard Error",
    y_range=(0.60, -0.02),
    x_range=(-0.85, 1.15),
    toolbar_location=None,
    min_border_bottom=160,
    min_border_left=180,
    min_border_top=110,
    min_border_right=50,
)

# Funnel confidence region (pseudo 95% CI shaded area)
funnel_xs = np.concatenate([lower_limit, upper_limit[::-1]]).tolist()
funnel_ys = np.concatenate([se_range, se_range[::-1]]).tolist()
FUNNEL_ALPHA = 0.15 if THEME == "light" else 0.05  # lower alpha in dark avoids green-on-green contrast
p.patch(
    funnel_xs,
    funnel_ys,
    fill_color=BRAND,
    fill_alpha=FUNNEL_ALPHA,
    line_color=BRAND,
    line_alpha=0.45,
    line_width=2.5,
    line_dash="dashed",
)

# Summary effect vertical line
p.add_layout(Span(location=summary_effect, dimension="height", line_color=BLUE, line_width=3.5, line_alpha=0.85))

# Null effect line (log-OR = 0 → no effect)
p.add_layout(
    Span(location=0, dimension="height", line_color=INK_SOFT, line_width=2.5, line_dash="dashed", line_alpha=0.70)
)

# Study scatter — sized by weight, shaped by funnel status (circle=inside, diamond=outside)
scatter = p.scatter(
    x="effect_size",
    y="std_error",
    source=source,
    marker="marker_type",
    size="marker_size",
    fill_alpha=0.80,
    fill_color="marker_color",
    line_color=PAGE_BG,
    line_width=2.0,
)

# HoverTool — Bokeh's interactive feature; works in HTML artifact
hover = HoverTool(
    renderers=[scatter],
    tooltips=[
        ("Study", "@study"),
        ("Effect Size", "@effect_size{0.3f}"),
        ("Std Error", "@std_error{0.3f}"),
        ("Weight", "@weight{0.1f}"),
        ("Status", "@status"),
    ],
)
p.add_tools(hover)

# Summary effect label (top of chart, just below summary line)
p.add_layout(
    Label(
        x=summary_effect + 0.03,
        y=0.03,
        text=f"Summary: {summary_effect:.2f}",
        text_font_size="28pt",
        text_color=BLUE,
        text_font_style="bold",
        text_align="left",
        text_baseline="top",
    )
)

# Null label
p.add_layout(
    Label(
        x=0.03,
        y=0.03,
        text="Null (0)",
        text_font_size="28pt",
        text_color=INK_SOFT,
        text_font_style="normal",
        text_align="left",
        text_baseline="top",
    )
)

# Color-code legend annotations (lower-left, outside funnel region)
n_outside = int(outside_funnel.sum())
p.add_layout(
    Label(
        x=-0.80,
        y=0.47,
        text=f"● Inside funnel ({n_studies - n_outside} studies)",
        text_font_size="30pt",
        text_color=BRAND,
        text_align="left",
        text_baseline="middle",
    )
)
p.add_layout(
    Label(
        x=-0.80,
        y=0.52,
        text=f"◆ Outside funnel ({n_outside} studies)",
        text_font_size="30pt",
        text_color=RED,
        text_align="left",
        text_baseline="middle",
    )
)

# Theme-adaptive chrome
p.background_fill_color = PAGE_BG
p.border_fill_color = PAGE_BG
p.outline_line_color = None

p.title.text_color = INK
p.title.text_font_size = "50pt"
p.title.align = "center"

p.xaxis.axis_label_text_font_size = "42pt"
p.yaxis.axis_label_text_font_size = "42pt"
p.xaxis.axis_label_text_color = INK
p.yaxis.axis_label_text_color = INK

p.xaxis.major_label_text_font_size = "34pt"
p.yaxis.major_label_text_font_size = "34pt"
p.xaxis.major_label_text_color = INK_SOFT
p.yaxis.major_label_text_color = INK_SOFT

p.xaxis.axis_line_color = INK_SOFT
p.yaxis.axis_line_color = INK_SOFT
p.xaxis.major_tick_line_color = INK_SOFT
p.yaxis.major_tick_line_color = INK_SOFT
p.xaxis.minor_tick_line_color = None
p.yaxis.minor_tick_line_color = None

p.xgrid.grid_line_color = INK
p.ygrid.grid_line_color = INK
p.xgrid.grid_line_alpha = 0.12
p.ygrid.grid_line_alpha = 0.12

# Save — HTML first (interactive artifact), then PNG via headless Chrome
output_file(f"plot-{THEME}.html")
save(p)

# Use CDP setDeviceMetricsOverride so the inner viewport is authoritative:
# --window-size alone is eaten by Chrome chrome in headless mode (gives 1661 instead of 1800).
W, H = 3200, 1800
opts = Options()
for arg in (
    "--headless=new",
    "--no-sandbox",
    "--disable-dev-shm-usage",
    "--disable-gpu",
    f"--window-size={W},{H}",
    "--hide-scrollbars",
):
    opts.add_argument(arg)
driver = webdriver.Chrome(options=opts)
driver.execute_cdp_cmd(
    "Emulation.setDeviceMetricsOverride", {"width": W, "height": H, "deviceScaleFactor": 1, "mobile": False}
)
driver.get(f"file://{Path(f'plot-{THEME}.html').resolve()}")
time.sleep(3)
driver.save_screenshot(f"plot-{THEME}.png")
driver.quit()
Runnable source as JSON, for any HTTP client: https://api.anyplot.ai/specs/funnel-meta-analysis/bokeh/code. Any spec id and library id listed in llms-full.txt fit the same URL shape; every URL below is complete and callable.
{
  "spec_id": "funnel-meta-analysis",
  "language": "python",
  "library": "bokeh",
  "page": "https://anyplot.ai/funnel-meta-analysis/python/bokeh",
  "hub": "https://anyplot.ai/funnel-meta-analysis",
  "code_json": "https://api.anyplot.ai/specs/funnel-meta-analysis/bokeh/code",
  "spec_json": "https://api.anyplot.ai/specs/funnel-meta-analysis",
  "render_light_png": "https://storage.googleapis.com/anyplot-images/plots/funnel-meta-analysis/python/bokeh/plot-light.png",
  "render_dark_png": "https://storage.googleapis.com/anyplot-images/plots/funnel-meta-analysis/python/bokeh/plot-dark.png",
  "interactive_light_html": "https://storage.googleapis.com/anyplot-images/plots/funnel-meta-analysis/python/bokeh/plot-light.html",
  "interactive_dark_html": "https://storage.googleapis.com/anyplot-images/plots/funnel-meta-analysis/python/bokeh/plot-dark.html",
  "quality_score": 89.0,
  "license": "MIT",
  "guide": "https://anyplot.ai/llms.txt"
}
Part of Meta-Analysis Funnel Plot for Publication Bias on anyplot.ai.