The same plot in 14 other libraries — JavaScript: Chart.js, D3.js, Apache ECharts, MUI X Charts; Python: Altair, Bokeh, lets-plot, Matplotlib, Plotly, plotnine, Pygal, Seaborn; R: ggplot2; Julia: Makie.jl. Compare all 15 side by side: Meta-Analysis Funnel Plot for Publication Bias in Python, R, Julia and JavaScript.
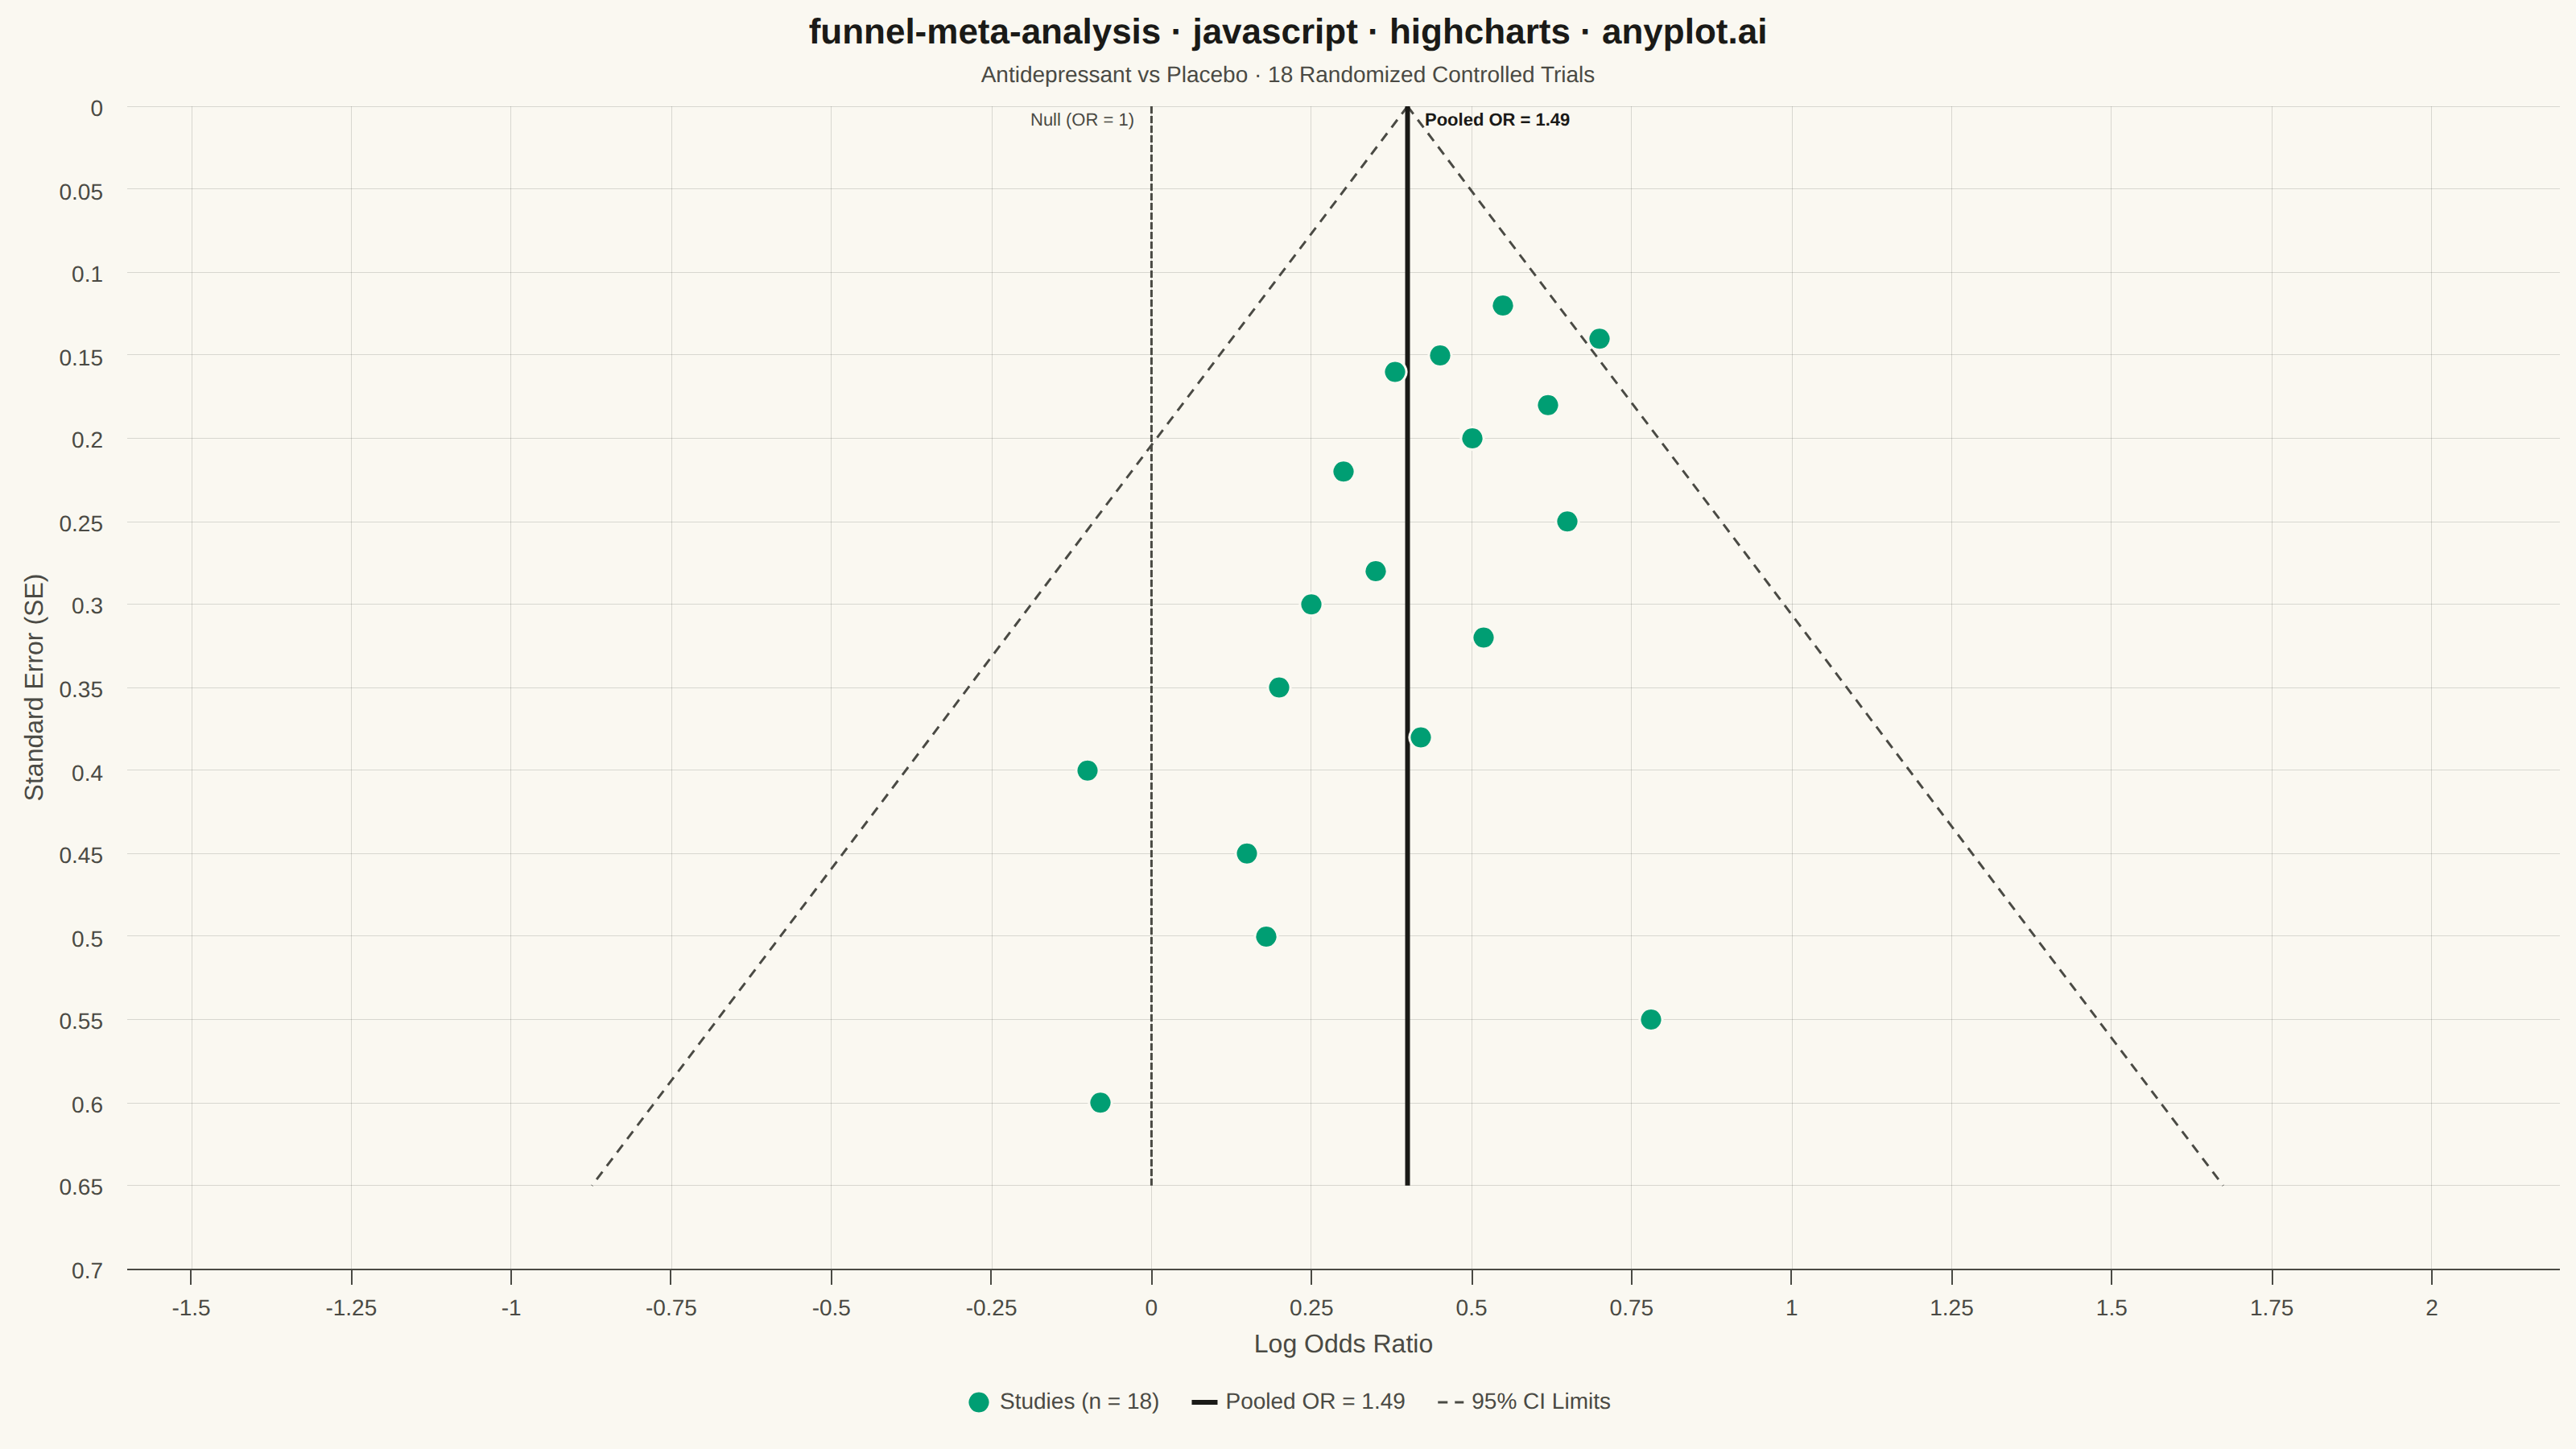
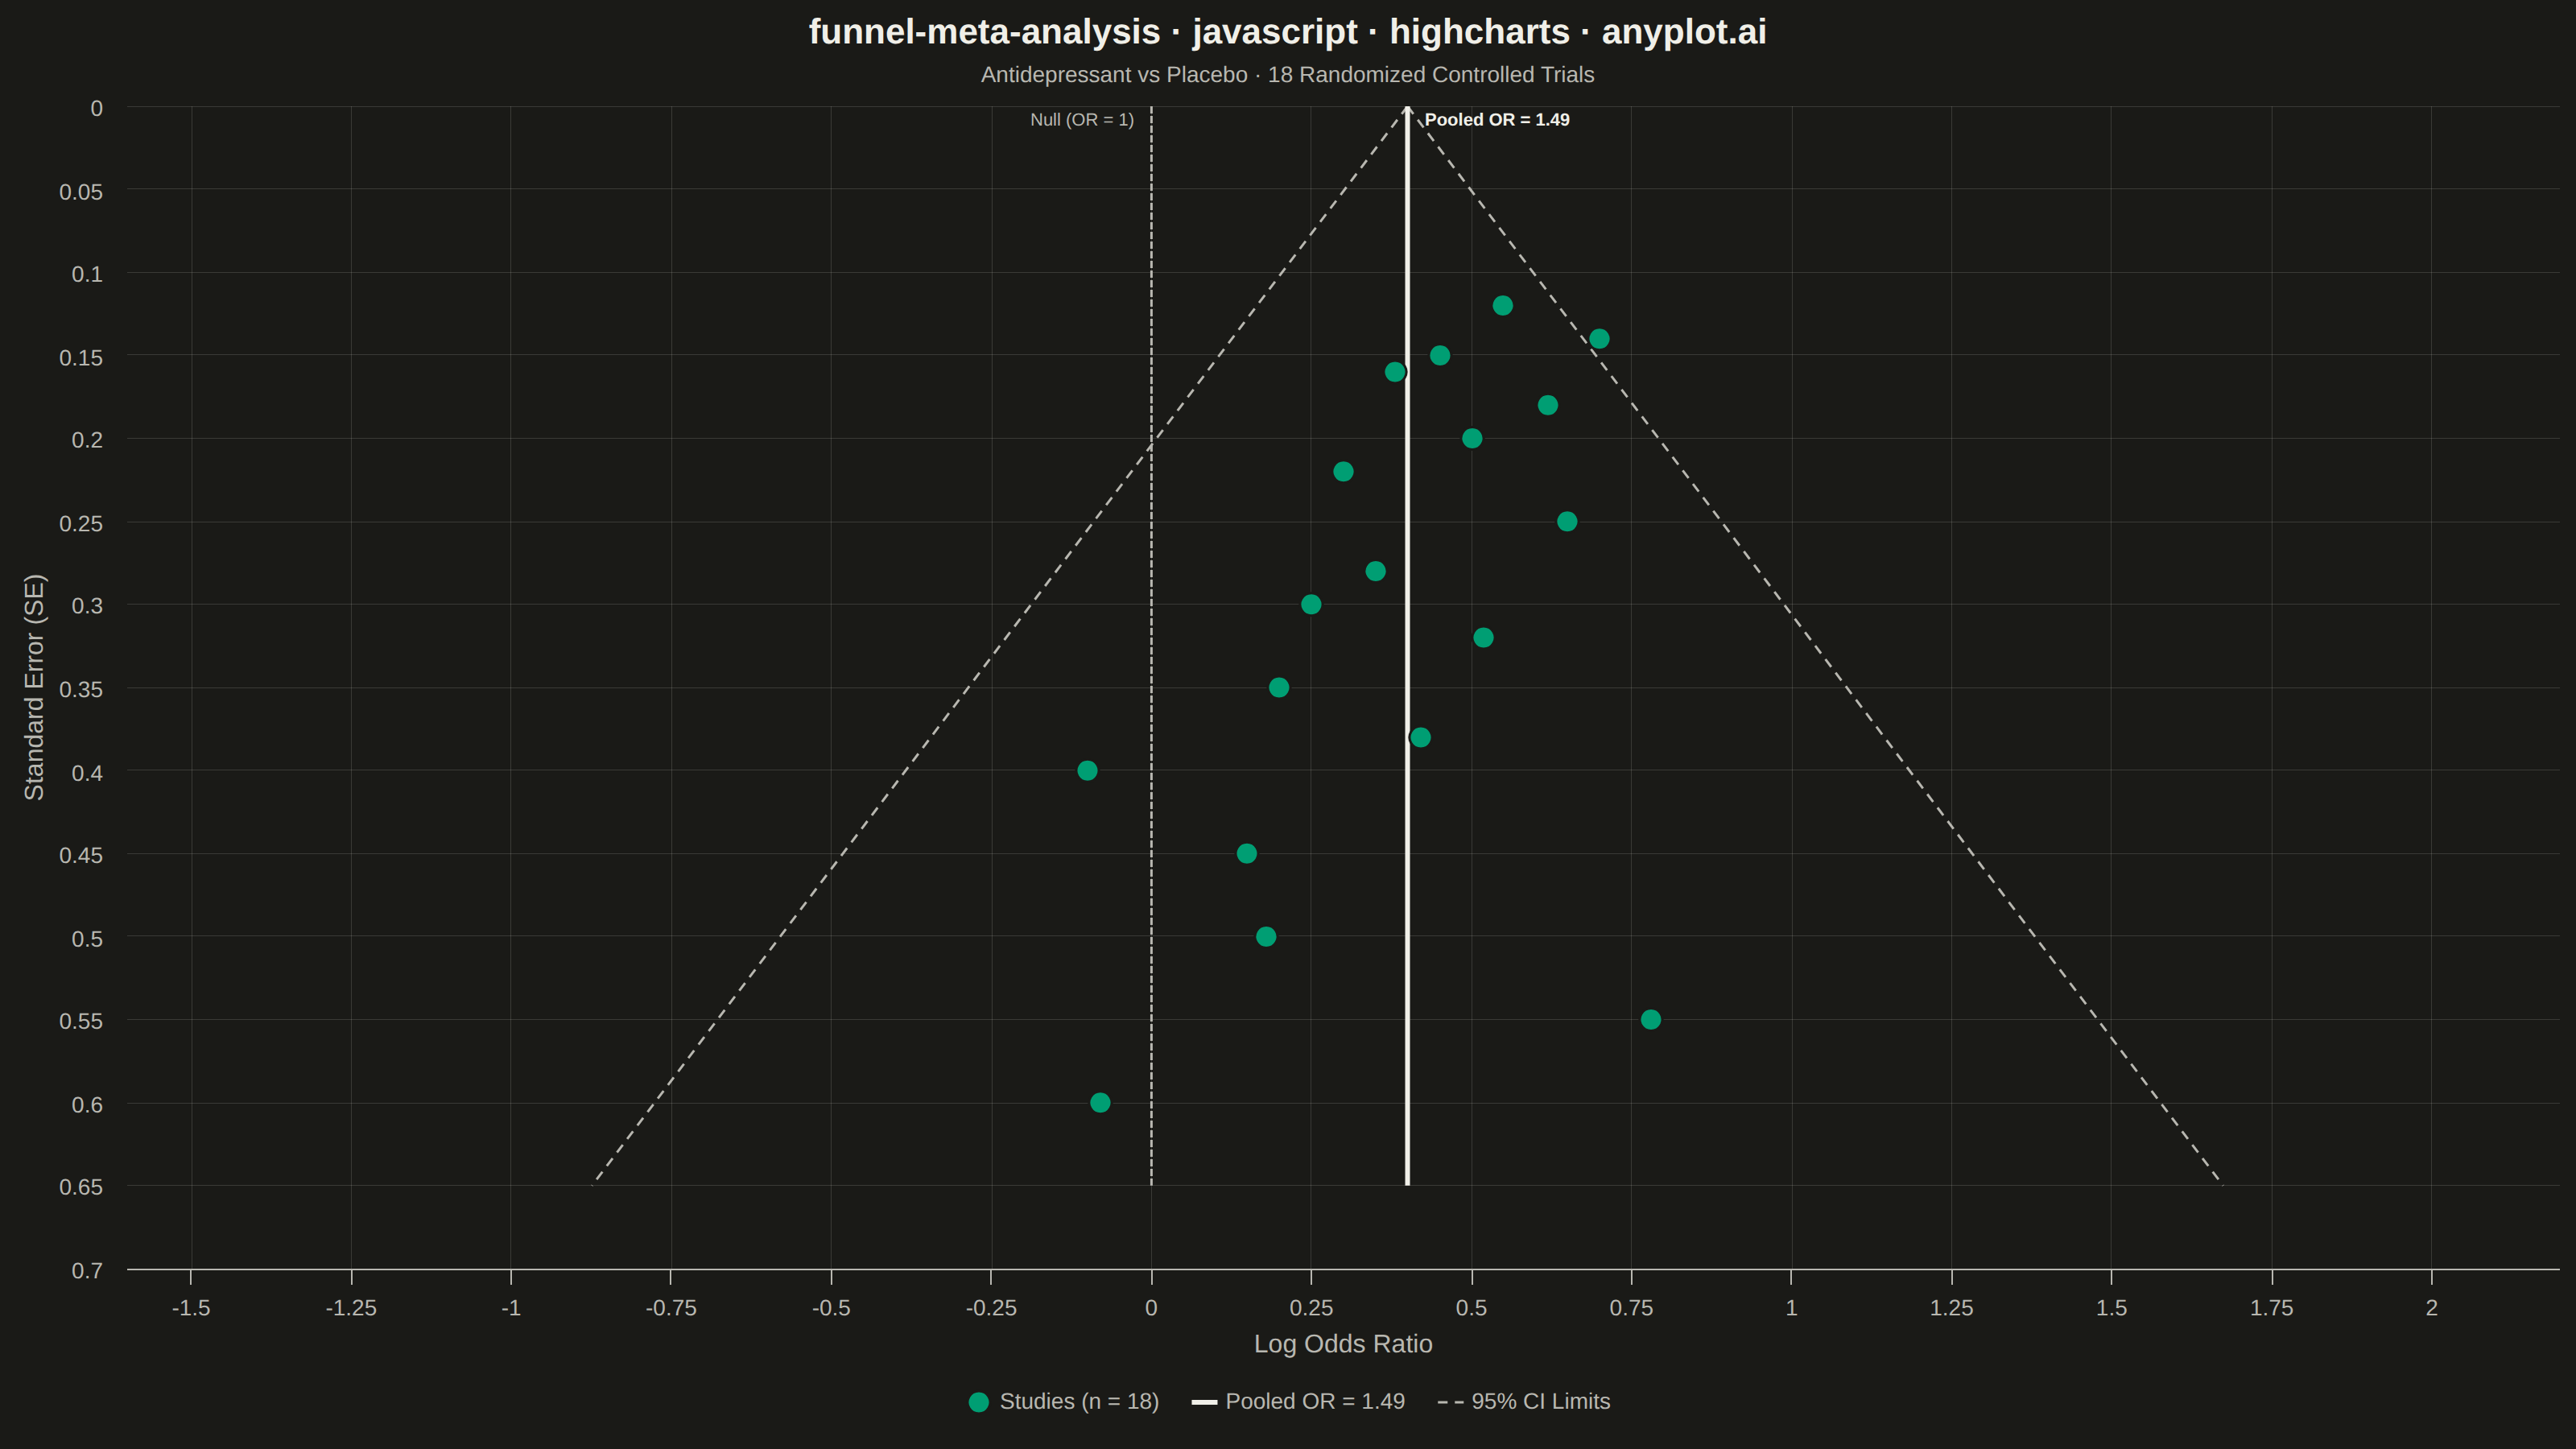
A funnel plot used in meta-analysis to assess publication bias by plotting individual study effect sizes against their precision (typically standard error). Studies scatter around a summary effect line, with pseudo 95% confidence limits forming an inverted funnel shape. In the absence of bias, studies distribute symmetrically around the summary effect; asymmetry suggests publication bias or systematic heterogeneity. This is a standard tool in systematic reviews and Cochrane-style meta-analyses.
// anyplot.ai
// funnel-meta-analysis: Meta-Analysis Funnel Plot for Publication Bias
// Library: highcharts 12.6.0 | JavaScript 22.22.3
// Quality: 90/100 | Created: 2026-06-10

const t = window.ANYPLOT_TOKENS;

// Data: 18 RCTs comparing antidepressant vs placebo, log odds ratios and standard errors
const pooledEffect = 0.40;
const seMax = 0.65;

const studies = [
  [0.45, 0.15], [0.30, 0.22], [0.62, 0.18], [0.20, 0.35],
  [0.55, 0.12], [-0.10, 0.40], [0.35, 0.28], [0.78, 0.55],
  [0.15, 0.45], [0.50, 0.20], [0.25, 0.30], [0.70, 0.14],
  [0.42, 0.38], [0.18, 0.50], [-0.08, 0.60], [0.65, 0.25],
  [0.38, 0.16], [0.52, 0.32]
];

// Pseudo 95% CI funnel: apex at (pooled, SE=0), base at (pooled ± 1.96 * seMax, seMax)
const ci96 = 1.96 * seMax;
const funnelLeft  = [{ x: pooledEffect, y: 0 }, { x: pooledEffect - ci96, y: seMax }];
const funnelRight = [{ x: pooledEffect, y: 0 }, { x: pooledEffect + ci96, y: seMax }];

Highcharts.chart("container", {
  chart: {
    type: "scatter",
    backgroundColor: "transparent",
    animation: false,
    plotBorderWidth: 0,
    style: { fontFamily: "inherit" }
  },
  credits: { enabled: false },
  colors: t.palette,
  title: {
    text: "funnel-meta-analysis · javascript · highcharts · anyplot.ai",
    style: { color: t.ink, fontSize: "22px", fontWeight: "600" }
  },
  subtitle: {
    text: "Antidepressant vs Placebo · 18 Randomized Controlled Trials",
    style: { color: t.inkSoft, fontSize: "14px" }
  },
  xAxis: {
    title: {
      text: "Log Odds Ratio",
      style: { color: t.inkSoft, fontSize: "16px" }
    },
    lineColor: t.inkSoft,
    tickColor: t.inkSoft,
    gridLineColor: t.grid,
    gridLineWidth: 0.5,
    min: -1.6,
    max: 2.2,
    labels: { style: { color: t.inkSoft, fontSize: "14px" } }
  },
  yAxis: {
    title: {
      text: "Standard Error (SE)",
      style: { color: t.inkSoft, fontSize: "16px" }
    },
    reversed: true,
    min: 0,
    max: 0.70,
    lineColor: t.inkSoft,
    tickColor: t.inkSoft,
    gridLineColor: t.grid,
    gridLineWidth: 0.5,
    labels: { style: { color: t.inkSoft, fontSize: "14px" } }
  },
  legend: {
    itemStyle: { color: t.inkSoft, fontSize: "14px" },
    itemHoverStyle: { color: t.ink }
  },
  tooltip: {
    formatter: function () {
      return "<b>Log OR:</b> " + this.x.toFixed(2) + "<br><b>SE:</b> " + this.y.toFixed(2);
    }
  },
  plotOptions: {
    series: { animation: false }
  },
  series: [
    {
      type: "scatter",
      name: "Studies (n = 18)",
      data: studies,
      color: t.palette[0],
      marker: {
        radius: 7,
        symbol: "circle",
        lineColor: t.pageBg,
        lineWidth: 1.5
      },
      zIndex: 5
    },
    {
      // Pooled effect as a series for full lineWidth and label control
      type: "line",
      name: "Pooled OR = 1.49",
      data: [
        {
          x: pooledEffect,
          y: 0,
          dataLabels: {
            enabled: true,
            format: "Pooled OR = 1.49",
            rotation: 0,
            align: "left",
            x: 6,
            y: 18,
            style: {
              color: t.ink,
              fontSize: "11px",
              fontWeight: "700",
              textOutline: "none"
            }
          }
        },
        { x: pooledEffect, y: seMax }
      ],
      color: t.ink,
      lineWidth: 3,
      dashStyle: "Solid",
      marker: { enabled: false },
      enableMouseTracking: false,
      zIndex: 4
    },
    {
      type: "line",
      name: "95% CI Limits",
      data: funnelLeft,
      color: t.inkSoft,
      lineWidth: 1.5,
      dashStyle: "Dash",
      marker: { enabled: false },
      enableMouseTracking: false,
      zIndex: 3
    },
    {
      type: "line",
      data: funnelRight,
      color: t.inkSoft,
      lineWidth: 1.5,
      dashStyle: "Dash",
      marker: { enabled: false },
      enableMouseTracking: false,
      showInLegend: false,
      zIndex: 3
    },
    {
      // Null reference as a series for label control — no legend entry
      type: "line",
      data: [
        {
          x: 0,
          y: 0,
          dataLabels: {
            enabled: true,
            format: "Null (OR = 1)",
            rotation: 0,
            align: "right",
            x: -6,
            y: 18,
            style: {
              color: t.inkSoft,
              fontSize: "11px",
              fontWeight: "400",
              textOutline: "none"
            }
          }
        },
        { x: 0, y: seMax }
      ],
      color: t.inkSoft,
      lineWidth: 1.5,
      dashStyle: "ShortDash",
      marker: { enabled: false },
      enableMouseTracking: false,
      showInLegend: false,
      zIndex: 2
    }
  ]
});
Runnable source as JSON, for any HTTP client: https://api.anyplot.ai/specs/funnel-meta-analysis/highcharts/code. Any spec id and library id listed in llms-full.txt fit the same URL shape; every URL below is complete and callable.
{
  "spec_id": "funnel-meta-analysis",
  "language": "javascript",
  "library": "highcharts",
  "page": "https://anyplot.ai/funnel-meta-analysis/javascript/highcharts",
  "hub": "https://anyplot.ai/funnel-meta-analysis",
  "code_json": "https://api.anyplot.ai/specs/funnel-meta-analysis/highcharts/code",
  "spec_json": "https://api.anyplot.ai/specs/funnel-meta-analysis",
  "render_light_png": "https://storage.googleapis.com/anyplot-images/plots/funnel-meta-analysis/javascript/highcharts/plot-light.png",
  "render_dark_png": "https://storage.googleapis.com/anyplot-images/plots/funnel-meta-analysis/javascript/highcharts/plot-dark.png",
  "interactive_light_html": "https://storage.googleapis.com/anyplot-images/plots/funnel-meta-analysis/javascript/highcharts/plot-light.html",
  "interactive_dark_html": "https://storage.googleapis.com/anyplot-images/plots/funnel-meta-analysis/javascript/highcharts/plot-dark.html",
  "quality_score": 90.0,
  "license": "MIT",
  "guide": "https://anyplot.ai/llms.txt"
}
Part of Meta-Analysis Funnel Plot for Publication Bias on anyplot.ai.