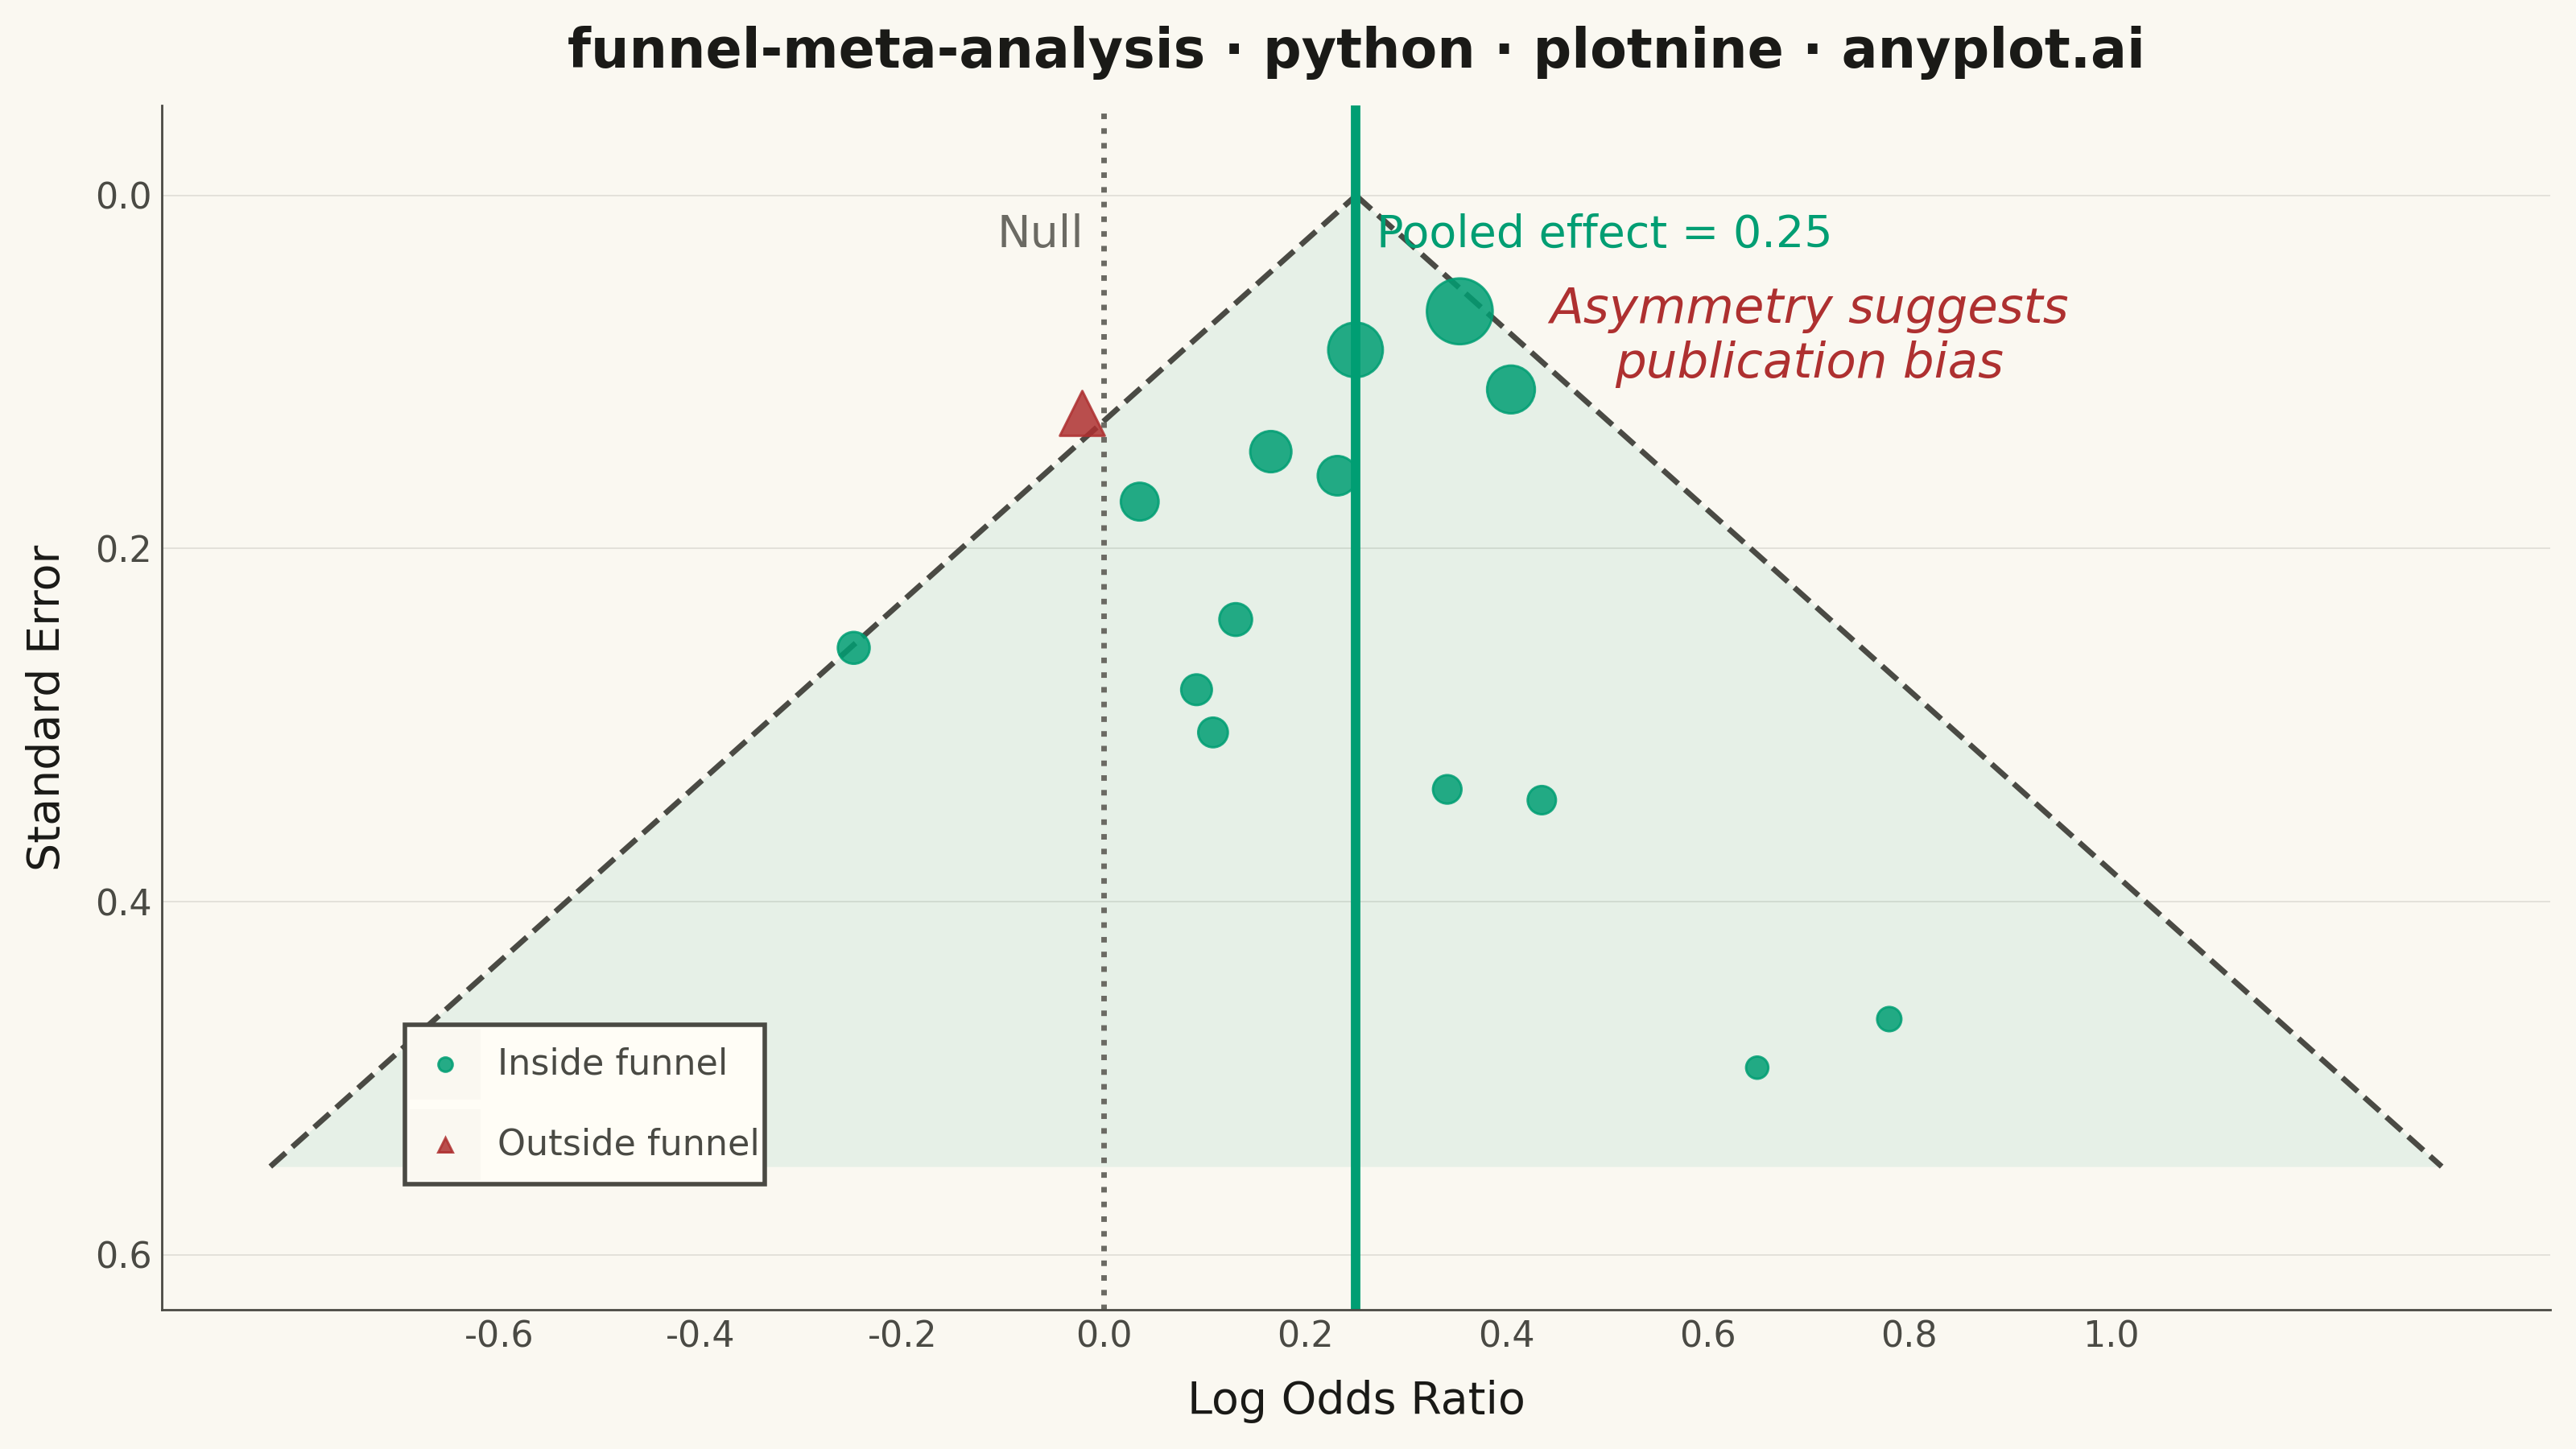
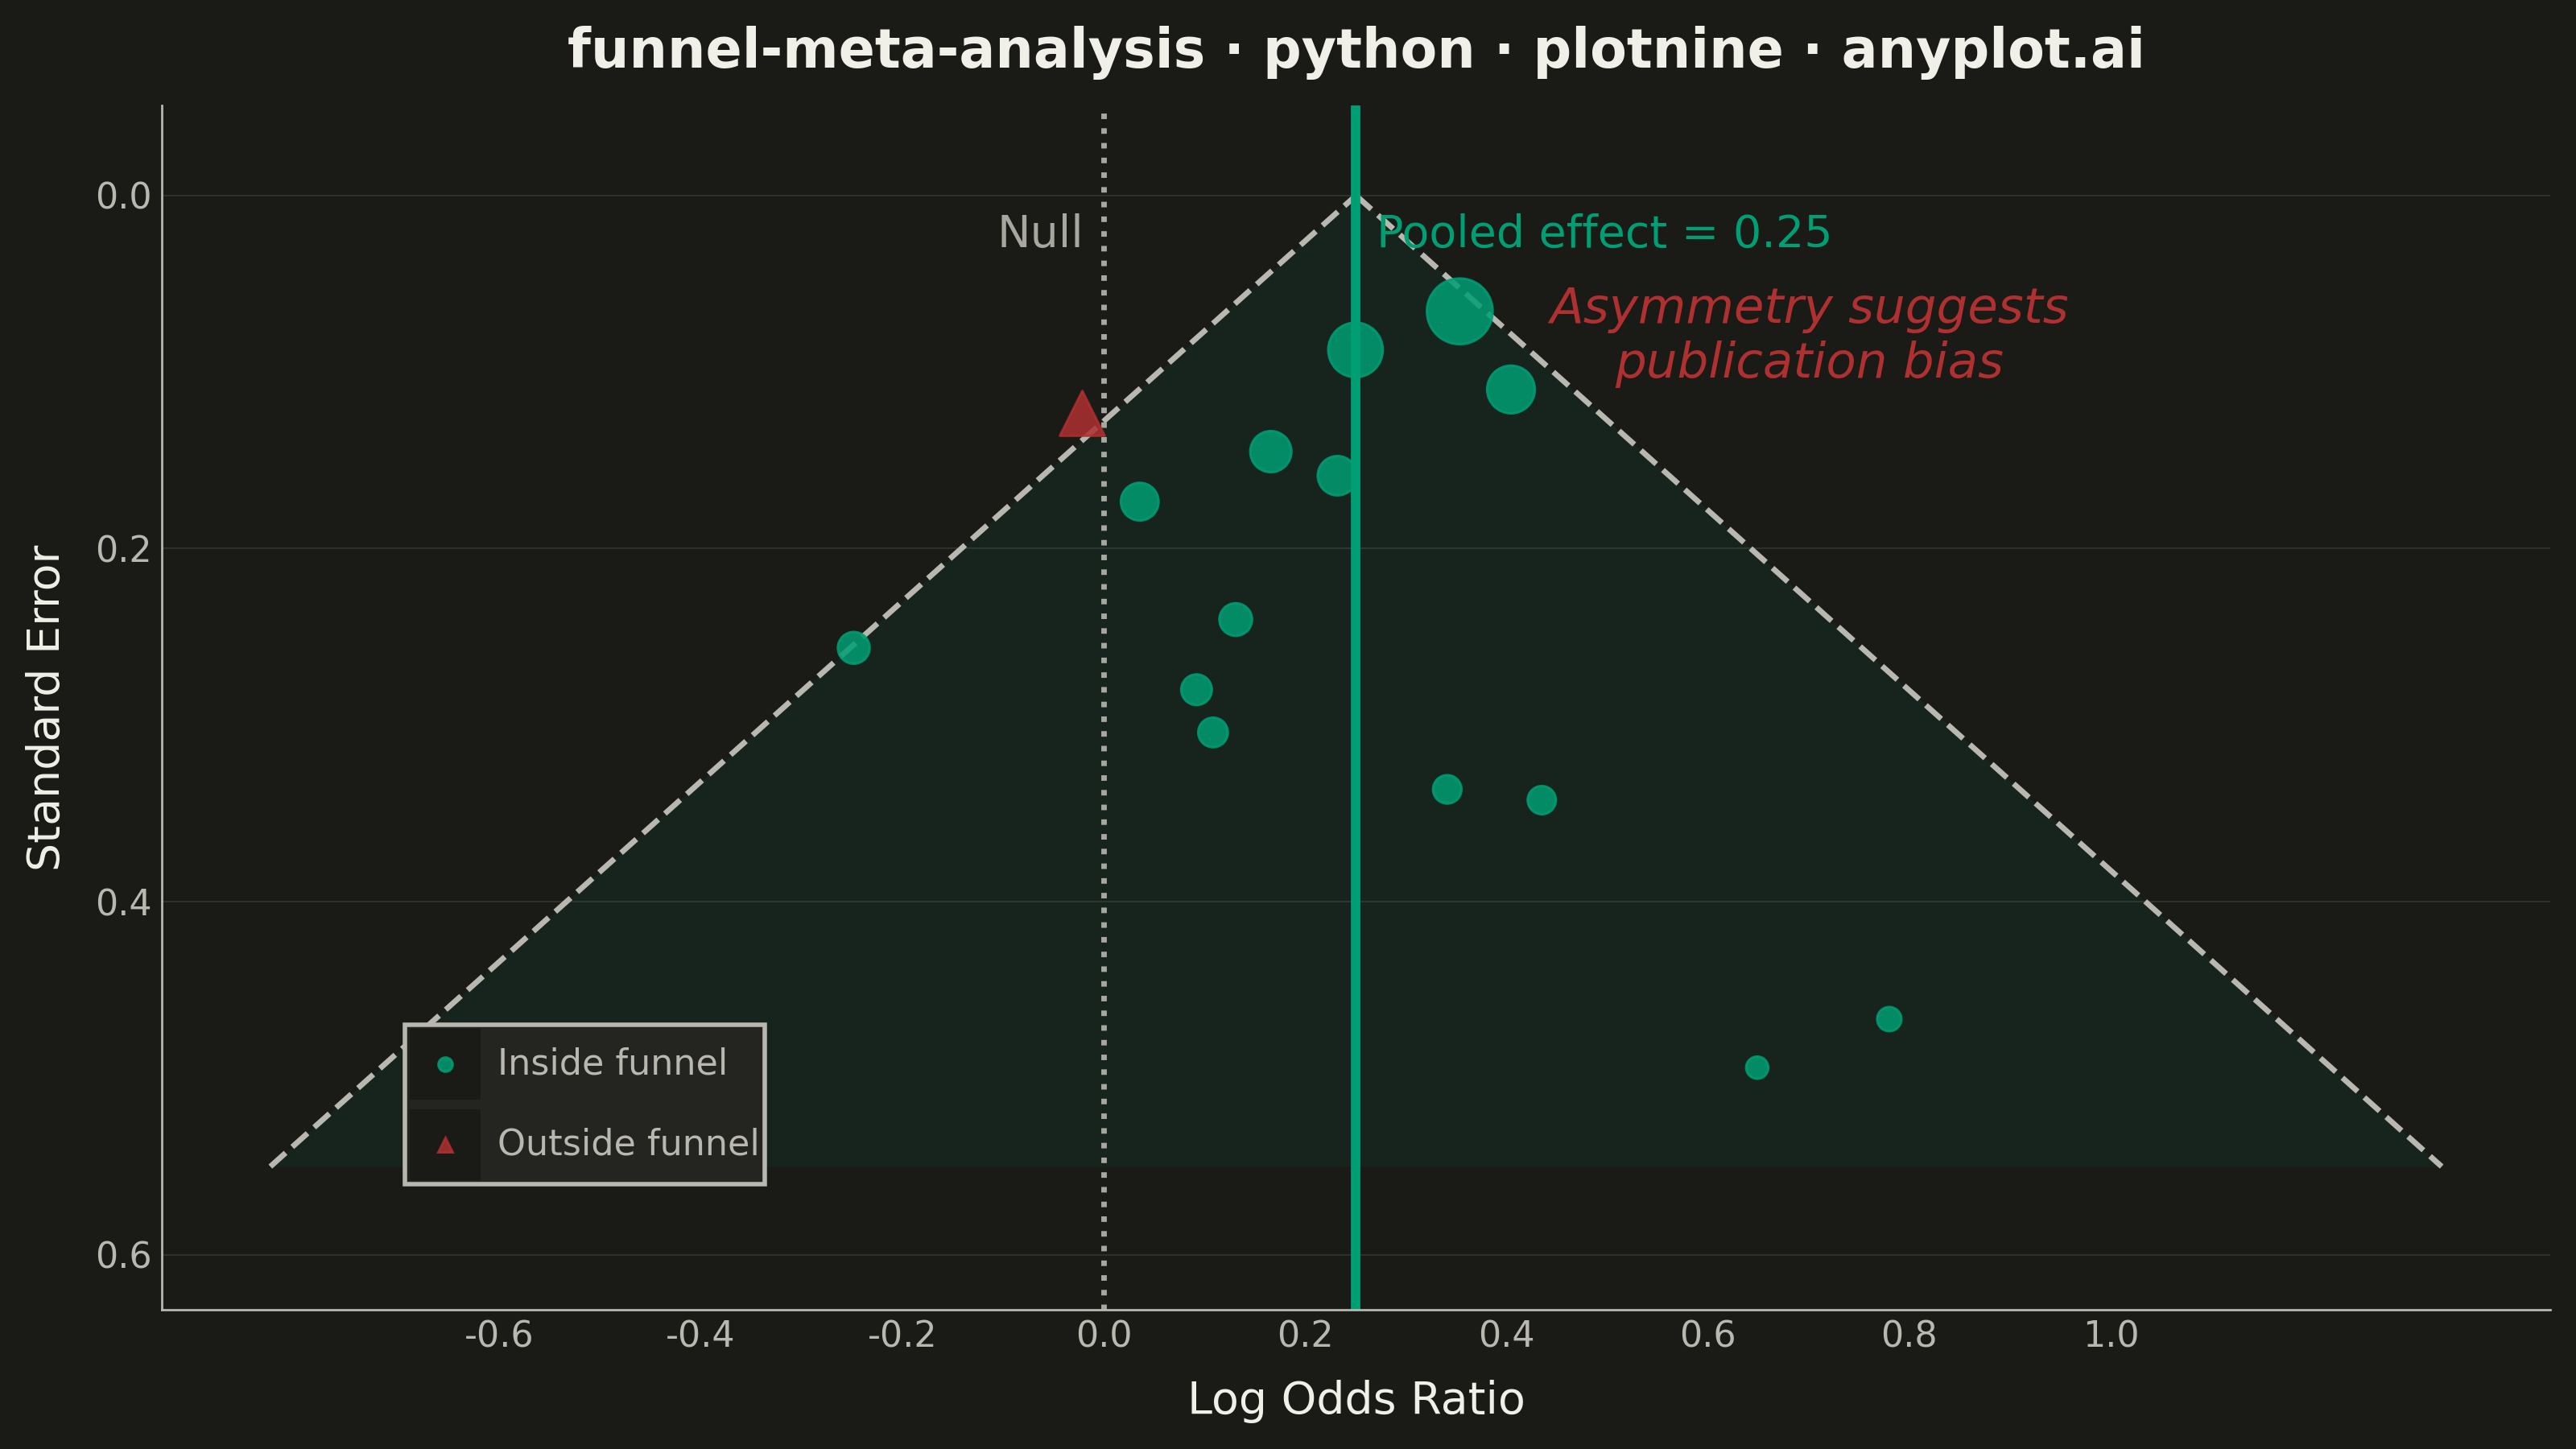
A funnel plot used in meta-analysis to assess publication bias by plotting individual study effect sizes against their precision (typically standard error). Studies scatter around a summary effect line, with pseudo 95% confidence limits forming an inverted funnel shape. In the absence of bias, studies distribute symmetrically around the summary effect; asymmetry suggests publication bias or systematic heterogeneity. This is a standard tool in systematic reviews and Cochrane-style meta-analyses.
""" anyplot.ai
funnel-meta-analysis: Meta-Analysis Funnel Plot for Publication Bias
Library: plotnine 0.15.5 | Python 3.13.13
Quality: 90/100 | Updated: 2026-06-10
"""

import os
import sys

import numpy as np
import pandas as pd


# Work around naming conflict with plotnine.py script and plotnine package
script_dir = os.path.dirname(os.path.abspath(__file__))
if script_dir in sys.path:
    sys.path.remove(script_dir)
if "" in sys.path:
    sys.path.remove("")
if "." in sys.path:
    sys.path.remove(".")

from plotnine import (
    aes,
    annotate,
    element_blank,
    element_line,
    element_rect,
    element_text,
    geom_line,
    geom_point,
    geom_polygon,
    geom_vline,
    ggplot,
    guide_legend,
    guides,
    labs,
    scale_color_manual,
    scale_shape_manual,
    scale_size_continuous,
    scale_x_continuous,
    scale_y_reverse,
    theme,
    theme_minimal,
)


# Theme tokens
THEME = os.getenv("ANYPLOT_THEME", "light")
PAGE_BG = "#FAF8F1" if THEME == "light" else "#1A1A17"
ELEVATED_BG = "#FFFDF6" if THEME == "light" else "#242420"
INK = "#1A1A17" if THEME == "light" else "#F0EFE8"
INK_SOFT = "#4A4A44" if THEME == "light" else "#B8B7B0"
INK_MUTED = "#6B6A63" if THEME == "light" else "#A8A79F"

# Imprint palette — brand green for inside funnel, semantic red for outside/bias
BRAND = "#009E73"
OUTLIER_COLOR = "#AE3030"  # matte red — semantic anchor for bad/outlier/bias

# Data — 15 RCTs comparing drug vs placebo (log odds ratios)
np.random.seed(42)
n_studies = 15
true_effect = 0.3

std_errors = np.concatenate(
    [np.random.uniform(0.05, 0.15, 5), np.random.uniform(0.15, 0.30, 5), np.random.uniform(0.30, 0.50, 5)]
)
effect_sizes = true_effect + np.random.normal(0, std_errors)

# Add publication bias: shift imprecise (high-SE) studies toward positive
bias_mask = std_errors > 0.35
effect_sizes[bias_mask] += np.random.uniform(0.04, 0.12, bias_mask.sum())

# Clip to keep x-axis balanced and avoid extreme outliers
effect_sizes = np.clip(effect_sizes, -0.55, 0.78)

summary_effect = float(np.average(effect_sizes, weights=1 / std_errors**2))

# Inverse-variance weight for point sizing
weights = 1 / std_errors**2
weight_normalized = weights / weights.max()

# Classify each study by funnel region
lower_ci = summary_effect - 1.96 * std_errors
upper_ci = summary_effect + 1.96 * std_errors
outside_funnel = (effect_sizes < lower_ci) | (effect_sizes > upper_ci)
region = np.where(outside_funnel, "Outside funnel", "Inside funnel")

studies_df = pd.DataFrame(
    {
        "effect_size": effect_sizes,
        "std_error": std_errors,
        "weight": weight_normalized,
        "region": pd.Categorical(region, categories=["Inside funnel", "Outside funnel"]),
    }
)

# Funnel boundary lines (pseudo 95% CI around pooled effect)
se_max = 0.55
se_range = np.linspace(0, se_max, 200)
funnel_lines = pd.DataFrame(
    {
        "effect": np.concatenate([summary_effect - 1.96 * se_range, summary_effect + 1.96 * se_range]),
        "se": np.concatenate([se_range, se_range]),
        "side": ["lower"] * len(se_range) + ["upper"] * len(se_range),
    }
)

# Funnel polygon for shaded interior region
funnel_poly = pd.DataFrame(
    {"x": [summary_effect, summary_effect - 1.96 * se_max, summary_effect + 1.96 * se_max], "y": [0.0, se_max, se_max]}
)

# Title
title = "funnel-meta-analysis · python · plotnine · anyplot.ai"

# Plot
plot = (
    ggplot()
    + geom_polygon(funnel_poly, aes(x="x", y="y"), fill=BRAND, alpha=0.08)
    + geom_line(funnel_lines, aes(x="effect", y="se", group="side"), color=INK_SOFT, linetype="dashed", size=0.7)
    + geom_vline(xintercept=summary_effect, color=BRAND, size=1.2)
    + geom_vline(xintercept=0, color=INK_MUTED, linetype="dotted", size=0.7)
    + geom_point(
        studies_df,
        aes(x="effect_size", y="std_error", size="weight", color="region", shape="region"),
        alpha=0.85,
        stroke=0.3,
    )
    + scale_size_continuous(range=(2.5, 8), guide=None)
    + scale_color_manual(values={"Inside funnel": BRAND, "Outside funnel": OUTLIER_COLOR}, name="")
    + scale_shape_manual(values={"Inside funnel": "o", "Outside funnel": "^"}, name="")
    + guides(color=guide_legend(override_aes={"shape": ["o", "^"]}), shape=False)
    + annotate(
        "text",
        x=summary_effect + 0.45,
        y=0.08,
        label="Asymmetry suggests\npublication bias",
        size=11,
        color=OUTLIER_COLOR,
        fontstyle="italic",
        ha="center",
    )
    + annotate(
        "text",
        x=summary_effect + 0.02,
        y=0.01,
        label=f"Pooled effect = {summary_effect:.2f}",
        size=10,
        color=BRAND,
        ha="left",
        va="top",
    )
    + annotate("text", x=-0.02, y=0.01, label="Null", size=10, color=INK_MUTED, ha="right", va="top")
    + scale_y_reverse(limits=(0.60, -0.02))
    + scale_x_continuous(breaks=np.arange(-0.6, 1.2, 0.2).round(1).tolist())
    + labs(x="Log Odds Ratio", y="Standard Error", color="", title=title)
    + theme_minimal()
    + theme(
        figure_size=(8, 4.5),
        plot_title=element_text(size=12, weight="bold", color=INK),
        axis_title=element_text(size=10, color=INK),
        axis_text=element_text(size=8, color=INK_SOFT),
        panel_grid_major_y=element_line(color=INK, size=0.3, alpha=0.12),
        panel_grid_major_x=element_blank(),
        panel_grid_minor=element_blank(),
        panel_background=element_rect(fill=PAGE_BG, color="none"),
        plot_background=element_rect(fill=PAGE_BG, color="none"),
        legend_position=(0.12, 0.12),
        legend_background=element_rect(fill=ELEVATED_BG, color=INK_SOFT),
        legend_text=element_text(size=8, color=INK_SOFT),
        legend_title=element_blank(),
        axis_line=element_line(color=INK_SOFT, size=0.5),
    )
)

# Save
plot.save(f"plot-{THEME}.png", dpi=400, width=8, height=4.5, units="in")
Runnable source as JSON, for any HTTP client: https://api.anyplot.ai/specs/funnel-meta-analysis/plotnine/code. Any spec id and library id listed in llms-full.txt fit the same URL shape; every URL below is complete and callable.
{
  "spec_id": "funnel-meta-analysis",
  "language": "python",
  "library": "plotnine",
  "page": "https://anyplot.ai/funnel-meta-analysis/python/plotnine",
  "hub": "https://anyplot.ai/funnel-meta-analysis",
  "code_json": "https://api.anyplot.ai/specs/funnel-meta-analysis/plotnine/code",
  "spec_json": "https://api.anyplot.ai/specs/funnel-meta-analysis",
  "render_light_png": "https://storage.googleapis.com/anyplot-images/plots/funnel-meta-analysis/python/plotnine/plot-light.png",
  "render_dark_png": "https://storage.googleapis.com/anyplot-images/plots/funnel-meta-analysis/python/plotnine/plot-dark.png",
  "quality_score": 90.0,
  "license": "MIT",
  "guide": "https://anyplot.ai/llms.txt"
}
Part of Meta-Analysis Funnel Plot for Publication Bias on anyplot.ai.