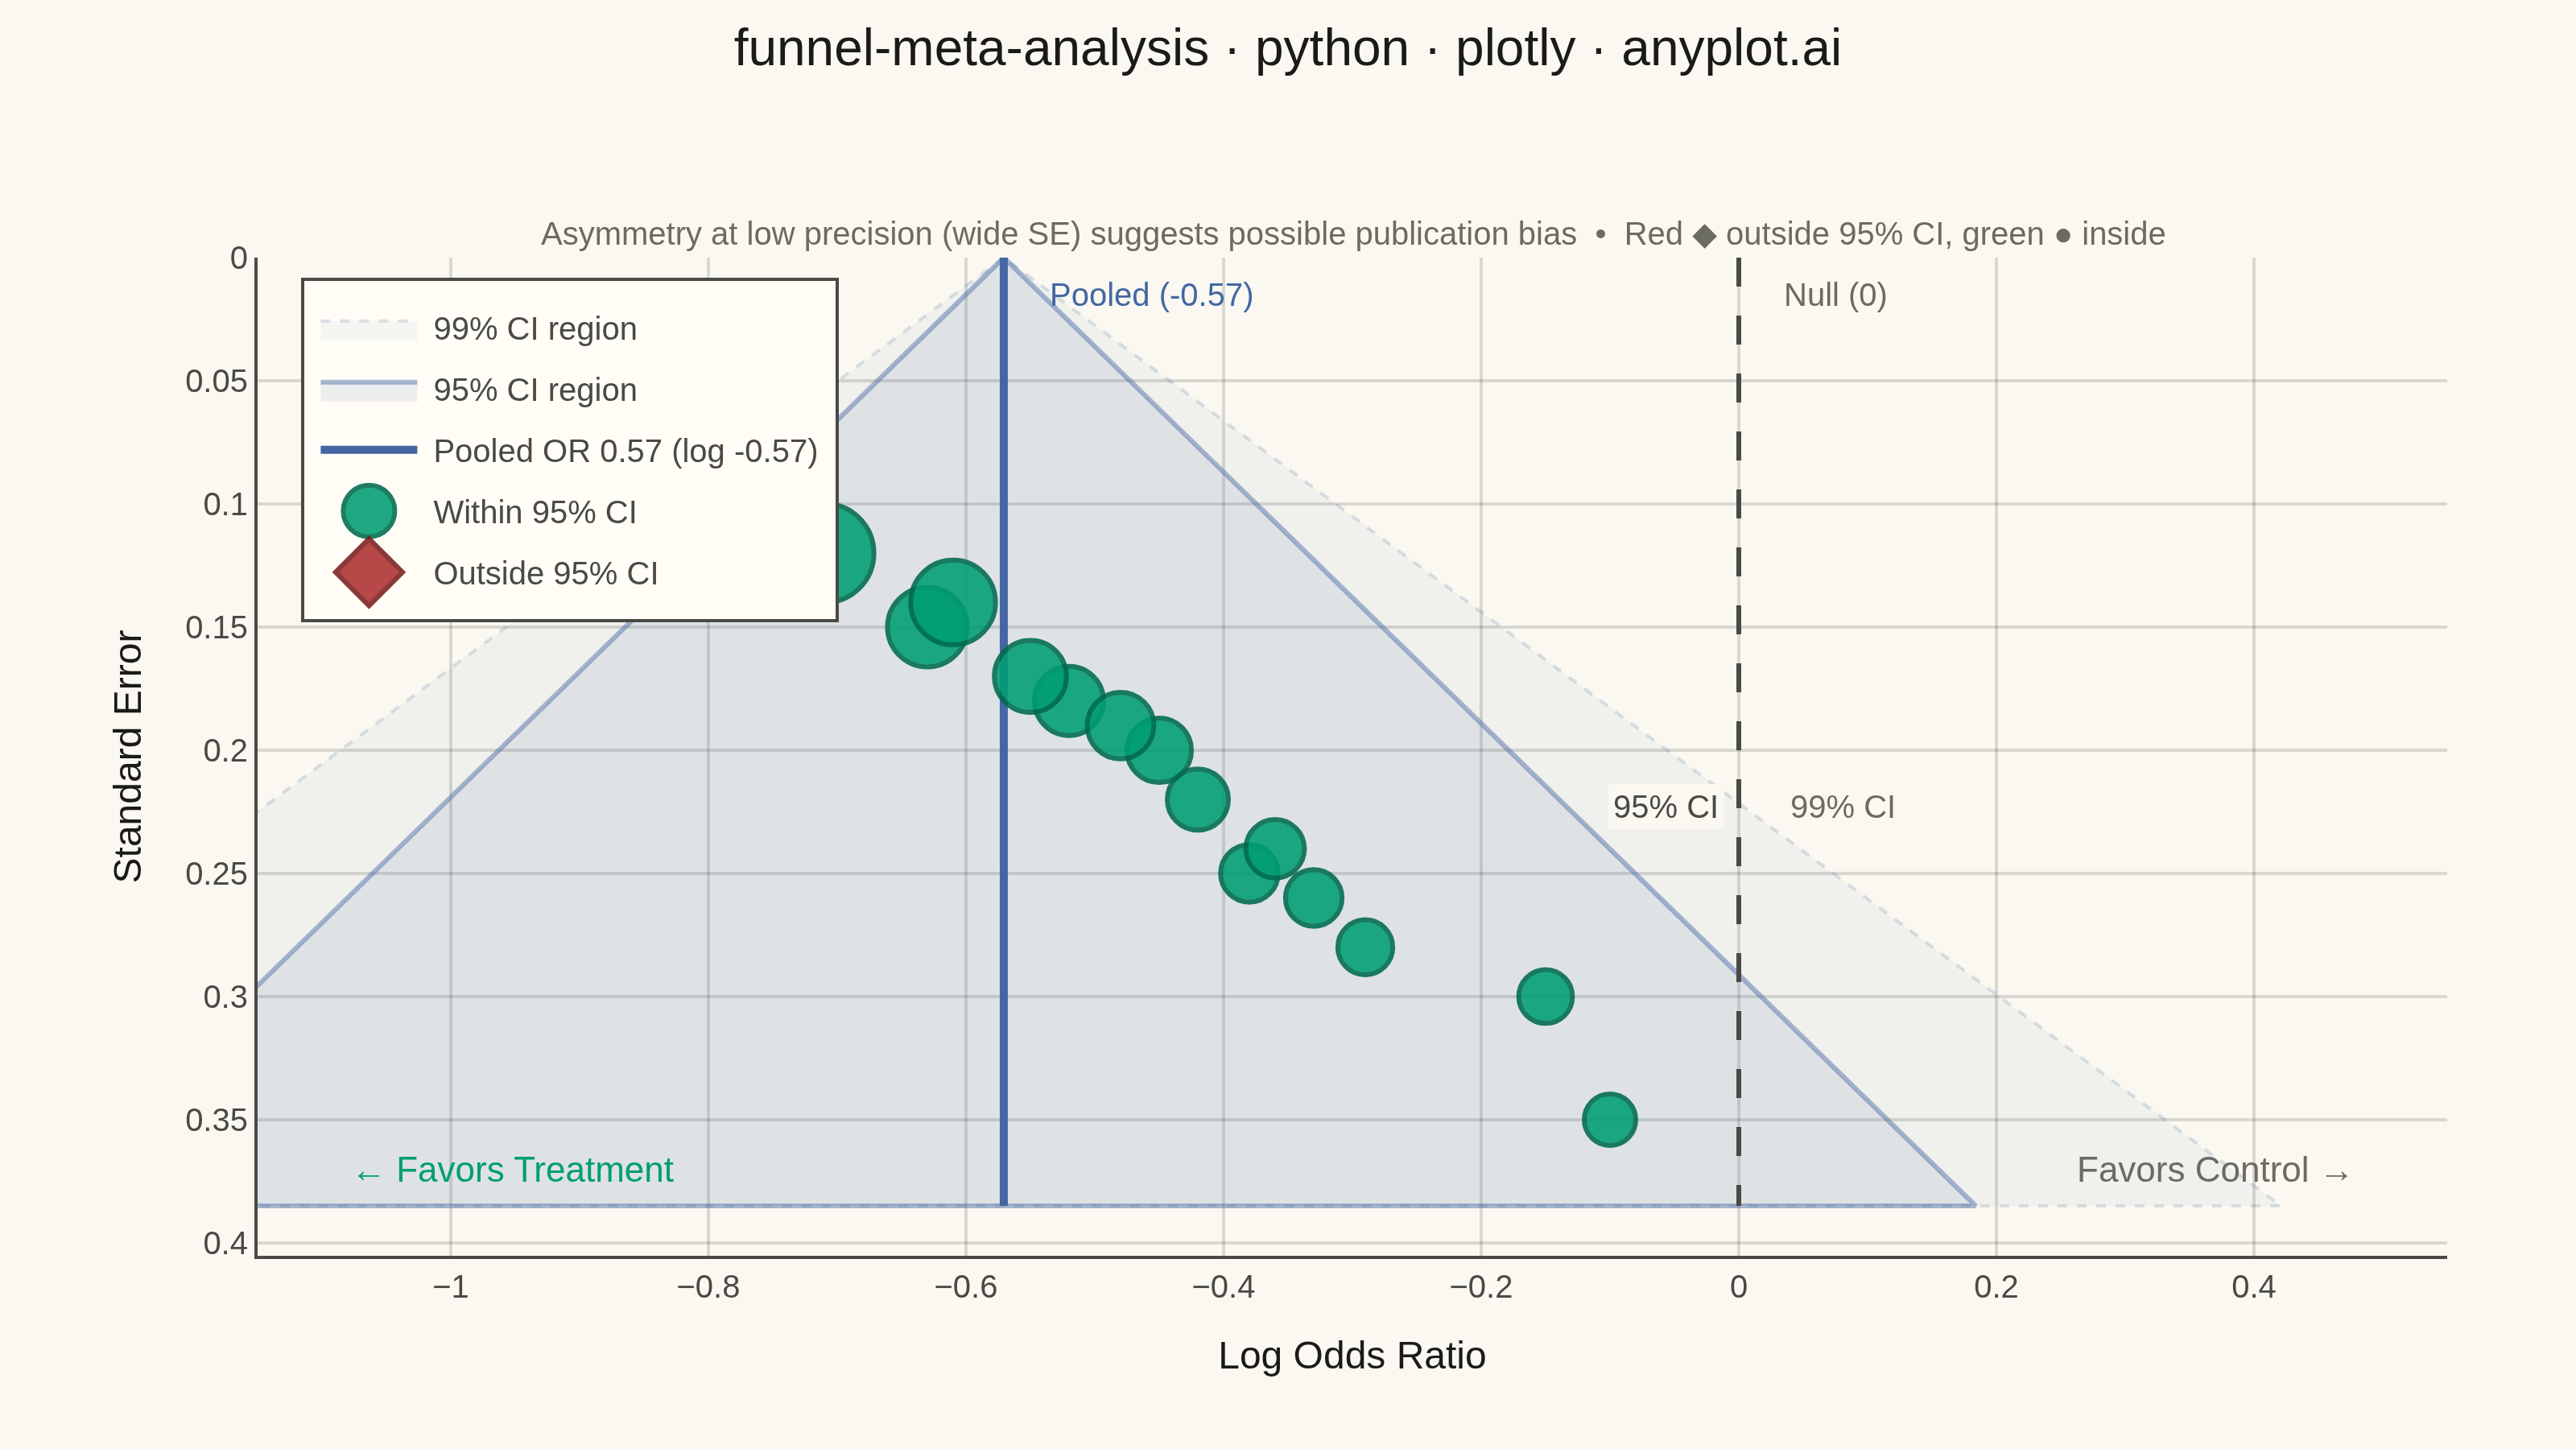
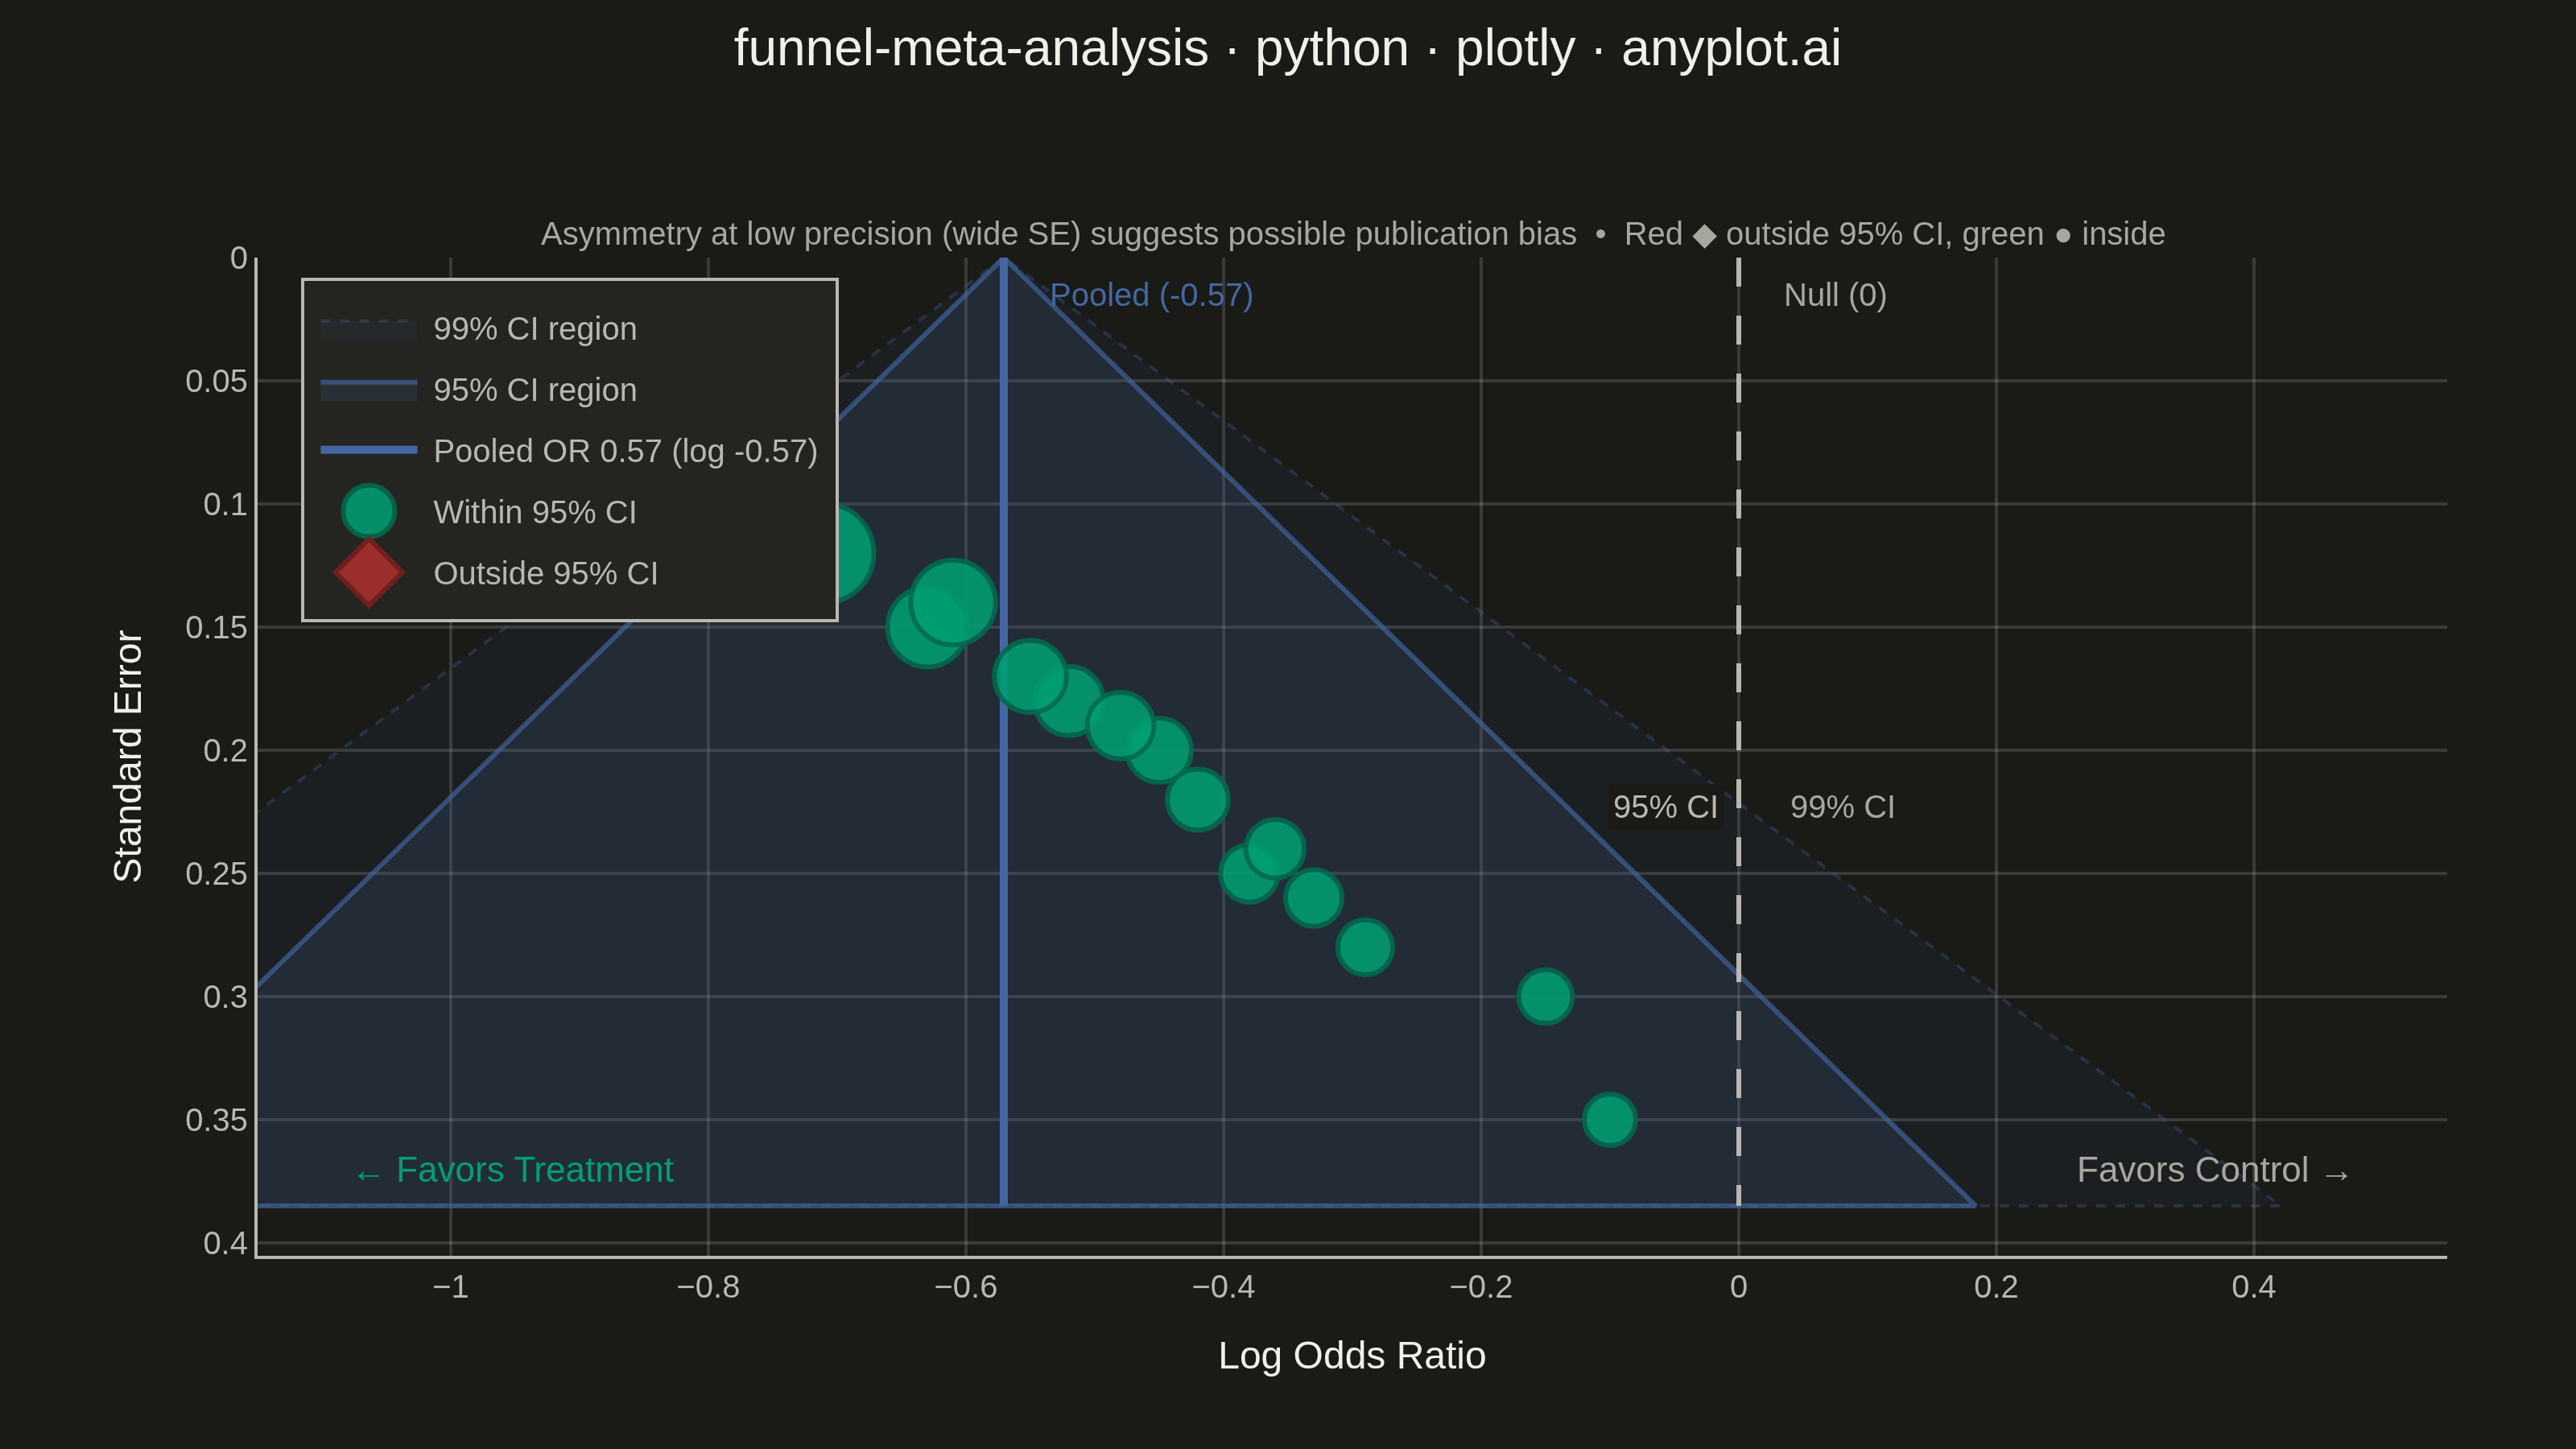
A funnel plot used in meta-analysis to assess publication bias by plotting individual study effect sizes against their precision (typically standard error). Studies scatter around a summary effect line, with pseudo 95% confidence limits forming an inverted funnel shape. In the absence of bias, studies distribute symmetrically around the summary effect; asymmetry suggests publication bias or systematic heterogeneity. This is a standard tool in systematic reviews and Cochrane-style meta-analyses.
""" anyplot.ai
funnel-meta-analysis: Meta-Analysis Funnel Plot for Publication Bias
Library: plotly 6.8.0 | Python 3.13.13
Quality: 88/100 | Updated: 2026-06-10
"""

import os

import numpy as np
import plotly.graph_objects as go


# Theme tokens — Imprint palette + adaptive chrome
THEME = os.getenv("ANYPLOT_THEME", "light")
PAGE_BG = "#FAF8F1" if THEME == "light" else "#1A1A17"
ELEVATED_BG = "#FFFDF6" if THEME == "light" else "#242420"
INK = "#1A1A17" if THEME == "light" else "#F0EFE8"
INK_SOFT = "#4A4A44" if THEME == "light" else "#B8B7B0"
INK_MUTED = "#6B6A63" if THEME == "light" else "#A8A79F"
GRID = "rgba(26,26,23,0.15)" if THEME == "light" else "rgba(240,239,232,0.15)"

# Imprint palette positions used
BRAND = "#009E73"  # position 1 — inside-funnel studies
BLUE = "#4467A3"  # position 3 — pooled effect line
RED = "#AE3030"  # position 5 — semantic anchor for outliers (outside 95% CI)

# Funnel shading derived from BLUE
FUNNEL_FILL_95 = "rgba(68,103,163,0.10)" if THEME == "light" else "rgba(68,103,163,0.16)"
FUNNEL_LINE_95 = "rgba(68,103,163,0.45)" if THEME == "light" else "rgba(68,103,163,0.65)"
FUNNEL_FILL_99 = "rgba(68,103,163,0.05)" if THEME == "light" else "rgba(68,103,163,0.08)"
FUNNEL_LINE_99 = "rgba(68,103,163,0.18)" if THEME == "light" else "rgba(68,103,163,0.30)"

# Data: 15 RCTs comparing drug vs placebo — log odds ratios and standard errors
np.random.seed(42)

studies = [
    "Adams et al. 2016",
    "Baker et al. 2017",
    "Chen et al. 2017",
    "Davis & Park 2018",
    "Evans et al. 2018",
    "Fischer 2019",
    "Gupta et al. 2019",
    "Harris et al. 2020",
    "Ibrahim et al. 2020",
    "Jensen & Liu 2021",
    "Kim et al. 2021",
    "Lambert et al. 2022",
    "Morales et al. 2022",
    "Nielsen 2023",
    "Olsen et al. 2023",
]

log_or = np.array(
    [-0.52, -0.38, -0.71, -0.15, -0.45, -0.63, -0.29, -0.55, -0.42, -0.33, -0.80, -0.48, -0.36, -0.61, -0.10]
)
std_error = np.array([0.18, 0.25, 0.12, 0.30, 0.20, 0.15, 0.28, 0.17, 0.22, 0.26, 0.11, 0.19, 0.24, 0.14, 0.35])

# Inverse-variance weights and pooled effect
weights = 1.0 / std_error**2
pooled_effect = np.sum(weights * log_or) / np.sum(weights)
pct_weights = 100 * weights / weights.sum()

# Marker sizes proportional to study weight
w_norm = weights / weights.max()
marker_sizes = 14 + w_norm * 20  # 14–34 px range

# Classify studies inside vs outside the 95% funnel
outside_funnel = np.abs(log_or - pooled_effect) > 1.96 * std_error
inside_funnel = ~outside_funnel

# Funnel boundary lines
se_max = max(std_error) * 1.1
se_range = np.linspace(0, se_max, 200)
upper_95 = pooled_effect + 1.96 * se_range
lower_95 = pooled_effect - 1.96 * se_range
upper_99 = pooled_effect + 2.576 * se_range
lower_99 = pooled_effect - 2.576 * se_range

# Build figure
fig = go.Figure()

# 99% CI shaded region
fig.add_trace(
    go.Scatter(
        x=np.concatenate([lower_99, upper_99[::-1]]),
        y=np.concatenate([se_range, se_range[::-1]]),
        fill="toself",
        fillcolor=FUNNEL_FILL_99,
        line={"color": FUNNEL_LINE_99, "width": 1, "dash": "dot"},
        showlegend=True,
        name="99% CI region",
        hoverinfo="skip",
    )
)

# 95% CI shaded region
fig.add_trace(
    go.Scatter(
        x=np.concatenate([lower_95, upper_95[::-1]]),
        y=np.concatenate([se_range, se_range[::-1]]),
        fill="toself",
        fillcolor=FUNNEL_FILL_95,
        line={"color": FUNNEL_LINE_95, "width": 1.5},
        showlegend=True,
        name="95% CI region",
        hoverinfo="skip",
    )
)

# Null effect dashed reference line
fig.add_trace(
    go.Scatter(
        x=[0, 0],
        y=[0, se_max],
        mode="lines",
        line={"color": INK_SOFT, "width": 1.5, "dash": "dash"},
        showlegend=False,
        hoverinfo="skip",
    )
)

# Pooled effect line
fig.add_trace(
    go.Scatter(
        x=[pooled_effect, pooled_effect],
        y=[0, se_max],
        mode="lines",
        line={"color": BLUE, "width": 2.5},
        showlegend=True,
        name=f"Pooled OR {np.exp(pooled_effect):.2f} (log {pooled_effect:.2f})",
        hoverinfo="skip",
    )
)

# Studies inside 95% CI funnel
if inside_funnel.any():
    hover_inside = [
        f"<b>{s}</b><br>Log OR: {e:.2f}  (OR = {np.exp(e):.2f})<br>SE: {se:.3f}<br>Weight: {w:.1f}%"
        for s, e, se, w in zip(
            np.array(studies)[inside_funnel],
            log_or[inside_funnel],
            std_error[inside_funnel],
            pct_weights[inside_funnel],
            strict=False,
        )
    ]
    fig.add_trace(
        go.Scatter(
            x=log_or[inside_funnel],
            y=std_error[inside_funnel],
            mode="markers",
            marker={
                "size": marker_sizes[inside_funnel],
                "symbol": "circle",
                "color": BRAND,
                "line": {"color": "#006B4E", "width": 1.5},
                "opacity": 0.88,
            },
            text=hover_inside,
            hovertemplate="%{text}<extra></extra>",
            hoverlabel={"bgcolor": ELEVATED_BG, "bordercolor": BRAND, "font": {"size": 13, "color": INK}},
            name="Within 95% CI",
            showlegend=True,
        )
    )

# Studies outside 95% CI funnel (potential outliers)
if outside_funnel.any():
    hover_outside = [
        f"<b>{s}</b><br>Log OR: {e:.2f}  (OR = {np.exp(e):.2f})<br>SE: {se:.3f}<br>Weight: {w:.1f}%<br>⚠ Outside 95% CI"
        for s, e, se, w in zip(
            np.array(studies)[outside_funnel],
            log_or[outside_funnel],
            std_error[outside_funnel],
            pct_weights[outside_funnel],
            strict=False,
        )
    ]
    fig.add_trace(
        go.Scatter(
            x=log_or[outside_funnel],
            y=std_error[outside_funnel],
            mode="markers",
            marker={
                "size": marker_sizes[outside_funnel],
                "symbol": "diamond",
                "color": RED,
                "line": {"color": "#7A1F1F", "width": 1.5},
                "opacity": 0.88,
            },
            text=hover_outside,
            hovertemplate="%{text}<extra></extra>",
            hoverlabel={"bgcolor": ELEVATED_BG, "bordercolor": RED, "font": {"size": 13, "color": INK}},
            name="Outside 95% CI",
            showlegend=True,
        )
    )

# Layout
title_text = "funnel-meta-analysis · python · plotly · anyplot.ai"
n = len(title_text)
title_size = round(16 * 67 / n) if n > 67 else 16

fig.update_layout(
    autosize=False,
    paper_bgcolor=PAGE_BG,
    plot_bgcolor=PAGE_BG,
    font={"color": INK, "family": "Arial, sans-serif"},
    title={
        "text": title_text,
        "font": {"size": title_size, "color": INK},
        "x": 0.5,
        "xanchor": "center",
        "y": 0.98,
        "yanchor": "top",
    },
    xaxis={
        "title": {"text": "Log Odds Ratio", "font": {"size": 12, "color": INK}, "standoff": 12},
        "tickfont": {"size": 10, "color": INK_SOFT},
        "gridcolor": GRID,
        "linecolor": INK_SOFT,
        "linewidth": 1,
        "showline": True,
        "zeroline": False,
        "range": [-1.15, 0.55],
    },
    yaxis={
        "title": {"text": "Standard Error", "font": {"size": 12, "color": INK}, "standoff": 10},
        "tickfont": {"size": 10, "color": INK_SOFT},
        "gridcolor": GRID,
        "linecolor": INK_SOFT,
        "linewidth": 1,
        "showline": True,
        "zeroline": False,
        "autorange": "reversed",
        "rangemode": "tozero",
    },
    legend={
        "bgcolor": ELEVATED_BG,
        "bordercolor": INK_SOFT,
        "borderwidth": 1,
        "font": {"size": 10, "color": INK_SOFT},
        "x": 0.02,
        "y": 0.98,
        "xanchor": "left",
        "yanchor": "top",
    },
    hovermode="closest",
    margin={"l": 80, "r": 40, "t": 80, "b": 60},
)

# Direction annotations
fig.add_annotation(
    x=0.04,
    xref="paper",
    y=se_max * 0.96,
    text="← Favors Treatment",
    showarrow=False,
    font={"size": 11, "color": BRAND},
    xanchor="left",
)
fig.add_annotation(
    x=0.96,
    xref="paper",
    y=se_max * 0.96,
    text="Favors Control →",
    showarrow=False,
    font={"size": 11, "color": INK_MUTED},
    xanchor="right",
)

# Pooled and null labels near top of chart (where SE ≈ 0)
fig.add_annotation(
    x=pooled_effect + 0.03,
    y=0.005,
    text=f"Pooled ({pooled_effect:.2f})",
    showarrow=False,
    font={"size": 10, "color": BLUE},
    xanchor="left",
    yanchor="top",
)
fig.add_annotation(
    x=0.03,
    y=0.005,
    text="Null (0)",
    showarrow=False,
    font={"size": 10, "color": INK_MUTED},
    xanchor="left",
    yanchor="top",
)

# CI boundary labels — solid background for readability against funnel fill
ci_label_se = se_max * 0.58
fig.add_annotation(
    x=pooled_effect + 1.96 * ci_label_se + 0.03,
    y=ci_label_se,
    text="95% CI",
    showarrow=False,
    font={"size": 10, "color": INK_SOFT},
    bgcolor=PAGE_BG,
    bordercolor="rgba(0,0,0,0)",
    xanchor="left",
)
fig.add_annotation(
    x=pooled_effect + 2.576 * ci_label_se + 0.03,
    y=ci_label_se,
    text="99% CI",
    showarrow=False,
    font={"size": 10, "color": INK_MUTED},
    bgcolor=PAGE_BG,
    bordercolor="rgba(0,0,0,0)",
    xanchor="left",
)

# Subtitle
fig.add_annotation(
    x=0.5,
    xref="paper",
    y=1.0,
    yref="paper",
    text="Asymmetry at low precision (wide SE) suggests possible publication bias  •  Red ◆ outside 95% CI, green ● inside",
    showarrow=False,
    font={"size": 10, "color": INK_MUTED},
    xanchor="center",
    yanchor="bottom",
)

# Save — 3200×1800 landscape (800×450 @ scale=4)
fig.write_image(f"plot-{THEME}.png", width=800, height=450, scale=4)
fig.write_html(f"plot-{THEME}.html", include_plotlyjs="cdn")
Runnable source as JSON, for any HTTP client: https://api.anyplot.ai/specs/funnel-meta-analysis/plotly/code. Any spec id and library id listed in llms-full.txt fit the same URL shape; every URL below is complete and callable.
{
  "spec_id": "funnel-meta-analysis",
  "language": "python",
  "library": "plotly",
  "page": "https://anyplot.ai/funnel-meta-analysis/python/plotly",
  "hub": "https://anyplot.ai/funnel-meta-analysis",
  "code_json": "https://api.anyplot.ai/specs/funnel-meta-analysis/plotly/code",
  "spec_json": "https://api.anyplot.ai/specs/funnel-meta-analysis",
  "render_light_png": "https://storage.googleapis.com/anyplot-images/plots/funnel-meta-analysis/python/plotly/plot-light.png",
  "render_dark_png": "https://storage.googleapis.com/anyplot-images/plots/funnel-meta-analysis/python/plotly/plot-dark.png",
  "interactive_light_html": "https://storage.googleapis.com/anyplot-images/plots/funnel-meta-analysis/python/plotly/plot-light.html",
  "interactive_dark_html": "https://storage.googleapis.com/anyplot-images/plots/funnel-meta-analysis/python/plotly/plot-dark.html",
  "quality_score": 88.0,
  "license": "MIT",
  "guide": "https://anyplot.ai/llms.txt"
}
Part of Meta-Analysis Funnel Plot for Publication Bias on anyplot.ai.