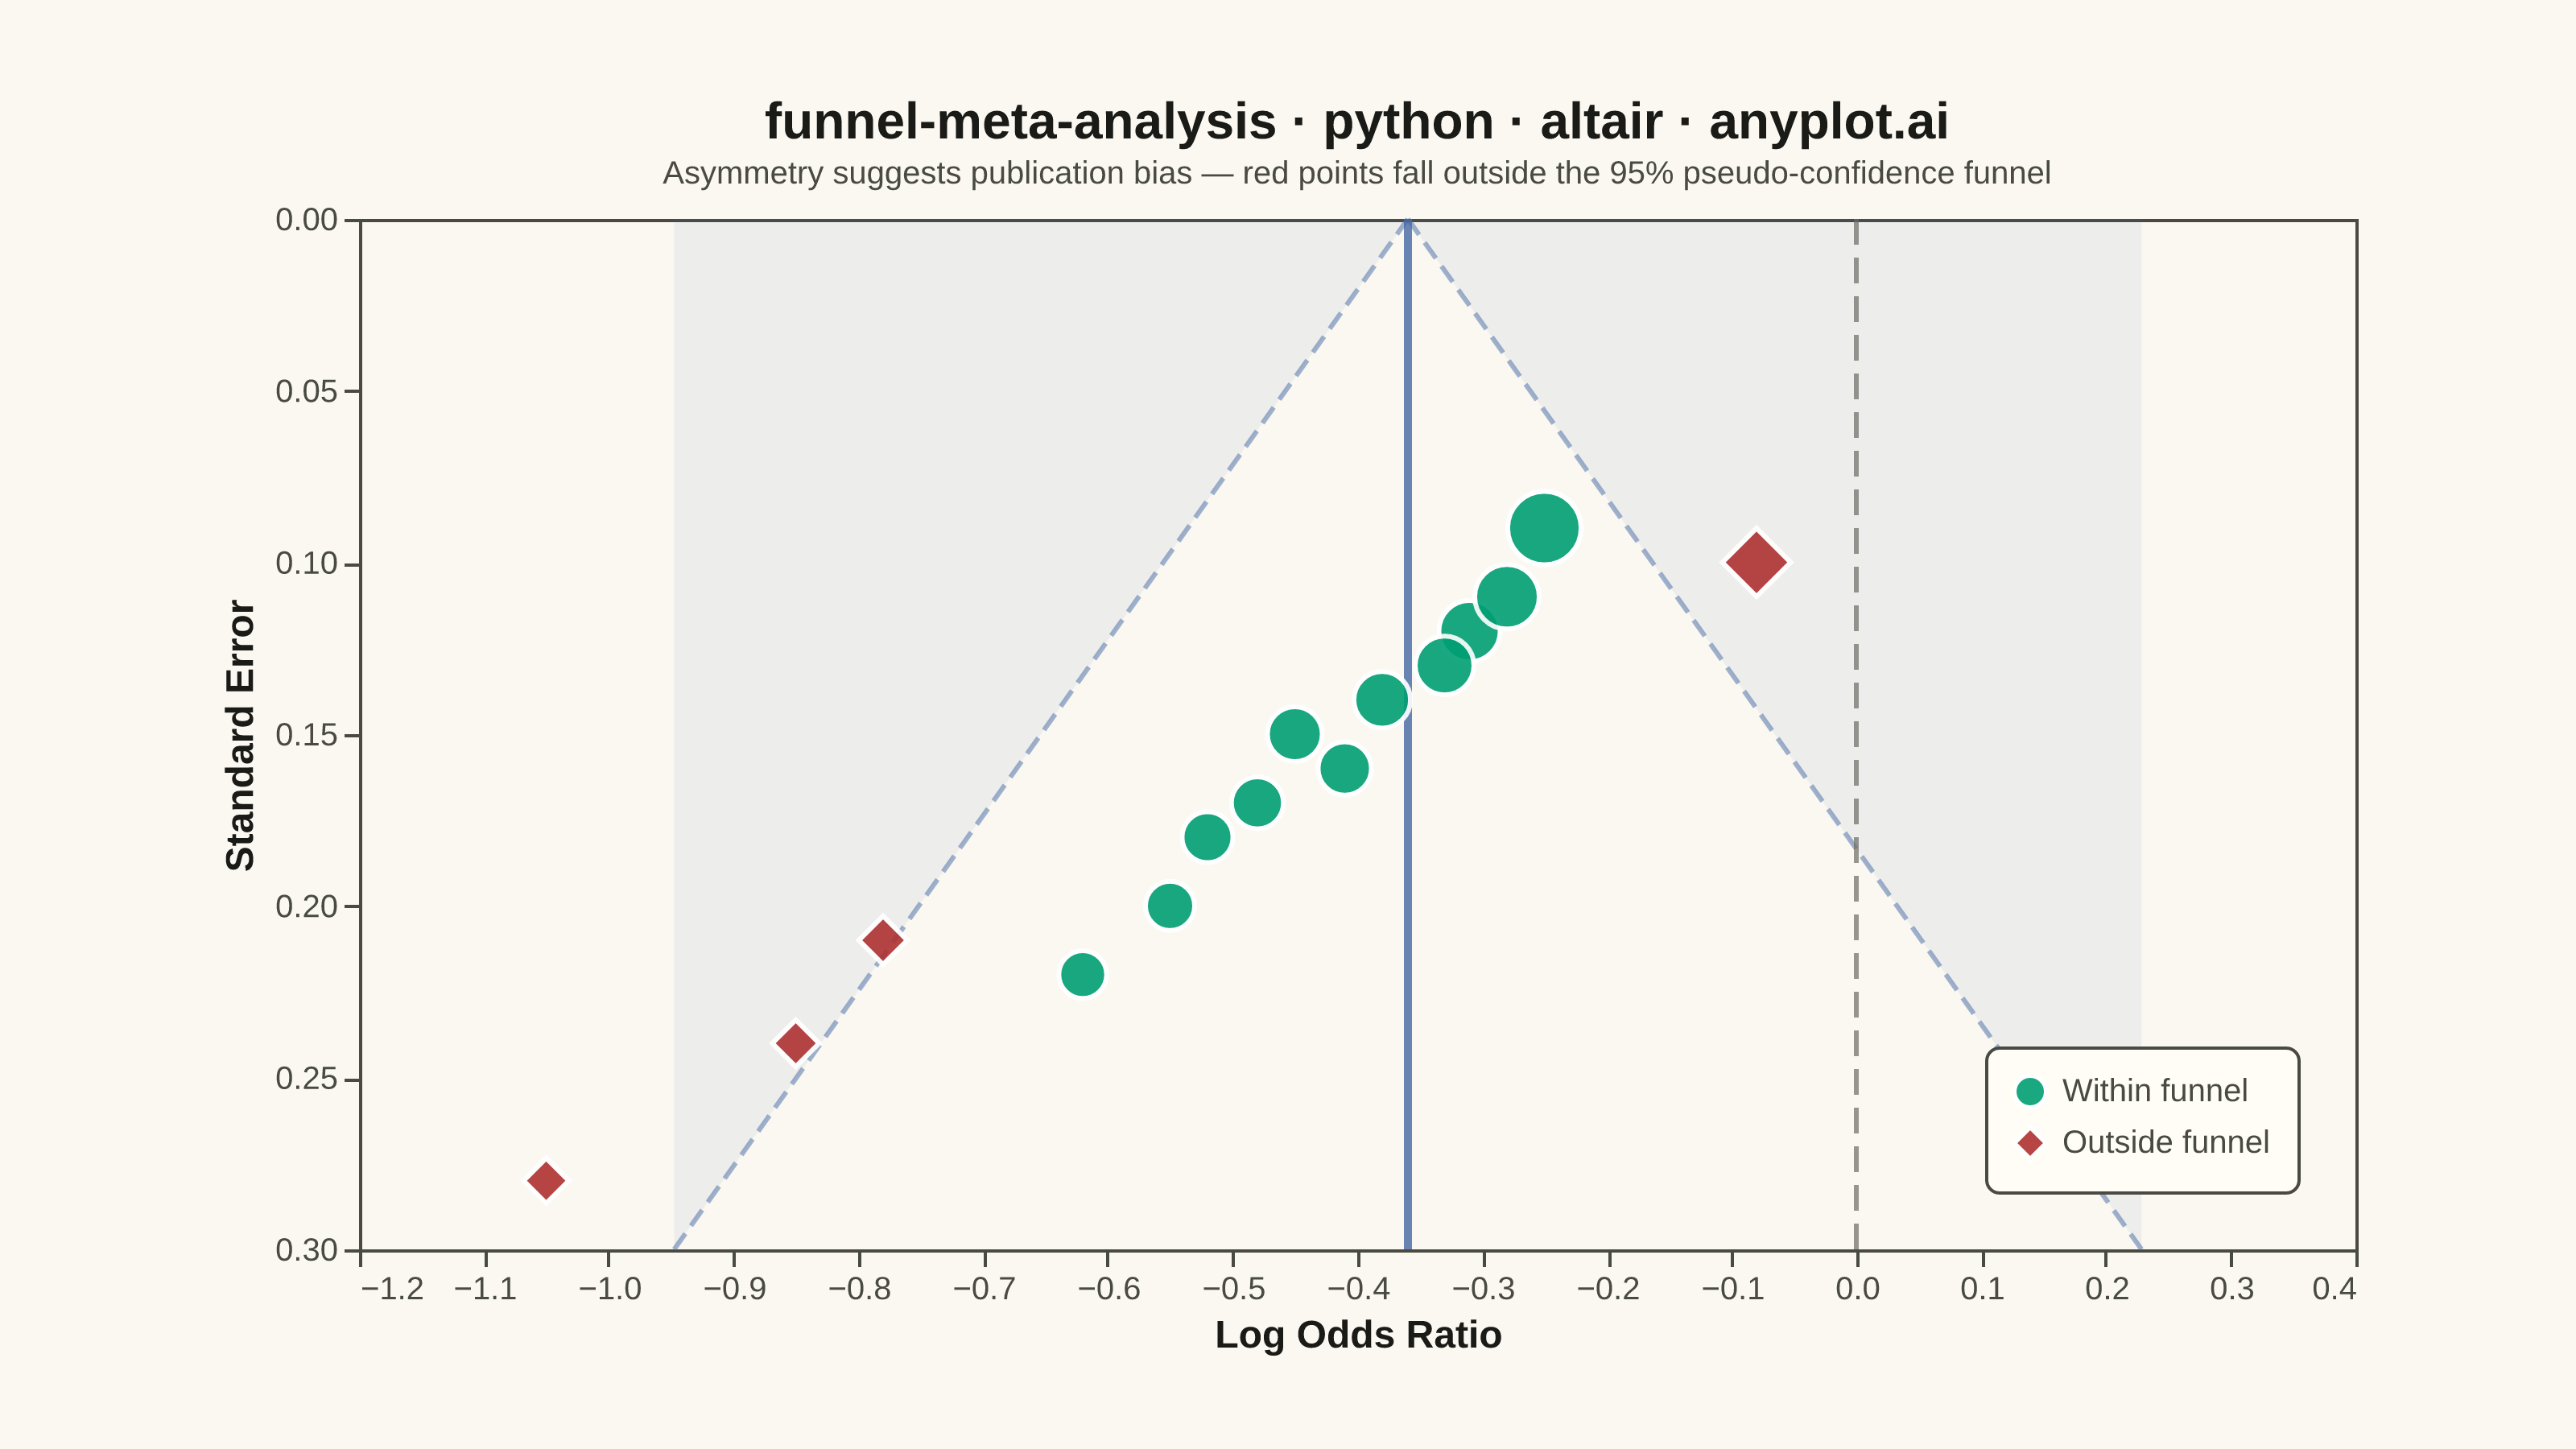
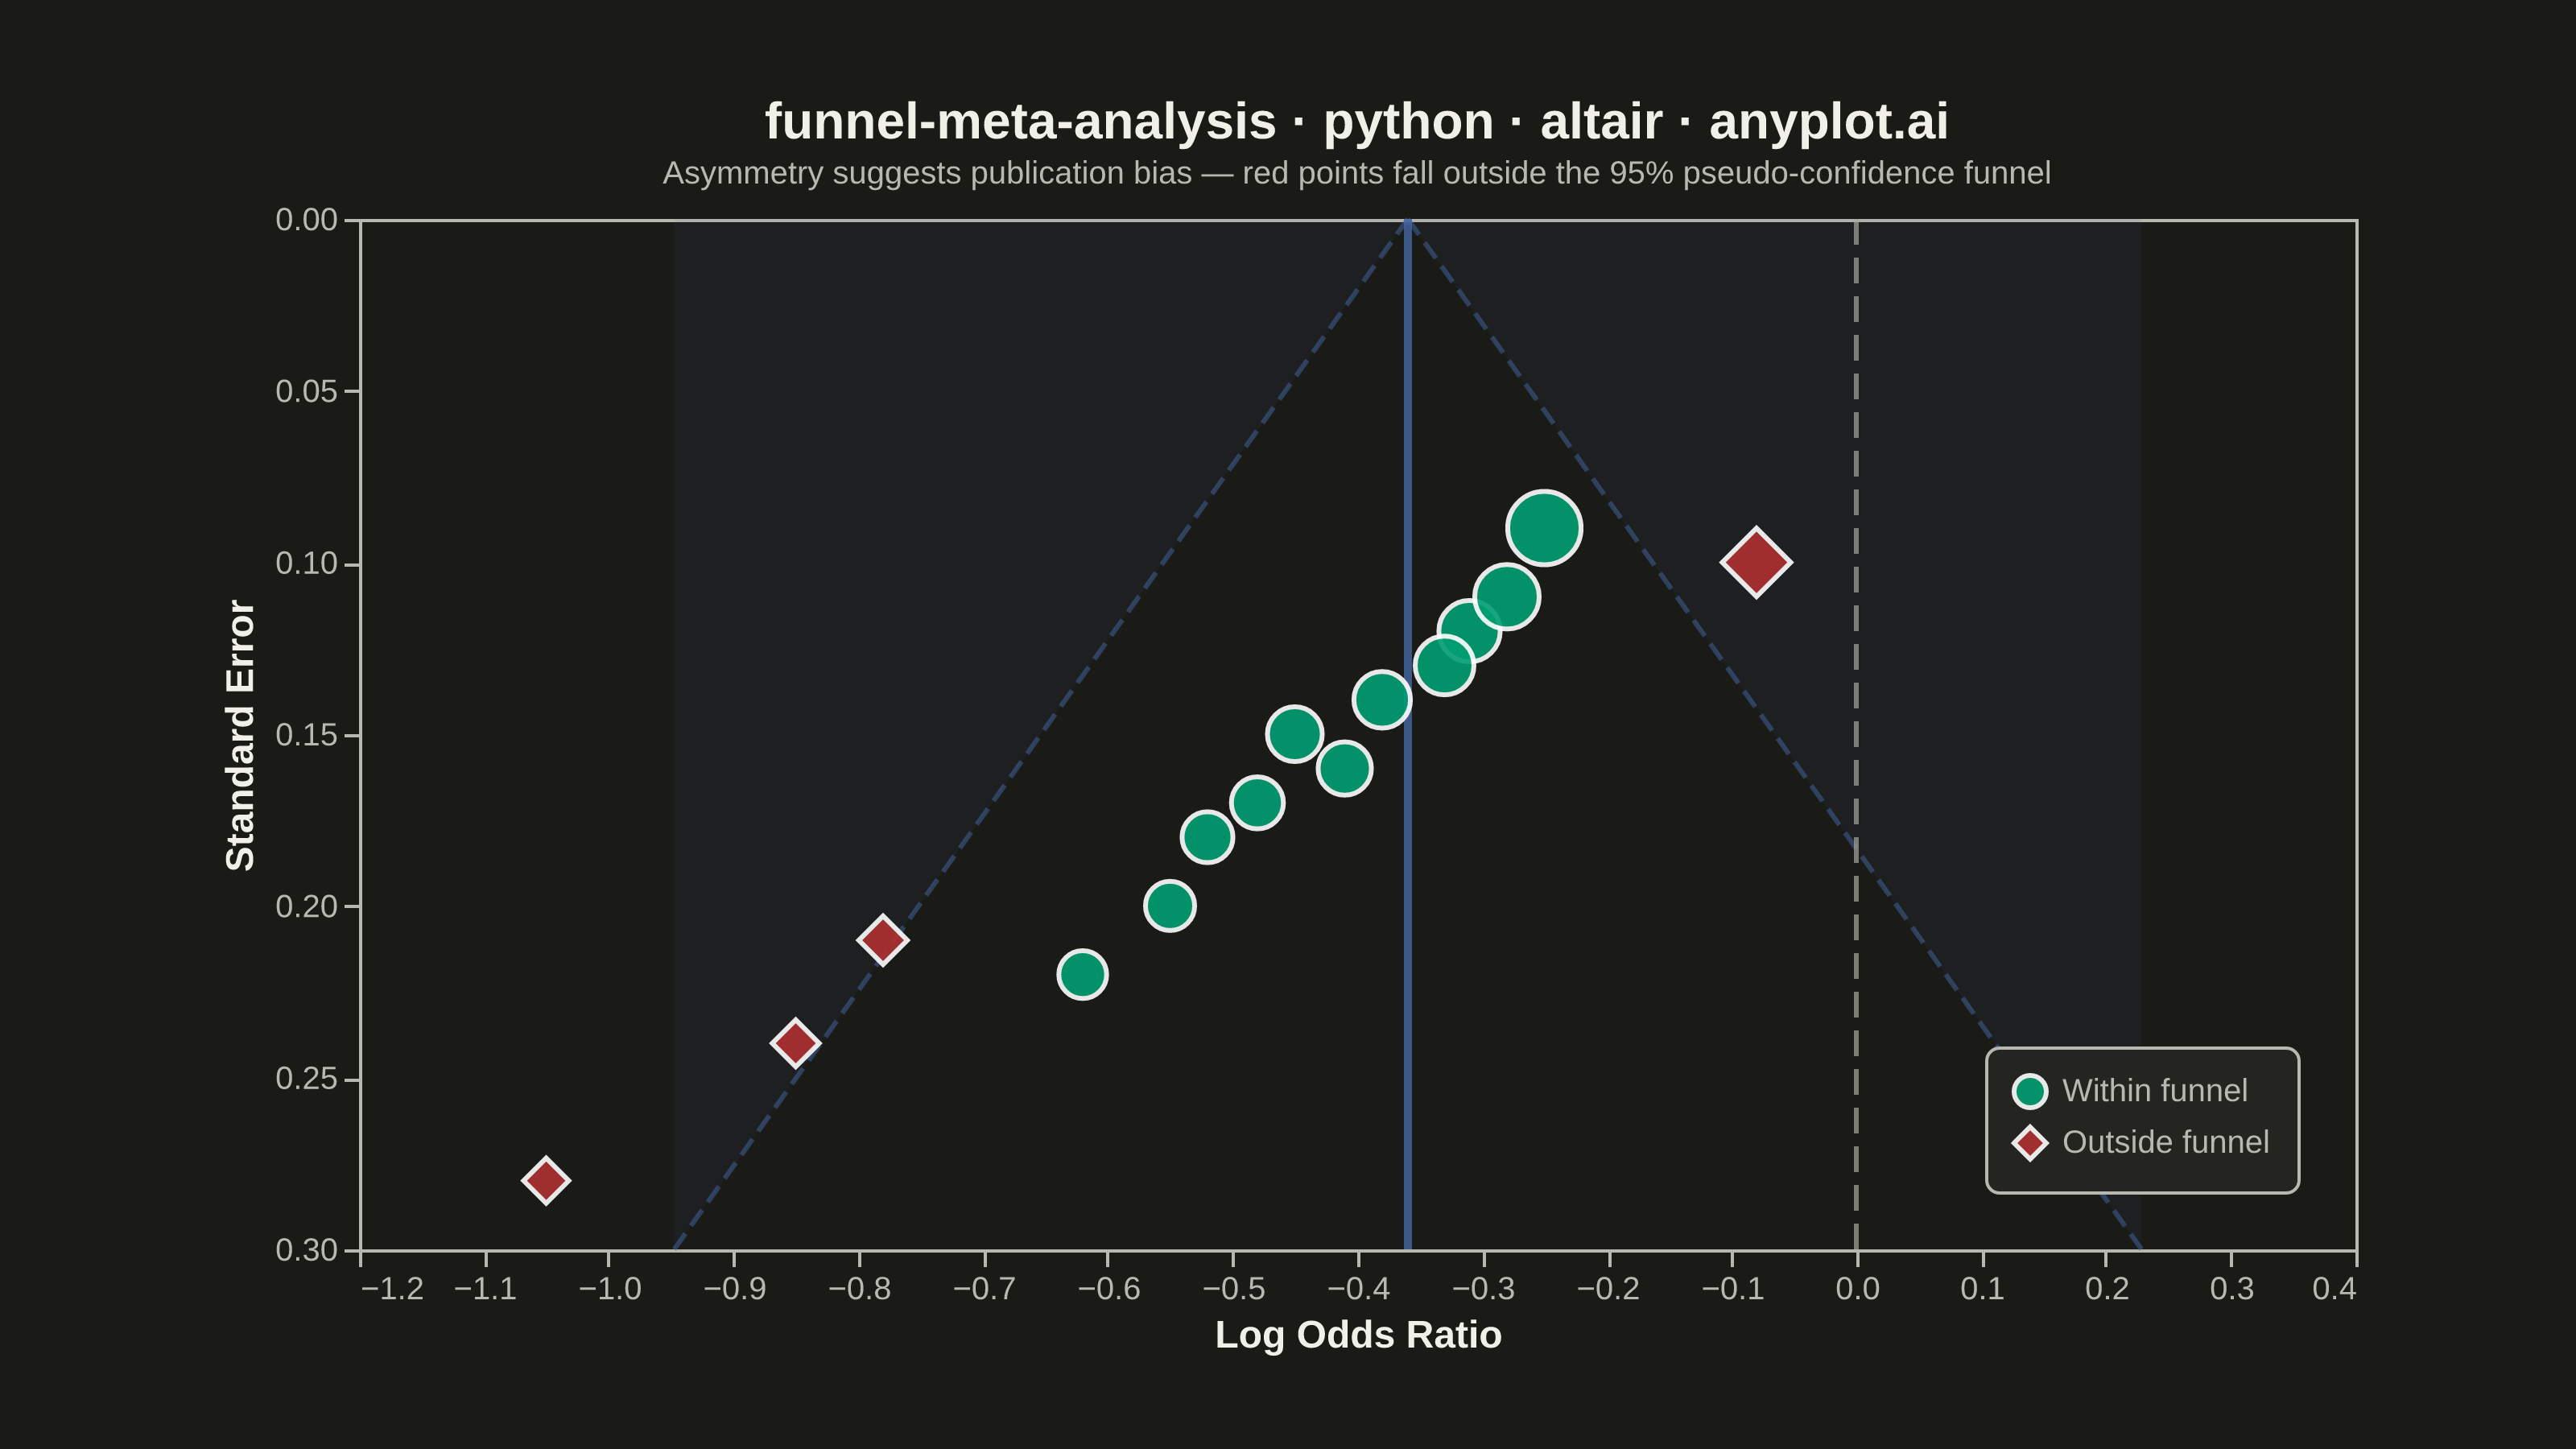
A funnel plot used in meta-analysis to assess publication bias by plotting individual study effect sizes against their precision (typically standard error). Studies scatter around a summary effect line, with pseudo 95% confidence limits forming an inverted funnel shape. In the absence of bias, studies distribute symmetrically around the summary effect; asymmetry suggests publication bias or systematic heterogeneity. This is a standard tool in systematic reviews and Cochrane-style meta-analyses.
""" anyplot.ai
funnel-meta-analysis: Meta-Analysis Funnel Plot for Publication Bias
Library: altair 6.2.1 | Python 3.13.13
Quality: 88/100 | Updated: 2026-06-10
"""

import importlib
import os
import sys

import numpy as np
import pandas as pd
from PIL import Image


# Drop script directory from sys.path so `altair` resolves the package, not this file
sys.path[:] = [p for p in sys.path if os.path.abspath(p or ".") != os.path.dirname(os.path.abspath(__file__))]
alt = importlib.import_module("altair")

# Theme setup — Imprint palette chrome
THEME = os.getenv("ANYPLOT_THEME", "light")
PAGE_BG = "#FAF8F1" if THEME == "light" else "#1A1A17"
ELEVATED_BG = "#FFFDF6" if THEME == "light" else "#242420"
INK = "#1A1A17" if THEME == "light" else "#F0EFE8"
INK_SOFT = "#4A4A44" if THEME == "light" else "#B8B7B0"
INK_MUTED = "#6B6A63" if THEME == "light" else "#A8A79F"

# Imprint categorical palette — semantic assignments
COLOR_WITHIN = "#009E73"  # brand green — studies within funnel (typical)
COLOR_OUTSIDE = "#AE3030"  # matte red — studies outside funnel (potential bias)
COLOR_FUNNEL = "#4467A3"  # blue — funnel confidence structure (reference)

# Data: 15 RCTs comparing drug vs placebo (log odds ratios)
np.random.seed(42)

studies = [
    "Adams 2016",
    "Baker 2017",
    "Chen 2017",
    "Davis 2018",
    "Evans 2018",
    "Foster 2019",
    "Garcia 2019",
    "Harris 2020",
    "Ibrahim 2020",
    "Jones 2021",
    "Klein 2021",
    "Lopez 2022",
    "Mitchell 2022",
    "Nelson 2023",
    "O'Brien 2023",
]

effect_sizes = np.array(
    [-0.52, -0.31, -0.85, -0.45, -0.08, -0.62, -0.38, -0.55, -0.41, -0.28, -0.78, -0.33, -0.48, -0.25, -1.05]
)

std_errors = np.array([0.18, 0.12, 0.24, 0.15, 0.10, 0.22, 0.14, 0.20, 0.16, 0.11, 0.21, 0.13, 0.17, 0.09, 0.28])

# Summary effect (inverse-variance weighted mean)
weights = 1.0 / std_errors**2
summary_effect = np.sum(weights * effect_sizes) / np.sum(weights)

# Classify studies as inside or outside the funnel (pseudo 95% CI)
lower_bound = summary_effect - 1.96 * std_errors
upper_bound = summary_effect + 1.96 * std_errors
inside_funnel = (effect_sizes >= lower_bound) & (effect_sizes <= upper_bound)

df = pd.DataFrame(
    {
        "study": studies,
        "effect_size": effect_sizes,
        "std_error": std_errors,
        "weight": weights / weights.max(),
        "region": np.where(inside_funnel, "Within funnel", "Outside funnel"),
    }
)

# Funnel confidence limits (pseudo 95% CI)
se_max = max(std_errors) + 0.02
se_range = np.linspace(0, se_max, 100)
funnel_df = pd.DataFrame(
    {"se": se_range, "lower": summary_effect - 1.96 * se_range, "upper": summary_effect + 1.96 * se_range}
)

y_scale = alt.Scale(domain=[se_max, 0])

# Funnel confidence area fill
funnel_area = (
    alt.Chart(funnel_df)
    .transform_fold(["lower", "upper"], as_=["bound", "value"])
    .mark_area(opacity=0.07, color=COLOR_FUNNEL)
    .encode(x=alt.X("value:Q"), y=alt.Y("se:Q", scale=y_scale), detail="bound:N")
)

# Funnel confidence bounds (dashed lines)
funnel_left = (
    alt.Chart(funnel_df)
    .mark_line(color=COLOR_FUNNEL, strokeDash=[6, 3], strokeWidth=1.5, opacity=0.5)
    .encode(x=alt.X("lower:Q"), y=alt.Y("se:Q", scale=y_scale))
)

funnel_right = (
    alt.Chart(funnel_df)
    .mark_line(color=COLOR_FUNNEL, strokeDash=[6, 3], strokeWidth=1.5, opacity=0.5)
    .encode(x=alt.X("upper:Q"), y=alt.Y("se:Q", scale=y_scale))
)

# Summary effect vertical line
summary_line = (
    alt.Chart(pd.DataFrame({"x": [summary_effect]}))
    .mark_rule(color=COLOR_FUNNEL, strokeWidth=2.5, opacity=0.8)
    .encode(x="x:Q")
)

# Null effect reference line at 0
null_line = (
    alt.Chart(pd.DataFrame({"x": [0]}))
    .mark_rule(color=INK_MUTED, strokeDash=[8, 4], strokeWidth=1.5, opacity=0.7)
    .encode(x="x:Q")
)

# Color-coded study points sized by inverse-variance weight
region_color = alt.Color(
    "region:N",
    scale=alt.Scale(domain=["Within funnel", "Outside funnel"], range=[COLOR_WITHIN, COLOR_OUTSIDE]),
    legend=alt.Legend(title=None, orient="bottom-right", labelFontSize=10, symbolSize=100),
)

# Redundant shape encoding for CVD accessibility (circle vs diamond)
region_shape = alt.Shape(
    "region:N", scale=alt.Scale(domain=["Within funnel", "Outside funnel"], range=["circle", "diamond"]), legend=None
)

points = (
    alt.Chart(df)
    .mark_point(filled=True, stroke="white", strokeWidth=1.5, opacity=0.9)
    .encode(
        x=alt.X("effect_size:Q", title="Log Odds Ratio", scale=alt.Scale(domain=[-1.15, 0.35])),
        y=alt.Y("std_error:Q", title="Standard Error", scale=y_scale),
        color=region_color,
        shape=region_shape,
        size=alt.Size("weight:Q", scale=alt.Scale(range=[160, 520]), legend=None),
        tooltip=[
            alt.Tooltip("study:N", title="Study"),
            alt.Tooltip("effect_size:Q", title="Log OR", format=".2f"),
            alt.Tooltip("std_error:Q", title="SE", format=".3f"),
            alt.Tooltip("region:N", title="Region"),
        ],
    )
)

chart = (
    alt.layer(funnel_area, funnel_left, funnel_right, null_line, summary_line, points)
    .properties(
        width=620,
        height=320,
        background=PAGE_BG,
        title=alt.Title(
            "funnel-meta-analysis · python · altair · anyplot.ai",
            fontSize=16,
            anchor="middle",
            color=INK,
            subtitle="Asymmetry suggests publication bias — red points fall outside the 95% pseudo-confidence funnel",
            subtitleFontSize=10,
            subtitleColor=INK_SOFT,
        ),
    )
    .configure_view(fill=PAGE_BG, stroke=INK_SOFT, continuousWidth=620, continuousHeight=320)
    .configure_axis(
        labelFontSize=10,
        titleFontSize=12,
        titleColor=INK,
        labelColor=INK_SOFT,
        domainColor=INK_SOFT,
        tickColor=INK_SOFT,
        gridColor=INK,
        gridOpacity=0.15,
    )
    .configure_axisX(grid=False)
    .configure_axisY(grid=False)
    .configure_legend(
        padding=8, cornerRadius=4, fillColor=ELEVATED_BG, strokeColor=INK_SOFT, labelColor=INK_SOFT, labelFontSize=10
    )
)

chart.save(f"plot-{THEME}.png", scale_factor=4.0)

# Pad-only to exact canvas target (3200 × 1800 landscape)
TW, TH = 3200, 1800
_img = Image.open(f"plot-{THEME}.png").convert("RGB")
_w, _h = _img.size
if _w > TW or _h > TH:
    raise SystemExit(
        f"altair vl-convert produced {_w}×{_h}, exceeds target {TW}×{TH}. "
        "Shrink chart .properties(width=, height=) values and re-render."
    )
if _w < TW or _h < TH:
    _canvas = Image.new("RGB", (TW, TH), PAGE_BG)
    _canvas.paste(_img, ((TW - _w) // 2, (TH - _h) // 2))
    _canvas.save(f"plot-{THEME}.png")

chart.save(f"plot-{THEME}.html")
Runnable source as JSON, for any HTTP client: https://api.anyplot.ai/specs/funnel-meta-analysis/altair/code. Any spec id and library id listed in llms-full.txt fit the same URL shape; every URL below is complete and callable.
{
  "spec_id": "funnel-meta-analysis",
  "language": "python",
  "library": "altair",
  "page": "https://anyplot.ai/funnel-meta-analysis/python/altair",
  "hub": "https://anyplot.ai/funnel-meta-analysis",
  "code_json": "https://api.anyplot.ai/specs/funnel-meta-analysis/altair/code",
  "spec_json": "https://api.anyplot.ai/specs/funnel-meta-analysis",
  "render_light_png": "https://storage.googleapis.com/anyplot-images/plots/funnel-meta-analysis/python/altair/plot-light.png",
  "render_dark_png": "https://storage.googleapis.com/anyplot-images/plots/funnel-meta-analysis/python/altair/plot-dark.png",
  "interactive_light_html": "https://storage.googleapis.com/anyplot-images/plots/funnel-meta-analysis/python/altair/plot-light.html",
  "interactive_dark_html": "https://storage.googleapis.com/anyplot-images/plots/funnel-meta-analysis/python/altair/plot-dark.html",
  "quality_score": 88.0,
  "license": "MIT",
  "guide": "https://anyplot.ai/llms.txt"
}
Part of Meta-Analysis Funnel Plot for Publication Bias on anyplot.ai.