The same plot in 14 other libraries — JavaScript: Chart.js, D3.js, Apache ECharts, Highcharts; Python: Altair, Bokeh, lets-plot, Matplotlib, Plotly, plotnine, Pygal, Seaborn; R: ggplot2; Julia: Makie.jl. Compare all 15 side by side: Meta-Analysis Funnel Plot for Publication Bias in Python, R, Julia and JavaScript.
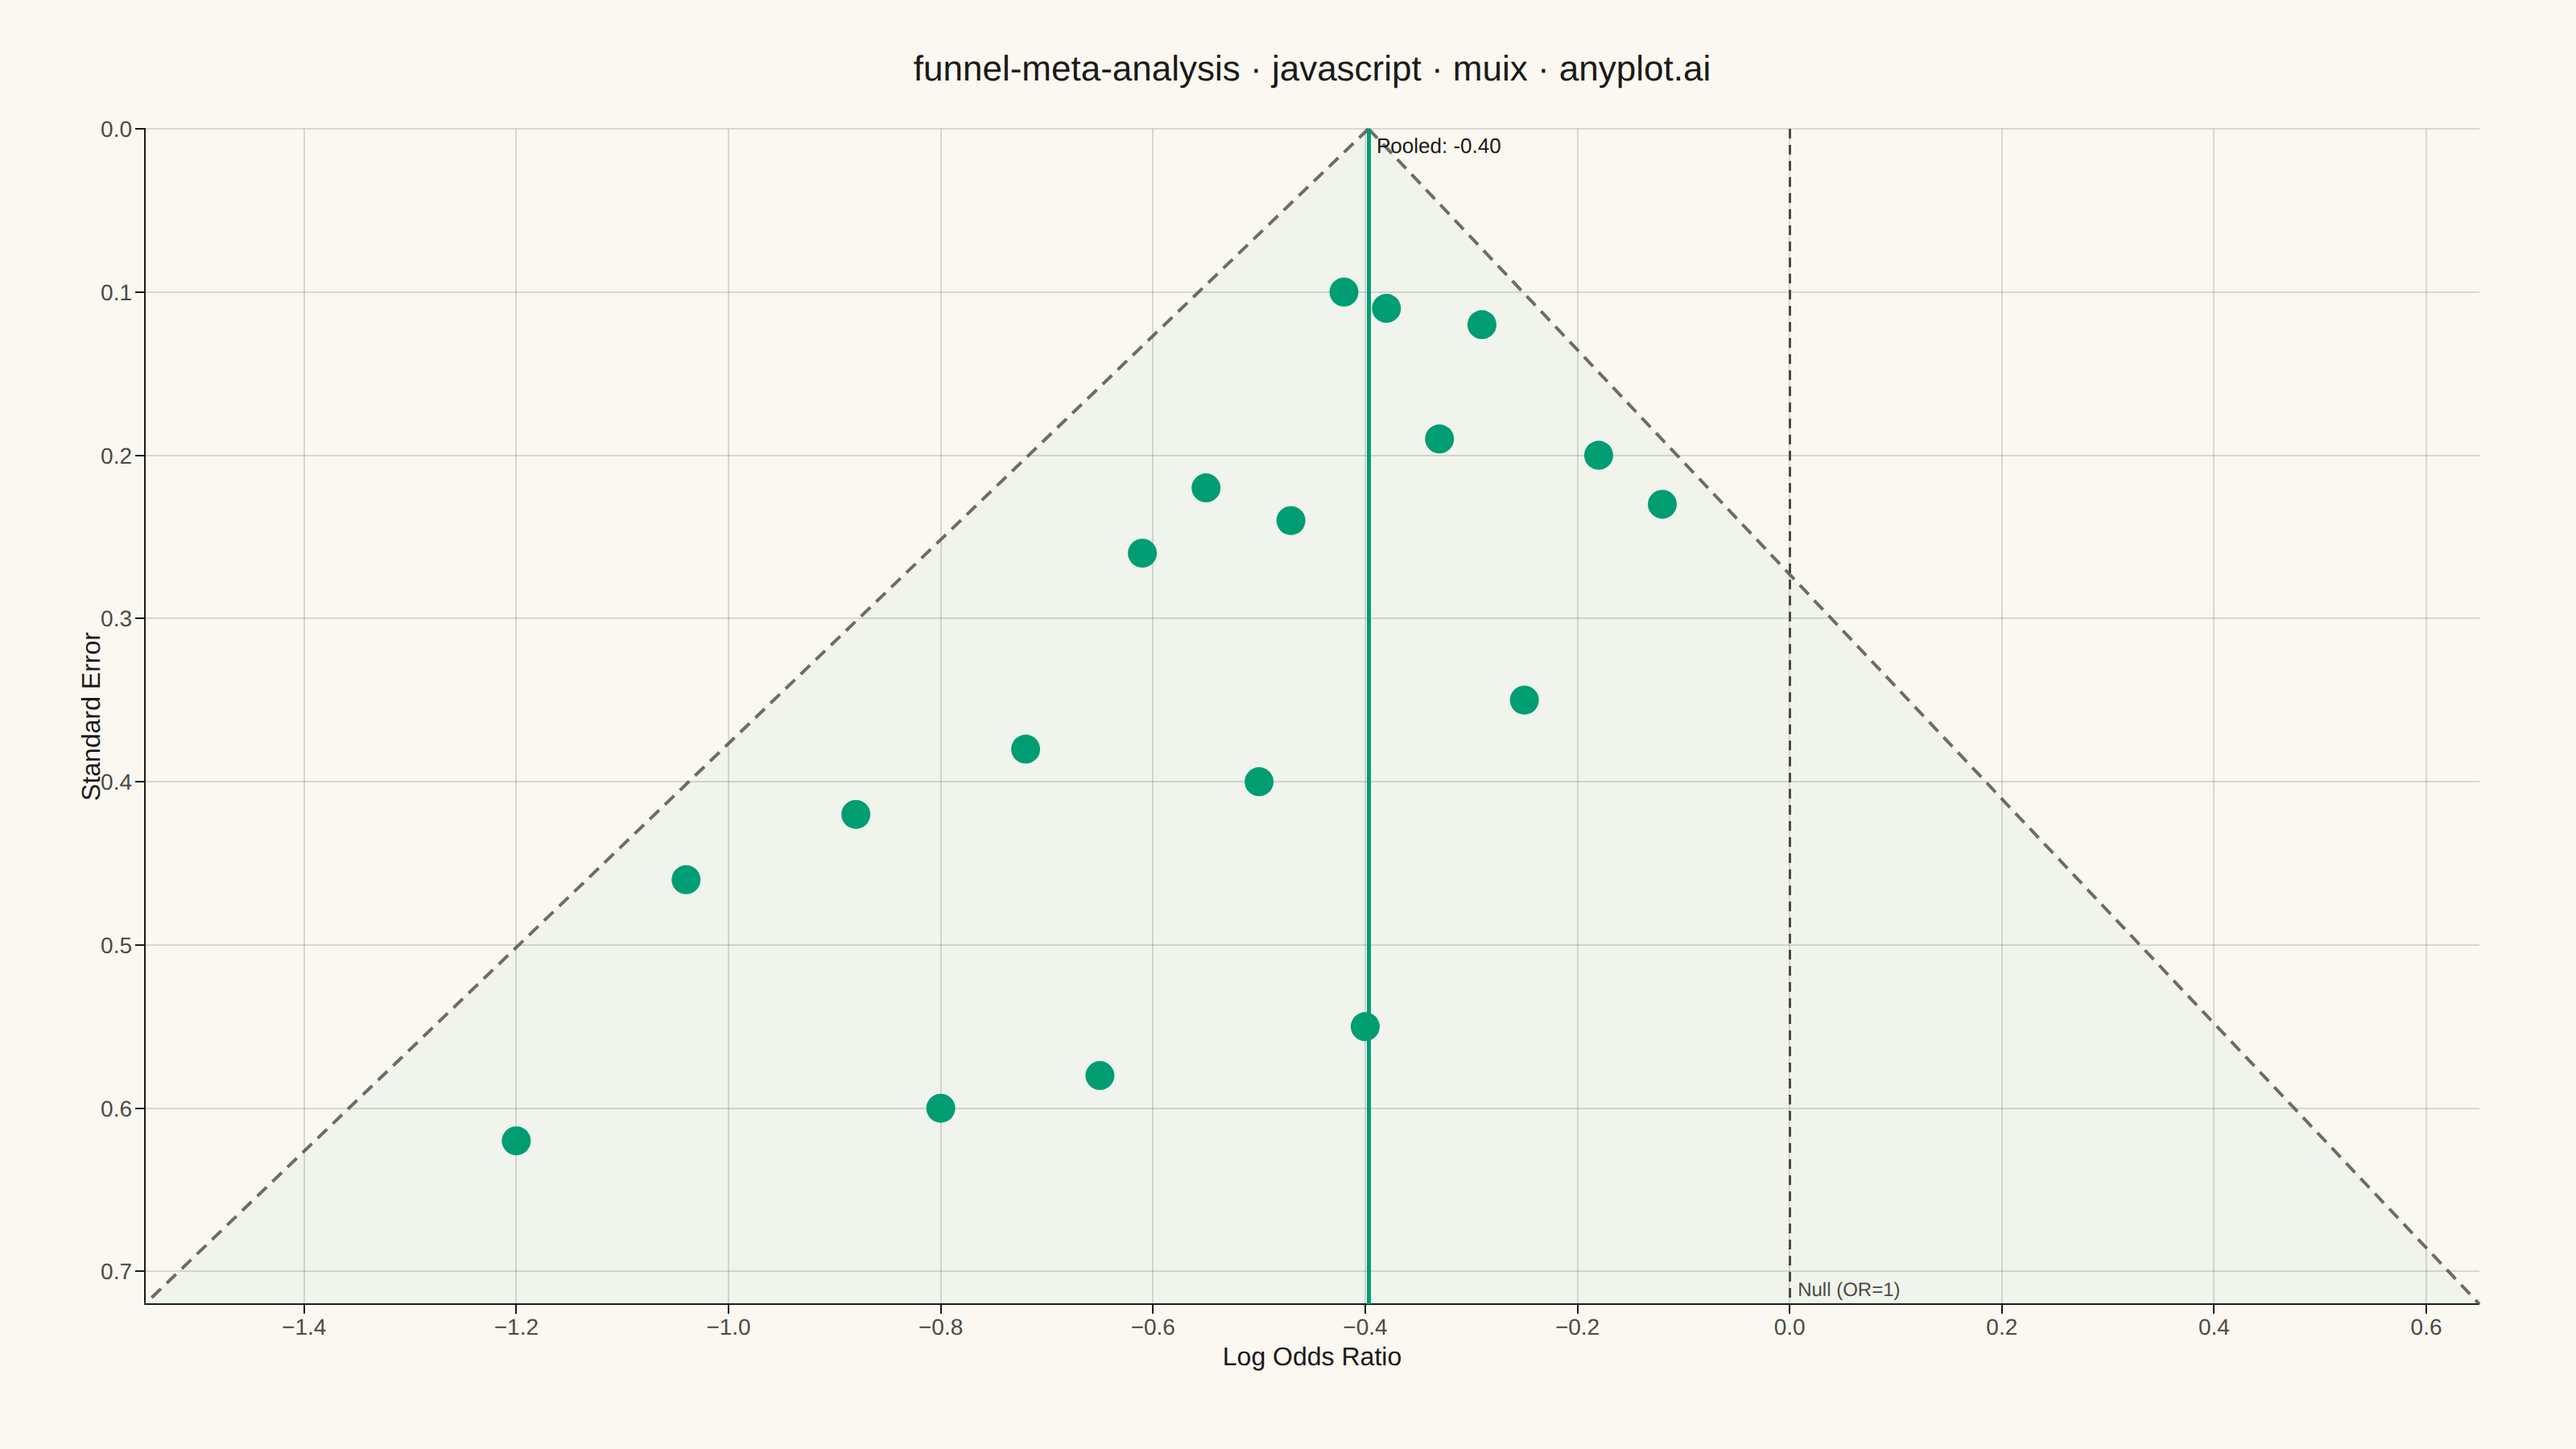
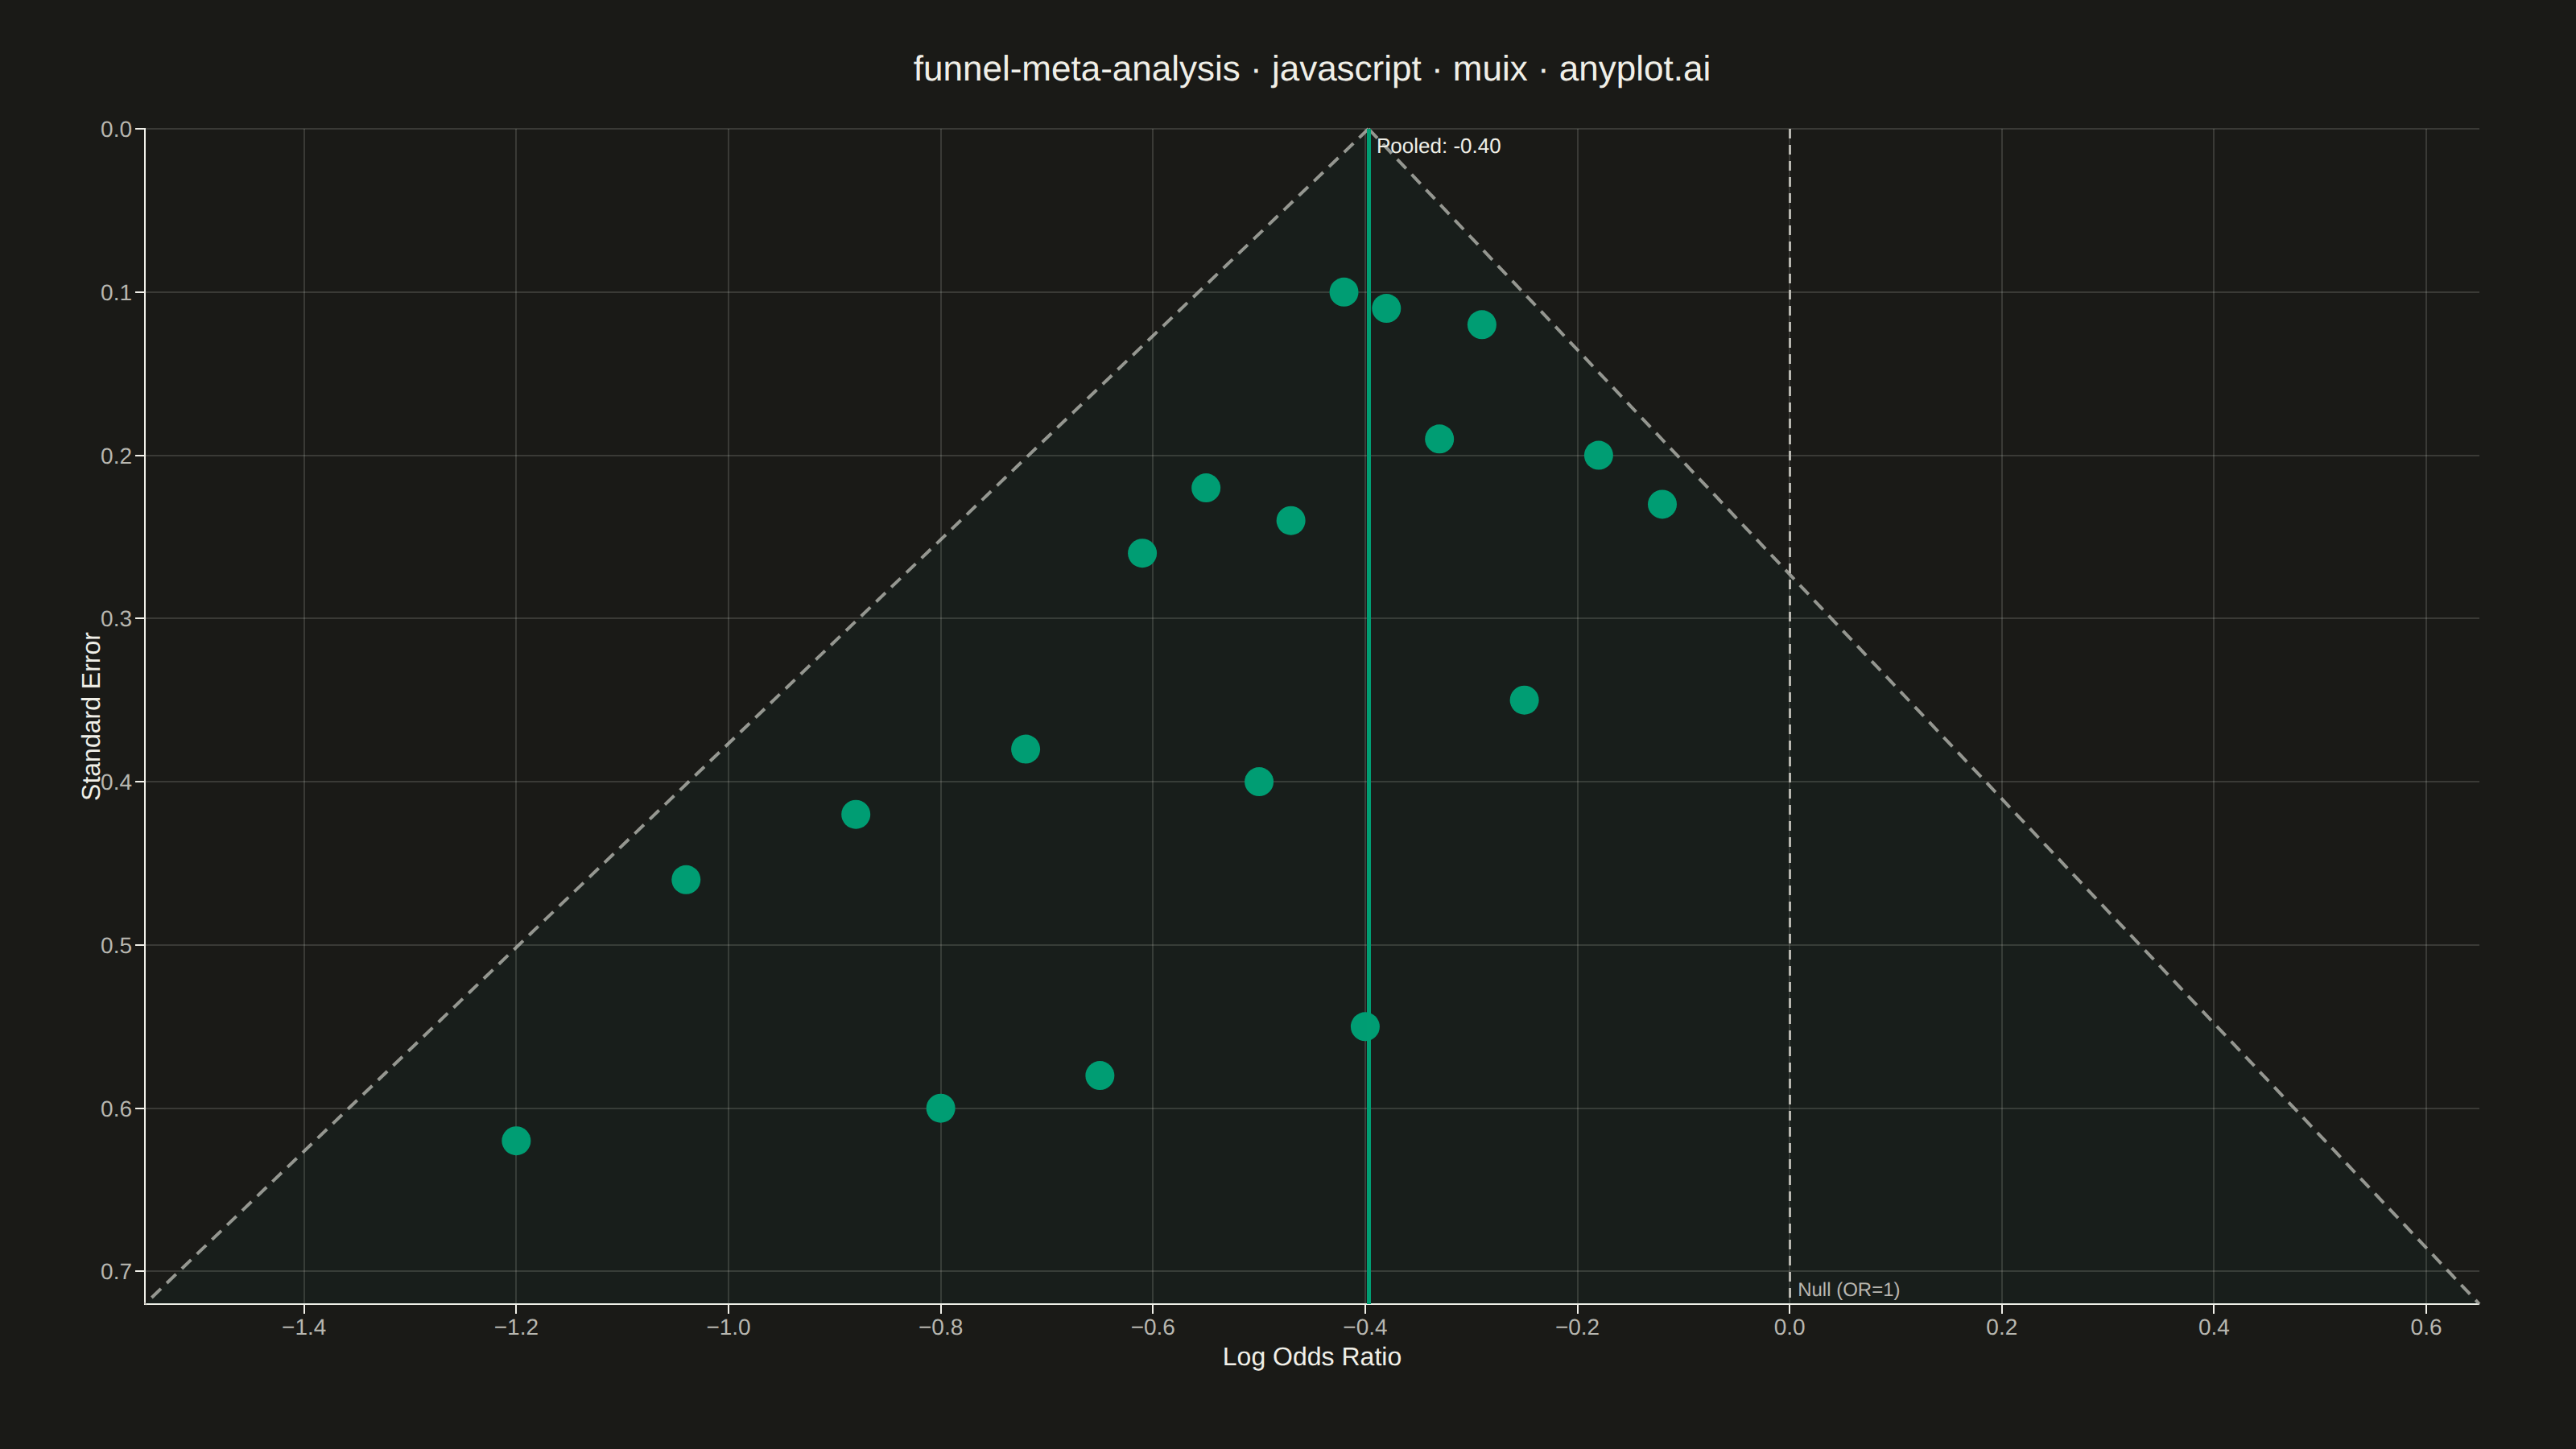
A funnel plot used in meta-analysis to assess publication bias by plotting individual study effect sizes against their precision (typically standard error). Studies scatter around a summary effect line, with pseudo 95% confidence limits forming an inverted funnel shape. In the absence of bias, studies distribute symmetrically around the summary effect; asymmetry suggests publication bias or systematic heterogeneity. This is a standard tool in systematic reviews and Cochrane-style meta-analyses.
// anyplot.ai
// funnel-meta-analysis: Meta-Analysis Funnel Plot for Publication Bias
// Library: muix 7.29.1 | JavaScript 22.22.3
// Quality: 91/100 | Created: 2026-06-10
import { ScatterChart } from "@mui/x-charts/ScatterChart";
import { ChartsReferenceLine } from "@mui/x-charts/ChartsReferenceLine";
import { useDrawingArea, useXScale, useYScale } from "@mui/x-charts/hooks";

const t = window.ANYPLOT_TOKENS;

// --- Data (in-memory, deterministic) -----------------------------------------
// Meta-analysis of 18 RCTs: antihypertensive therapy vs placebo on major CV events
// Log odds ratios (negative = protective effect) with standard errors
const studies = [
  // Large trials — low SE, cluster tightly around pooled effect
  { id: "s01", x: -0.42, y: 0.10 },
  { id: "s02", x: -0.29, y: 0.12 },
  { id: "s03", x: -0.38, y: 0.11 },
  // Medium trials
  { id: "s04", x: -0.55, y: 0.22 },
  { id: "s05", x: -0.18, y: 0.20 },
  { id: "s06", x: -0.47, y: 0.24 },
  { id: "s07", x: -0.33, y: 0.19 },
  { id: "s08", x: -0.61, y: 0.26 },
  { id: "s09", x: -0.12, y: 0.23 },
  // Small trials — wider scatter; asymmetry: fewer on the positive side
  { id: "s10", x: -0.72, y: 0.38 },
  { id: "s11", x: -0.25, y: 0.35 },
  { id: "s12", x: -0.88, y: 0.42 },
  { id: "s13", x: -0.50, y: 0.40 },
  { id: "s14", x: -1.04, y: 0.46 },
  // Very small trials
  { id: "s15", x: -0.65, y: 0.58 },
  { id: "s16", x: -1.20, y: 0.62 },
  { id: "s17", x: -0.40, y: 0.55 },
  { id: "s18", x: -0.80, y: 0.60 },
];

// Inverse-variance weighted pooled effect
const weights = studies.map((s) => 1 / (s.y * s.y));
const totalWeight = weights.reduce((a, b) => a + b, 0);
const pooledEffect = studies.reduce((sum, s, i) => sum + s.x * weights[i], 0) / totalWeight;

// Axis extents — generous padding around data range
const maxSE = 0.72; // y-axis max (bottom)
const xMin = -1.55;
const xMax = 0.65;

// Funnel cone: x = pooled ± 1.96 * SE at each SE level
// At SE=0 → x = pooled (apex); at SE=maxSE → x = pooled ± 1.96*maxSE (base)
const funnelHalfWidth = 1.96 * maxSE;

// --- Chart title (mandatory anyplot title format) ----------------------------
const TITLE = "funnel-meta-analysis · javascript · muix · anyplot.ai";

function ChartTitle() {
  const { left, top, width } = useDrawingArea();
  return (
    <text
      x={left + width / 2}
      y={top * 0.55}
      textAnchor="middle"
      dominantBaseline="middle"
      fill={t.ink}
      fontSize={22}
      fontWeight="500"
      fontFamily="sans-serif"
    >
      {TITLE}
    </text>
  );
}

// --- Funnel cone overlay (custom SVG using drawing-area + scales) ------------
function FunnelCone() {
  const { left, top, width, height } = useDrawingArea();
  const xScale = useXScale();
  const yScale = useYScale();

  // SVG pixel coordinates for funnel apex (SE=0) and base (SE=maxSE)
  const apexX = xScale(pooledEffect);
  const apexY = yScale(0);
  const baseY = yScale(maxSE);
  const baseXLeft = xScale(pooledEffect - funnelHalfWidth);
  const baseXRight = xScale(pooledEffect + funnelHalfWidth);

  // Clamp to drawing area
  const clampX = (x) => Math.max(left, Math.min(left + width, x));

  const cLeft = clampX(baseXLeft);
  const cRight = clampX(baseXRight);

  const lineStyle = {
    stroke: t.inkSoft,
    strokeWidth: 2,
    strokeDasharray: "8 5",
    fill: "none",
    opacity: 0.8,
  };

  return (
    <g>
      {/* Funnel left boundary: apex → lower-left */}
      <line
        x1={apexX}
        y1={apexY}
        x2={cLeft}
        y2={baseY}
        style={lineStyle}
      />
      {/* Funnel right boundary: apex → lower-right */}
      <line
        x1={apexX}
        y1={apexY}
        x2={cRight}
        y2={baseY}
        style={lineStyle}
      />
      {/* Shaded funnel region (subtle) */}
      <polygon
        points={`${apexX},${apexY} ${cLeft},${baseY} ${cRight},${baseY}`}
        fill={t.palette[0]}
        fillOpacity={0.04}
      />
    </g>
  );
}

// --- Chart (default-exported component) -------------------------------------
export default function Chart() {
  const w = window.ANYPLOT_SIZE.width;
  const h = window.ANYPLOT_SIZE.height;

  return (
    <ScatterChart
      width={w}
      height={h}
      skipAnimation
      margin={{ top: 80, right: 60, bottom: 90, left: 90 }}
      xAxis={[
        {
          id: "xMain",
          scaleType: "linear",
          min: xMin,
          max: xMax,
          label: "Log Odds Ratio",
          tickNumber: 7,
          tickLabelStyle: { fill: t.inkSoft, fontSize: 14 },
          labelStyle: { fill: t.ink, fontSize: 16 },
        },
      ]}
      yAxis={[
        {
          id: "yMain",
          scaleType: "linear",
          min: 0,
          max: maxSE,
          reverse: true,
          label: "Standard Error",
          tickNumber: 6,
          tickLabelStyle: { fill: t.inkSoft, fontSize: 14 },
          labelStyle: { fill: t.ink, fontSize: 16 },
        },
      ]}
      series={[
        {
          type: "scatter",
          data: studies,
          color: t.palette[0],
          markerSize: 9,
          label: "Individual study",
        },
      ]}
      grid={{ vertical: true, horizontal: true }}
      slotProps={{
        legend: { hidden: true },
      }}
    >
      {/* Mandatory plot title */}
      <ChartTitle />

      {/* Funnel cone lines drawn in data-coordinate space */}
      <FunnelCone />

      {/* Pooled effect — solid vertical reference line */}
      <ChartsReferenceLine
        x={pooledEffect}
        lineStyle={{
          stroke: t.palette[0],
          strokeWidth: 2.5,
          strokeDasharray: "0",
        }}
        labelStyle={{ fill: t.ink, fontSize: 13 }}
        label={`Pooled: ${pooledEffect.toFixed(2)}`}
        labelAlign="start"
      />

      {/* Null effect (log OR = 0) — dashed reference line */}
      <ChartsReferenceLine
        x={0}
        lineStyle={{
          stroke: t.inkSoft,
          strokeWidth: 1.5,
          strokeDasharray: "6 4",
        }}
        labelStyle={{ fill: t.inkSoft, fontSize: 12 }}
        label="Null (OR=1)"
        labelAlign="end"
      />
    </ScatterChart>
  );
}
Runnable source as JSON, for any HTTP client: https://api.anyplot.ai/specs/funnel-meta-analysis/muix/code. Any spec id and library id listed in llms-full.txt fit the same URL shape; every URL below is complete and callable.
{
  "spec_id": "funnel-meta-analysis",
  "language": "javascript",
  "library": "muix",
  "page": "https://anyplot.ai/funnel-meta-analysis/javascript/muix",
  "hub": "https://anyplot.ai/funnel-meta-analysis",
  "code_json": "https://api.anyplot.ai/specs/funnel-meta-analysis/muix/code",
  "spec_json": "https://api.anyplot.ai/specs/funnel-meta-analysis",
  "render_light_png": "https://storage.googleapis.com/anyplot-images/plots/funnel-meta-analysis/javascript/muix/plot-light.png",
  "render_dark_png": "https://storage.googleapis.com/anyplot-images/plots/funnel-meta-analysis/javascript/muix/plot-dark.png",
  "interactive_light_html": "https://storage.googleapis.com/anyplot-images/plots/funnel-meta-analysis/javascript/muix/plot-light.html",
  "interactive_dark_html": "https://storage.googleapis.com/anyplot-images/plots/funnel-meta-analysis/javascript/muix/plot-dark.html",
  "quality_score": 91.0,
  "license": "MIT",
  "guide": "https://anyplot.ai/llms.txt"
}
Part of Meta-Analysis Funnel Plot for Publication Bias on anyplot.ai.