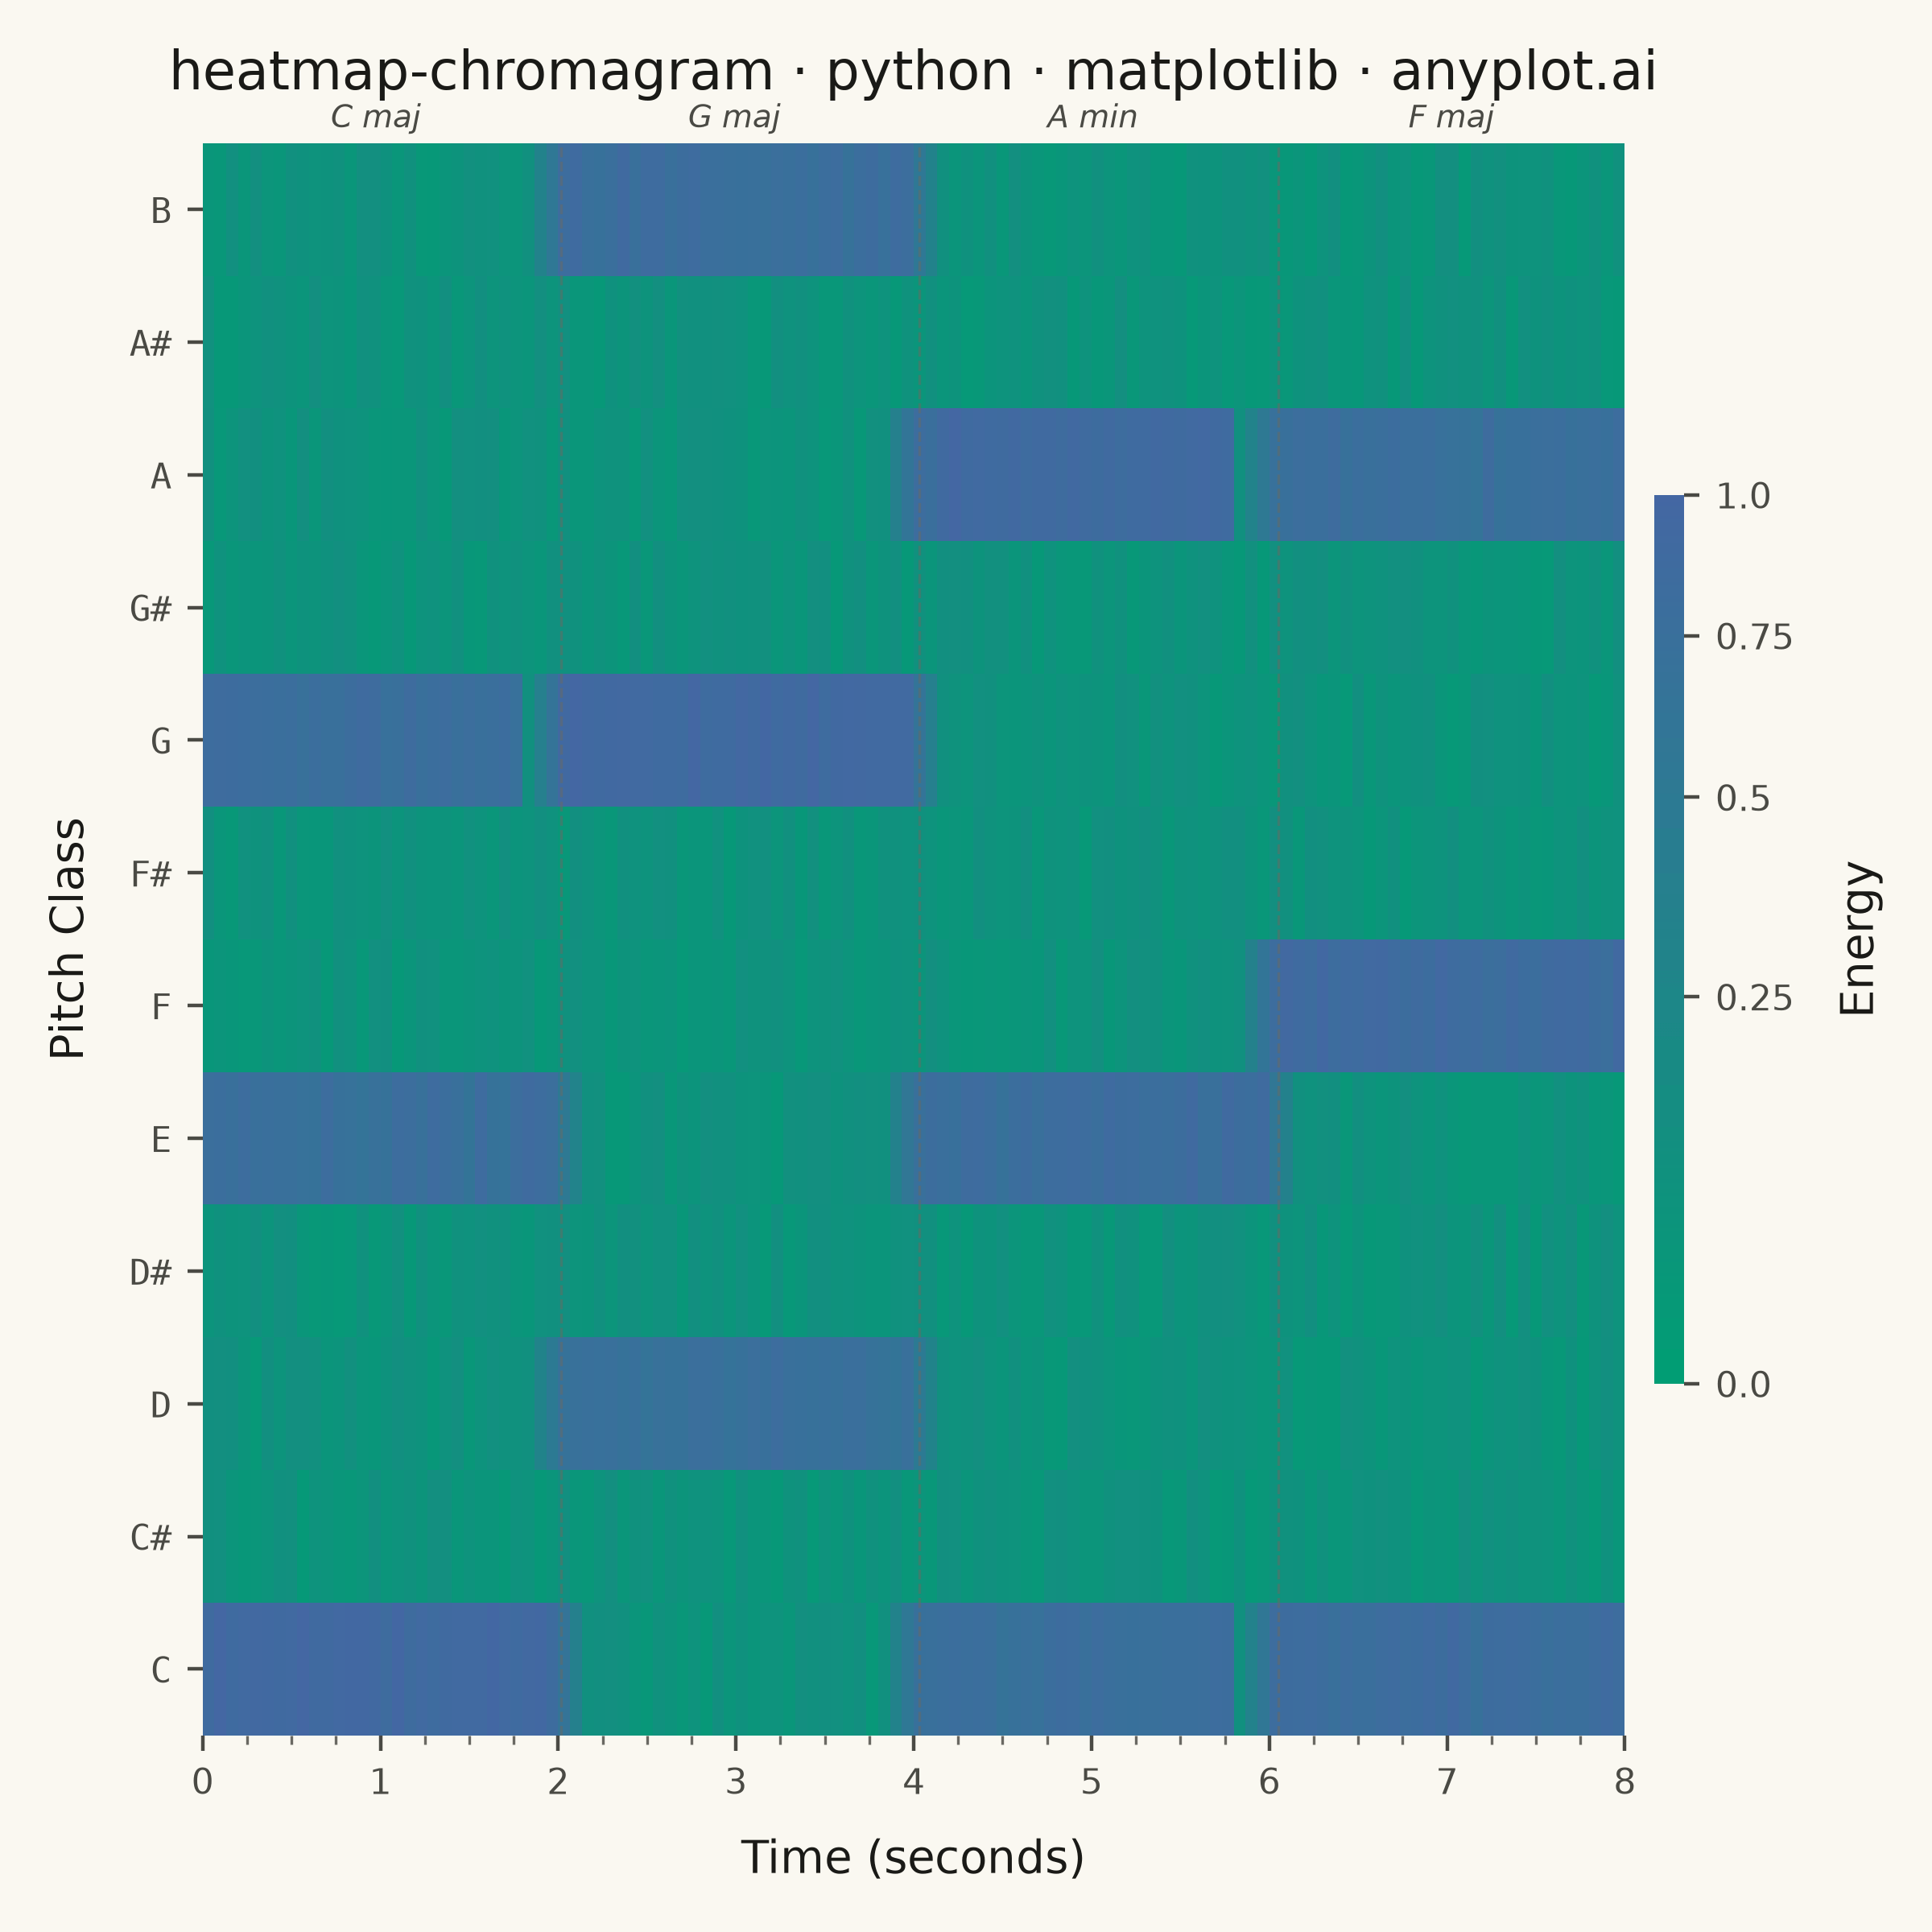
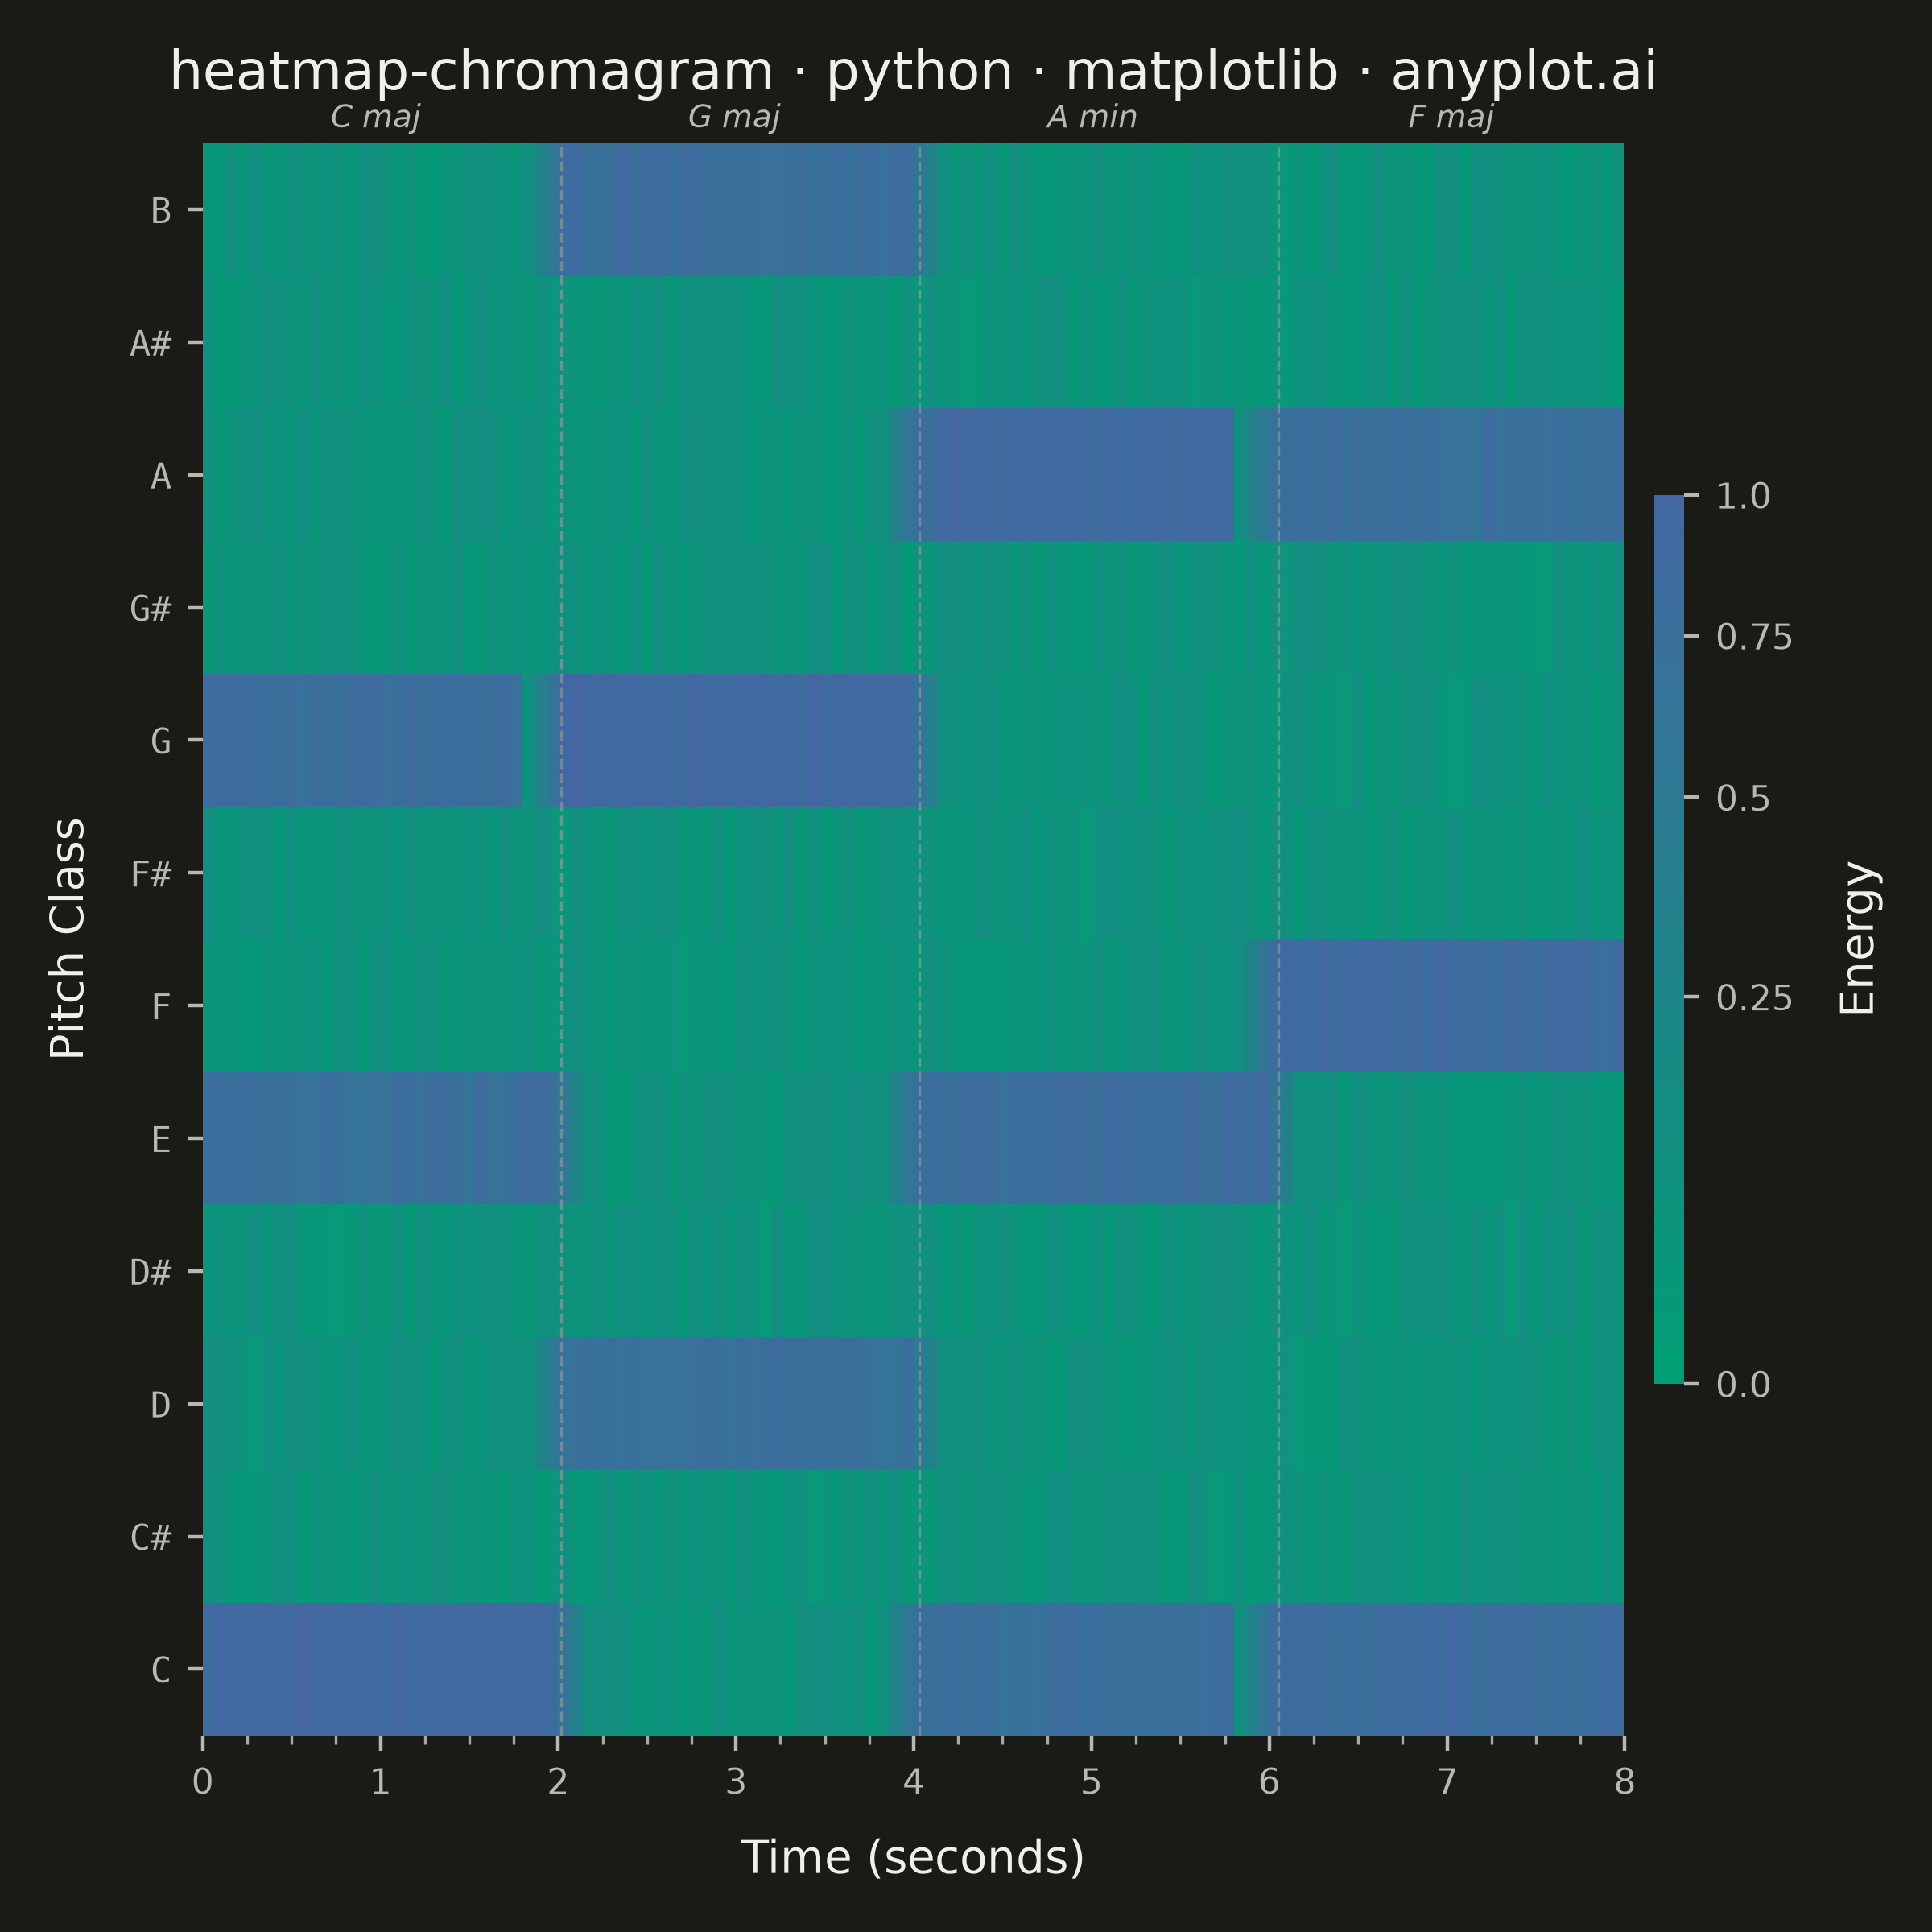
A heatmap-style visualization showing the energy distribution across the 12 pitch classes (C, C#, D, D#, E, F, F#, G, G#, A, A#, B) over time. Each column represents a time frame and each row a pitch class, with color intensity indicating the energy or magnitude at that pitch-time point. Widely used in music information retrieval to analyze harmonic content, detect chords, estimate musical key, and study tonal progressions in audio signals.
Preview render from the Matplotlib implementation.