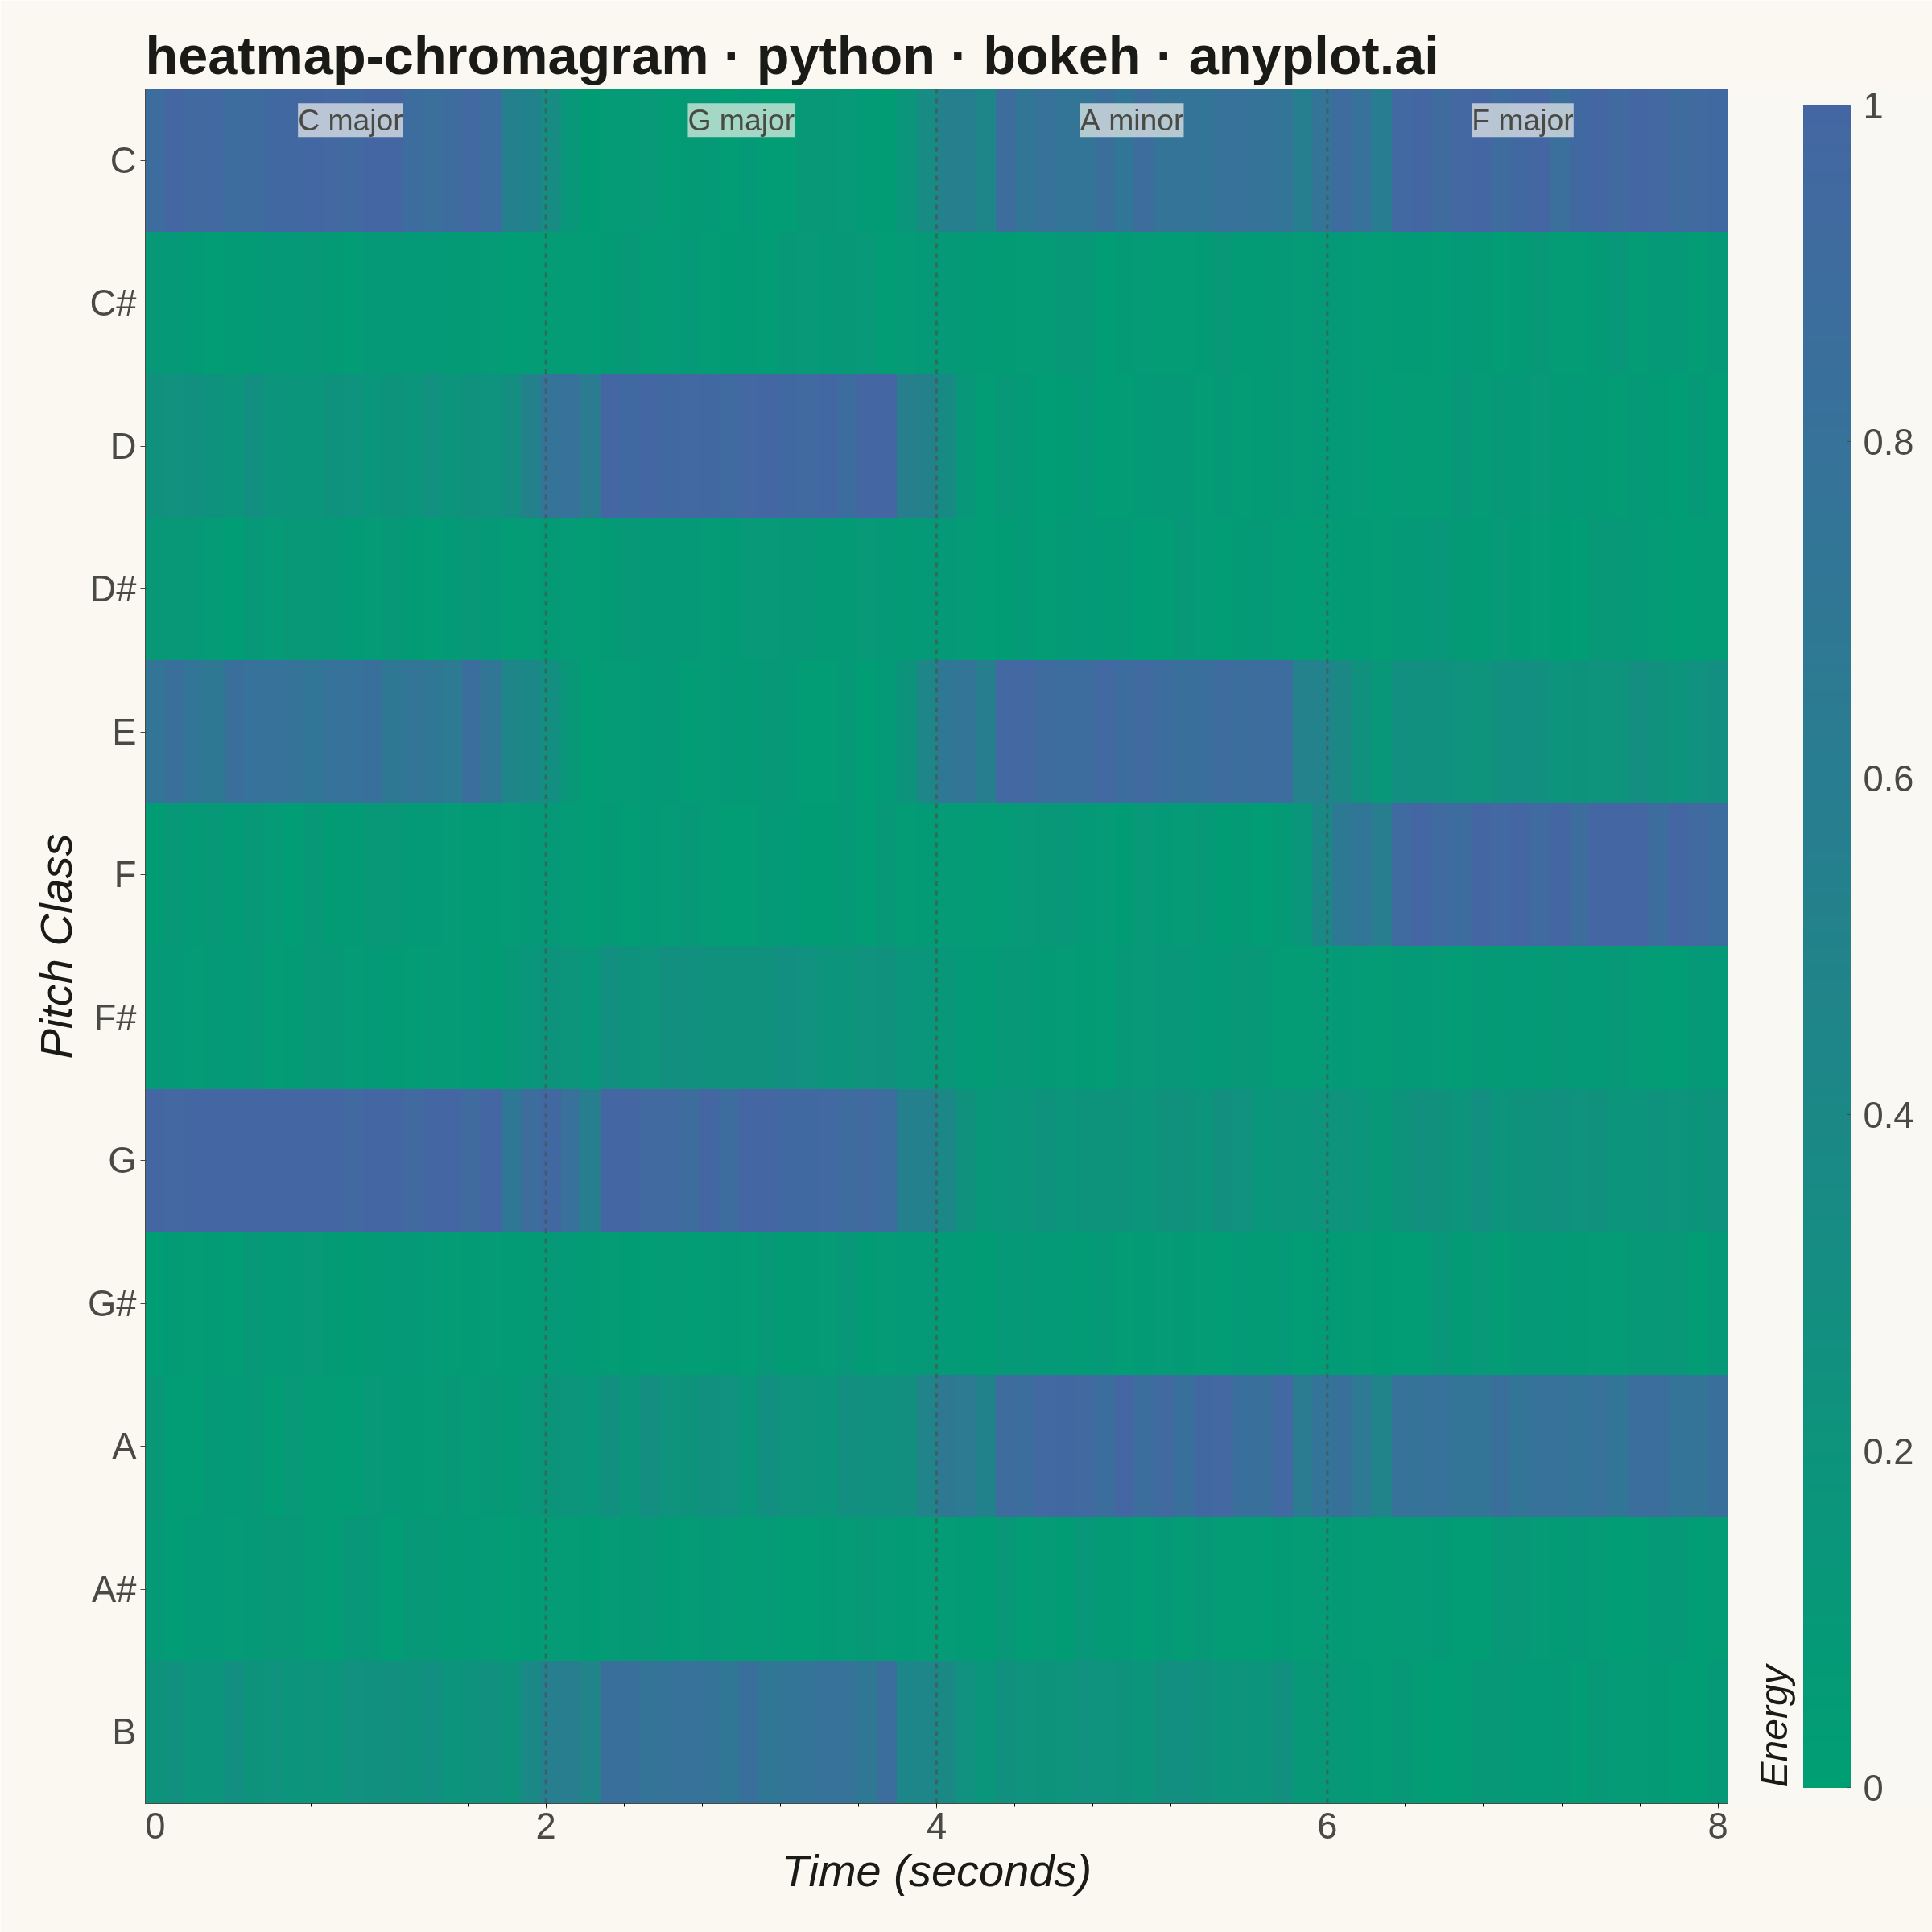
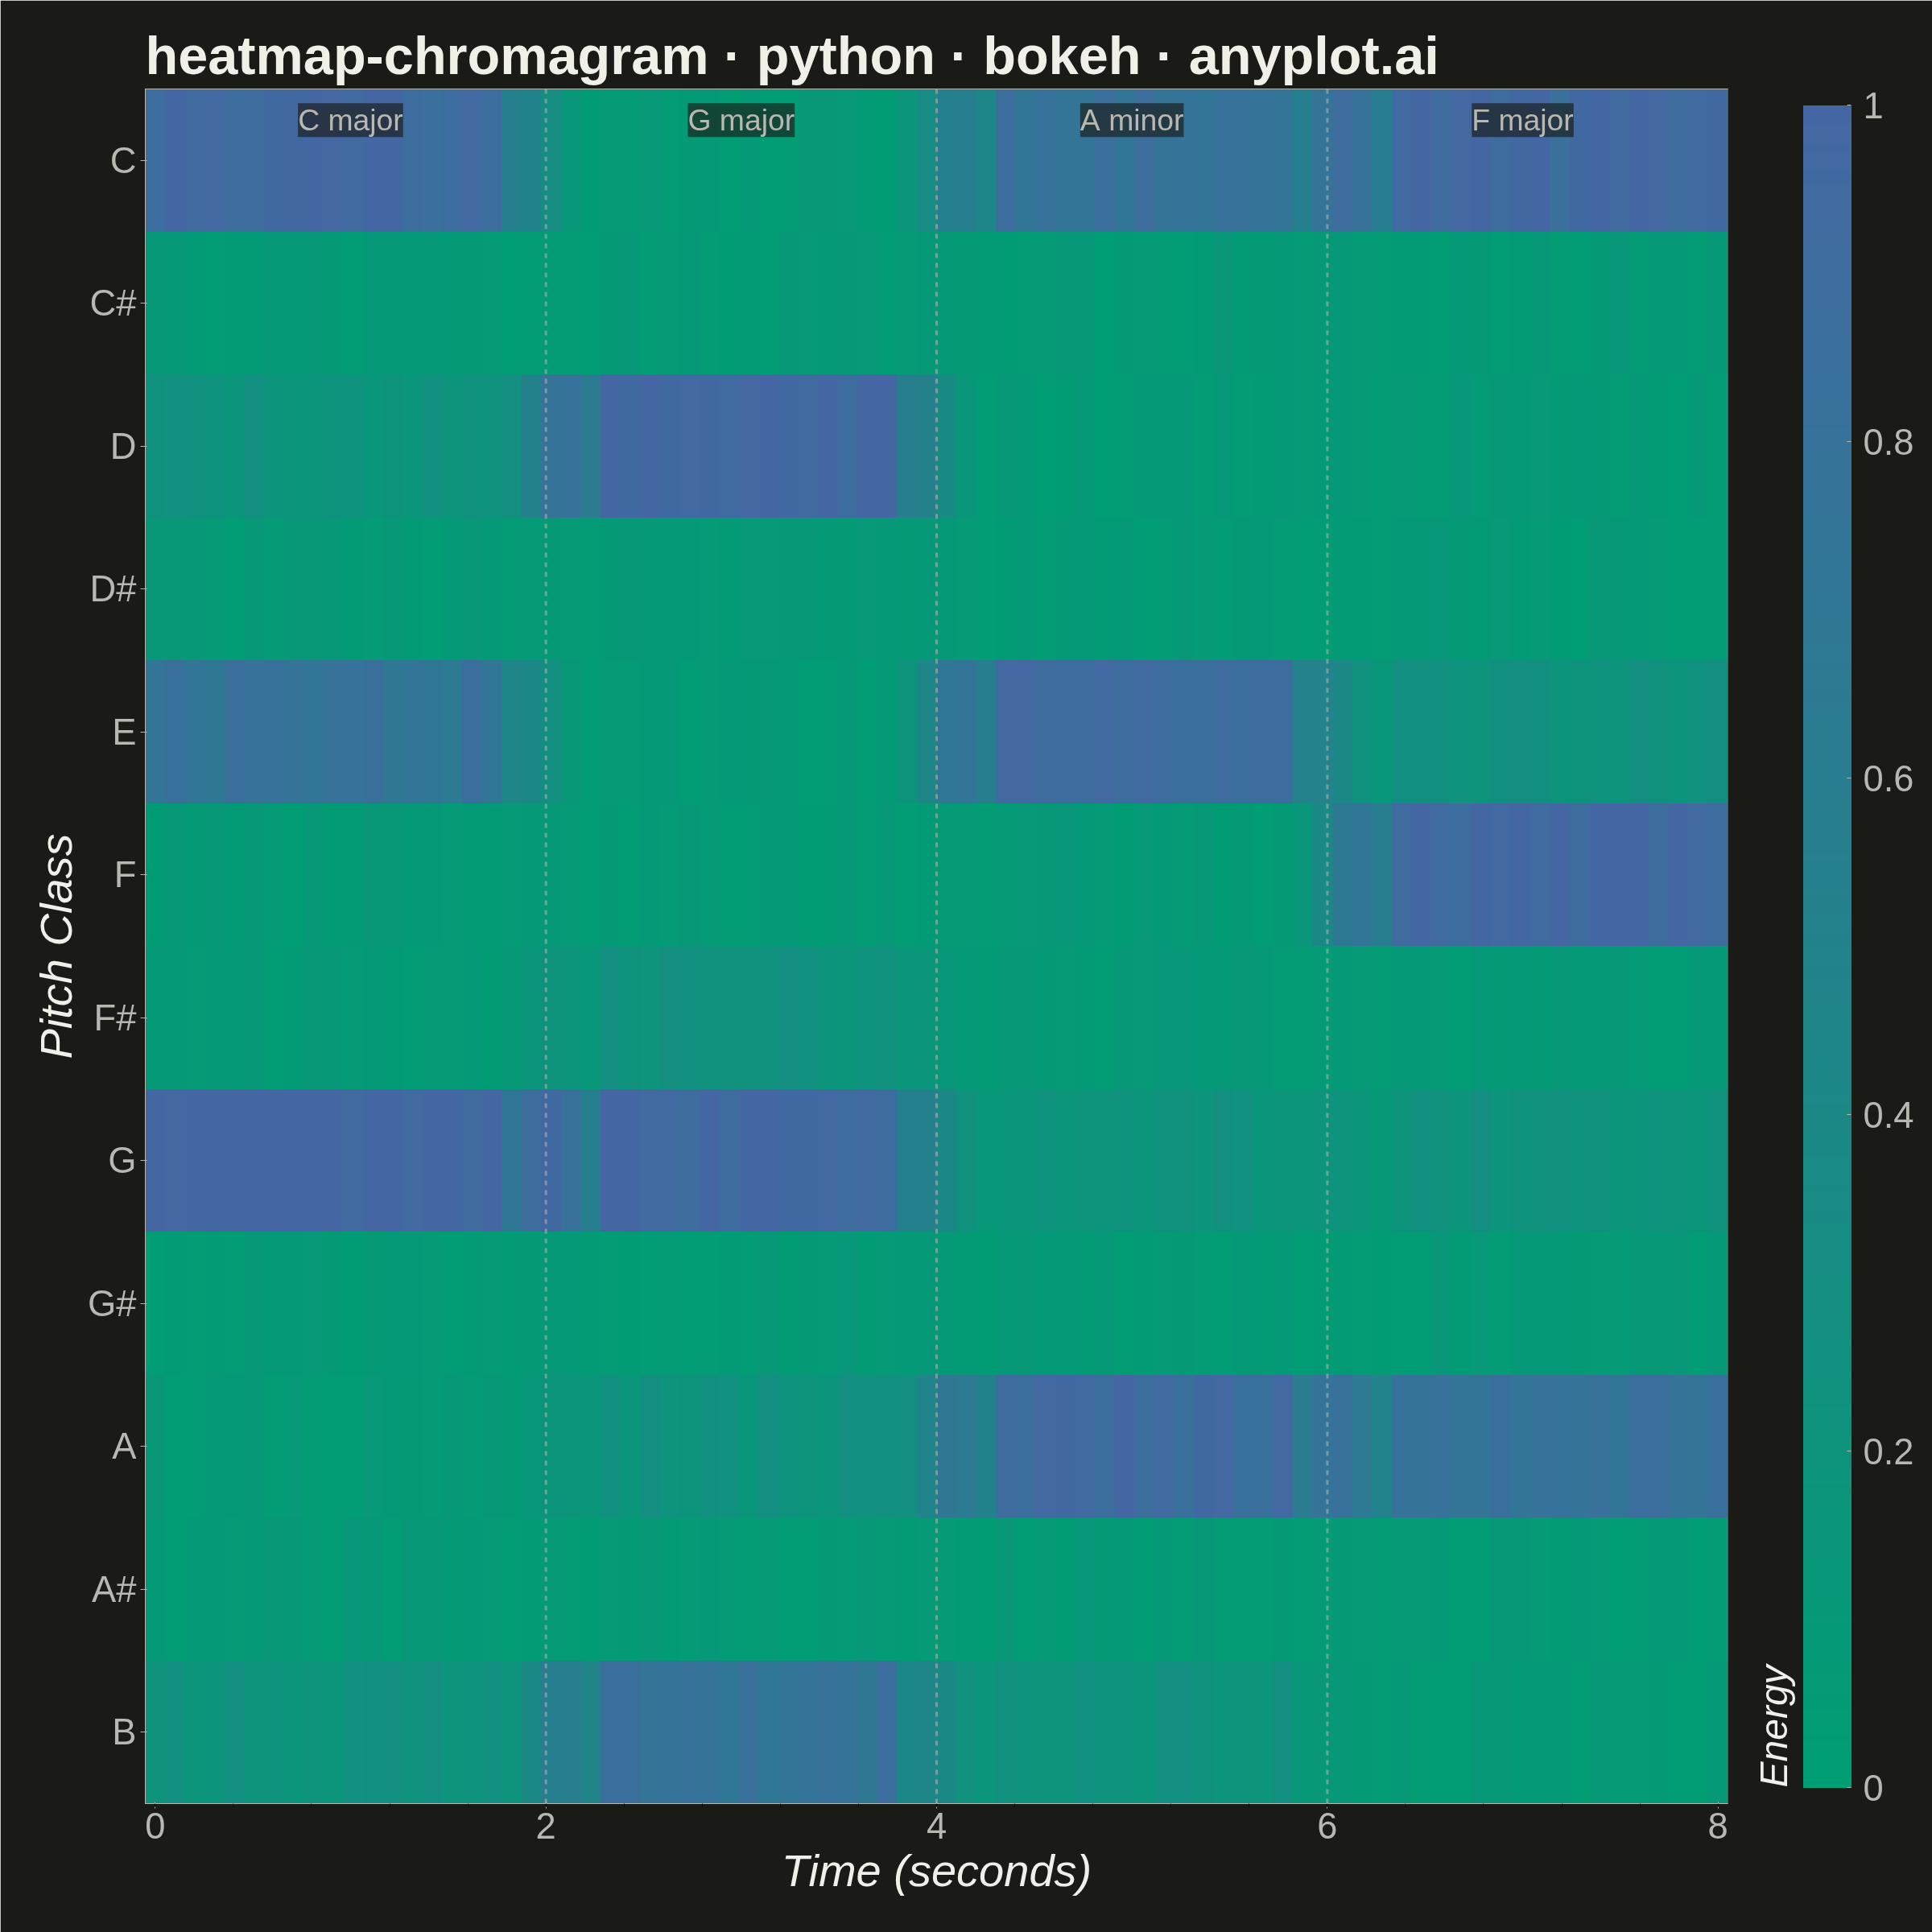
A heatmap-style visualization showing the energy distribution across the 12 pitch classes (C, C#, D, D#, E, F, F#, G, G#, A, A#, B) over time. Each column represents a time frame and each row a pitch class, with color intensity indicating the energy or magnitude at that pitch-time point. Widely used in music information retrieval to analyze harmonic content, detect chords, estimate musical key, and study tonal progressions in audio signals.
""" anyplot.ai
heatmap-chromagram: Music Chromagram (Pitch Class Distribution over Time)
Library: bokeh 3.9.1 | Python 3.13.14
Quality: 89/100 | Updated: 2026-06-24
"""

import os
import sys
import time
from pathlib import Path


# Remove this script's directory from sys.path so 'bokeh.py' doesn't shadow the installed package
_here = os.path.dirname(os.path.abspath(__file__))
sys.path = [p for p in sys.path if os.path.abspath(p) != _here]

import numpy as np
import pandas as pd
from bokeh.io import output_file, save
from bokeh.models import (
    BasicTicker,
    ColorBar,
    ColumnDataSource,
    FixedTicker,
    HoverTool,
    Label,
    LinearColorMapper,
    Range1d,
    Span,
)
from bokeh.plotting import figure
from selenium import webdriver
from selenium.webdriver.chrome.options import Options


THEME = os.getenv("ANYPLOT_THEME", "light")

PAGE_BG = "#FAF8F1" if THEME == "light" else "#1A1A17"
ELEVATED_BG = "#FFFDF6" if THEME == "light" else "#242420"
INK = "#1A1A17" if THEME == "light" else "#F0EFE8"
INK_SOFT = "#4A4A44" if THEME == "light" else "#B8B7B0"
INK_MUTED = "#6B6A63" if THEME == "light" else "#A8A79F"


# Imprint sequential colormap: brand green (#009E73) → blue (#4467A3), single-polarity energy
IMPRINT_SEQ = [
    "#{:02X}{:02X}{:02X}".format(round(t * 68 / 255), round(158 - t * 55 / 255), round(115 + t * 48 / 255))
    for t in range(256)
]

# Data — simulated chromagram: 12 pitch classes over 80 time frames
np.random.seed(42)
pitch_classes = ["C", "C#", "D", "D#", "E", "F", "F#", "G", "G#", "A", "A#", "B"]
n_pitch = len(pitch_classes)
n_frames = 80
time_seconds = np.linspace(0, 8, n_frames)

# Build energy matrix simulating chord progressions:
# C major (C-E-G) -> G major (G-B-D) -> Am (A-C-E) -> F major (F-A-C)
energy = np.random.uniform(0.02, 0.12, size=(12, n_frames))

chord_patterns = {
    "C_major": {"notes": [0, 4, 7], "boost": [0.9, 0.7, 0.8]},
    "G_major": {"notes": [7, 11, 2], "boost": [0.9, 0.7, 0.75]},
    "A_minor": {"notes": [9, 0, 4], "boost": [0.85, 0.7, 0.7]},
    "F_major": {"notes": [5, 9, 0], "boost": [0.9, 0.7, 0.75]},
}

chord_sequence = ["C_major", "G_major", "A_minor", "F_major"]
chord_display = ["C major", "G major", "A minor", "F major"]
frames_per_chord = n_frames // len(chord_sequence)

for idx, chord_name in enumerate(chord_sequence):
    start = idx * frames_per_chord
    end = start + frames_per_chord
    pattern = chord_patterns[chord_name]
    for note_idx, boost in zip(pattern["notes"], pattern["boost"], strict=True):
        energy[note_idx, start:end] += boost + np.random.uniform(-0.08, 0.08, end - start)
    for note_idx in pattern["notes"]:
        neighbor = (note_idx + 7) % 12
        energy[neighbor, start:end] += 0.15 + np.random.uniform(-0.03, 0.03, end - start)

# Smooth transitions between chords
for i in range(1, len(chord_sequence)):
    boundary = i * frames_per_chord
    if boundary - 2 >= 0 and boundary + 2 < n_frames:
        for row in range(12):
            window = energy[row, boundary - 2 : boundary + 3]
            energy[row, boundary - 2 : boundary + 3] = np.convolve(window, [0.15, 0.25, 0.3, 0.2, 0.1], mode="same")

energy = np.clip(energy, 0, 1)

dt = time_seconds[1] - time_seconds[0]

# image glyph renders row 0 at bottom; reversing places C at top
energy_image = energy[::-1, :]

# Flatten to DataFrame for HoverTool interactivity
records = []
for i, pitch in enumerate(pitch_classes):
    y_pos = n_pitch - 1 - i
    for j in range(n_frames):
        records.append(
            {"time": float(time_seconds[j]), "pitch": pitch, "y": y_pos, "energy": round(float(energy[i, j]), 3)}
        )

source = ColumnDataSource(pd.DataFrame(records))

mapper = LinearColorMapper(palette=IMPRINT_SEQ, low=0, high=1)

# Square canvas (2400×2400) — symmetric pitch×time grid suits 1:1 format
p = figure(
    width=2400,
    height=2400,
    y_range=Range1d(-0.5, n_pitch - 0.5),
    x_range=(-dt / 2, 8 + dt / 2),
    title="heatmap-chromagram · python · bokeh · anyplot.ai",
    x_axis_label="Time (seconds)",
    y_axis_label="Pitch Class",
    toolbar_location=None,
    min_border_bottom=160,
    min_border_left=180,
    min_border_top=110,
    min_border_right=230,
)

# Y-axis: pitch class labels
p.yaxis.ticker = FixedTicker(ticks=list(range(n_pitch)))
p.yaxis.major_label_overrides = {i: pitch_classes[n_pitch - 1 - i] for i in range(n_pitch)}

# Seamless heatmap via image glyph — no cell gaps
p.image(image=[energy_image], x=-dt / 2, y=-0.5, dw=8 + dt, dh=n_pitch, color_mapper=mapper)

# Invisible rect overlay for HoverTool interactivity
r = p.rect(x="time", y="y", width=dt, height=1, source=source, fill_alpha=0, line_alpha=0)

# Chord boundary Span annotations
for t_boundary in [2.0, 4.0, 6.0]:
    p.add_layout(
        Span(
            location=t_boundary,
            dimension="height",
            line_color=INK_SOFT,
            line_width=3,
            line_alpha=0.55,
            line_dash="dashed",
        )
    )

# Chord label annotations at the top of each region
for idx, label_text in enumerate(chord_display):
    t_center = idx * 2.0 + 1.0
    p.add_layout(
        Label(
            x=t_center,
            y=n_pitch - 0.6,
            text=label_text,
            text_font_size="28pt",
            text_color=INK_SOFT,
            text_align="center",
            text_baseline="top",
            background_fill_color=PAGE_BG,
            background_fill_alpha=0.65,
        )
    )

# Color bar
color_bar = ColorBar(
    color_mapper=mapper,
    width=60,
    ticker=BasicTicker(desired_num_ticks=6),
    label_standoff=15,
    major_label_text_font_size="34pt",
    major_label_text_color=INK_SOFT,
    border_line_color=None,
    padding=20,
    title="Energy",
    title_text_font_size="36pt",
    title_text_color=INK,
    title_standoff=20,
    background_fill_color=PAGE_BG,
    bar_line_color=None,
    major_tick_line_color=INK_SOFT,
    minor_tick_line_color=None,
)
p.add_layout(color_bar, "right")

hover = HoverTool(
    tooltips=[("Pitch", "@pitch"), ("Time", "@time{0.00} s"), ("Energy", "@energy{0.000}")], renderers=[r]
)
p.add_tools(hover)

# Font sizes — canonical bokeh values for 2400×2400 canvas
p.title.text_font_size = "50pt"
p.title.text_color = INK
p.xaxis.axis_label_text_font_size = "42pt"
p.yaxis.axis_label_text_font_size = "42pt"
p.xaxis.major_label_text_font_size = "34pt"
p.yaxis.major_label_text_font_size = "34pt"
p.xaxis.axis_label_text_color = INK
p.yaxis.axis_label_text_color = INK
p.xaxis.major_label_text_color = INK_SOFT
p.yaxis.major_label_text_color = INK_SOFT
p.xaxis.axis_line_color = INK_SOFT
p.yaxis.axis_line_color = INK_SOFT
p.xaxis.major_tick_line_color = INK_SOFT
p.yaxis.major_tick_line_color = INK_SOFT

# No grid — heatmap fills the entire plot area
p.xgrid.grid_line_color = None
p.ygrid.grid_line_color = None
p.outline_line_color = INK_SOFT

# Theme-adaptive background
p.background_fill_color = PAGE_BG
p.border_fill_color = PAGE_BG

# Save interactive HTML (required Bokeh catalog artifact)
output_file(f"plot-{THEME}.html")
save(p)

# Screenshot with headless Chrome — avoid export_png (snap chromium incompatibility)
W, H = 2400, 2400
opts = Options()
for arg in (
    "--headless=new",
    "--no-sandbox",
    "--disable-dev-shm-usage",
    "--disable-gpu",
    f"--window-size={W},{H}",
    "--hide-scrollbars",
):
    opts.add_argument(arg)
driver = webdriver.Chrome(options=opts)
# CDP override ensures exact viewport — window-size alone can drift due to browser chrome
driver.execute_cdp_cmd(
    "Emulation.setDeviceMetricsOverride", {"width": W, "height": H, "deviceScaleFactor": 1, "mobile": False}
)
driver.get(f"file://{Path(f'plot-{THEME}.html').resolve()}")
time.sleep(3)
driver.save_screenshot(f"plot-{THEME}.png")
driver.quit()
Runnable source as JSON, for any HTTP client: https://api.anyplot.ai/specs/heatmap-chromagram/bokeh/code. Any spec id and library id listed in llms-full.txt fit the same URL shape; every URL below is complete and callable.
{
  "spec_id": "heatmap-chromagram",
  "language": "python",
  "library": "bokeh",
  "page": "https://anyplot.ai/heatmap-chromagram/python/bokeh",
  "hub": "https://anyplot.ai/heatmap-chromagram",
  "code_json": "https://api.anyplot.ai/specs/heatmap-chromagram/bokeh/code",
  "spec_json": "https://api.anyplot.ai/specs/heatmap-chromagram",
  "render_light_png": "https://storage.googleapis.com/anyplot-images/plots/heatmap-chromagram/python/bokeh/plot-light.png",
  "render_dark_png": "https://storage.googleapis.com/anyplot-images/plots/heatmap-chromagram/python/bokeh/plot-dark.png",
  "interactive_light_html": "https://storage.googleapis.com/anyplot-images/plots/heatmap-chromagram/python/bokeh/plot-light.html",
  "interactive_dark_html": "https://storage.googleapis.com/anyplot-images/plots/heatmap-chromagram/python/bokeh/plot-dark.html",
  "quality_score": 89.0,
  "license": "MIT",
  "guide": "https://anyplot.ai/llms.txt"
}
Part of Music Chromagram (Pitch Class Distribution over Time) on anyplot.ai.