The same plot in 14 other libraries — JavaScript: Chart.js, D3.js, Apache ECharts, MUI X Charts; Python: Altair, Bokeh, lets-plot, Matplotlib, Plotly, plotnine, Pygal, Seaborn; R: ggplot2; Julia: Makie.jl. Compare all 15 side by side: Music Chromagram (Pitch Class Distribution over Time) in Python, R, Julia and JavaScript.
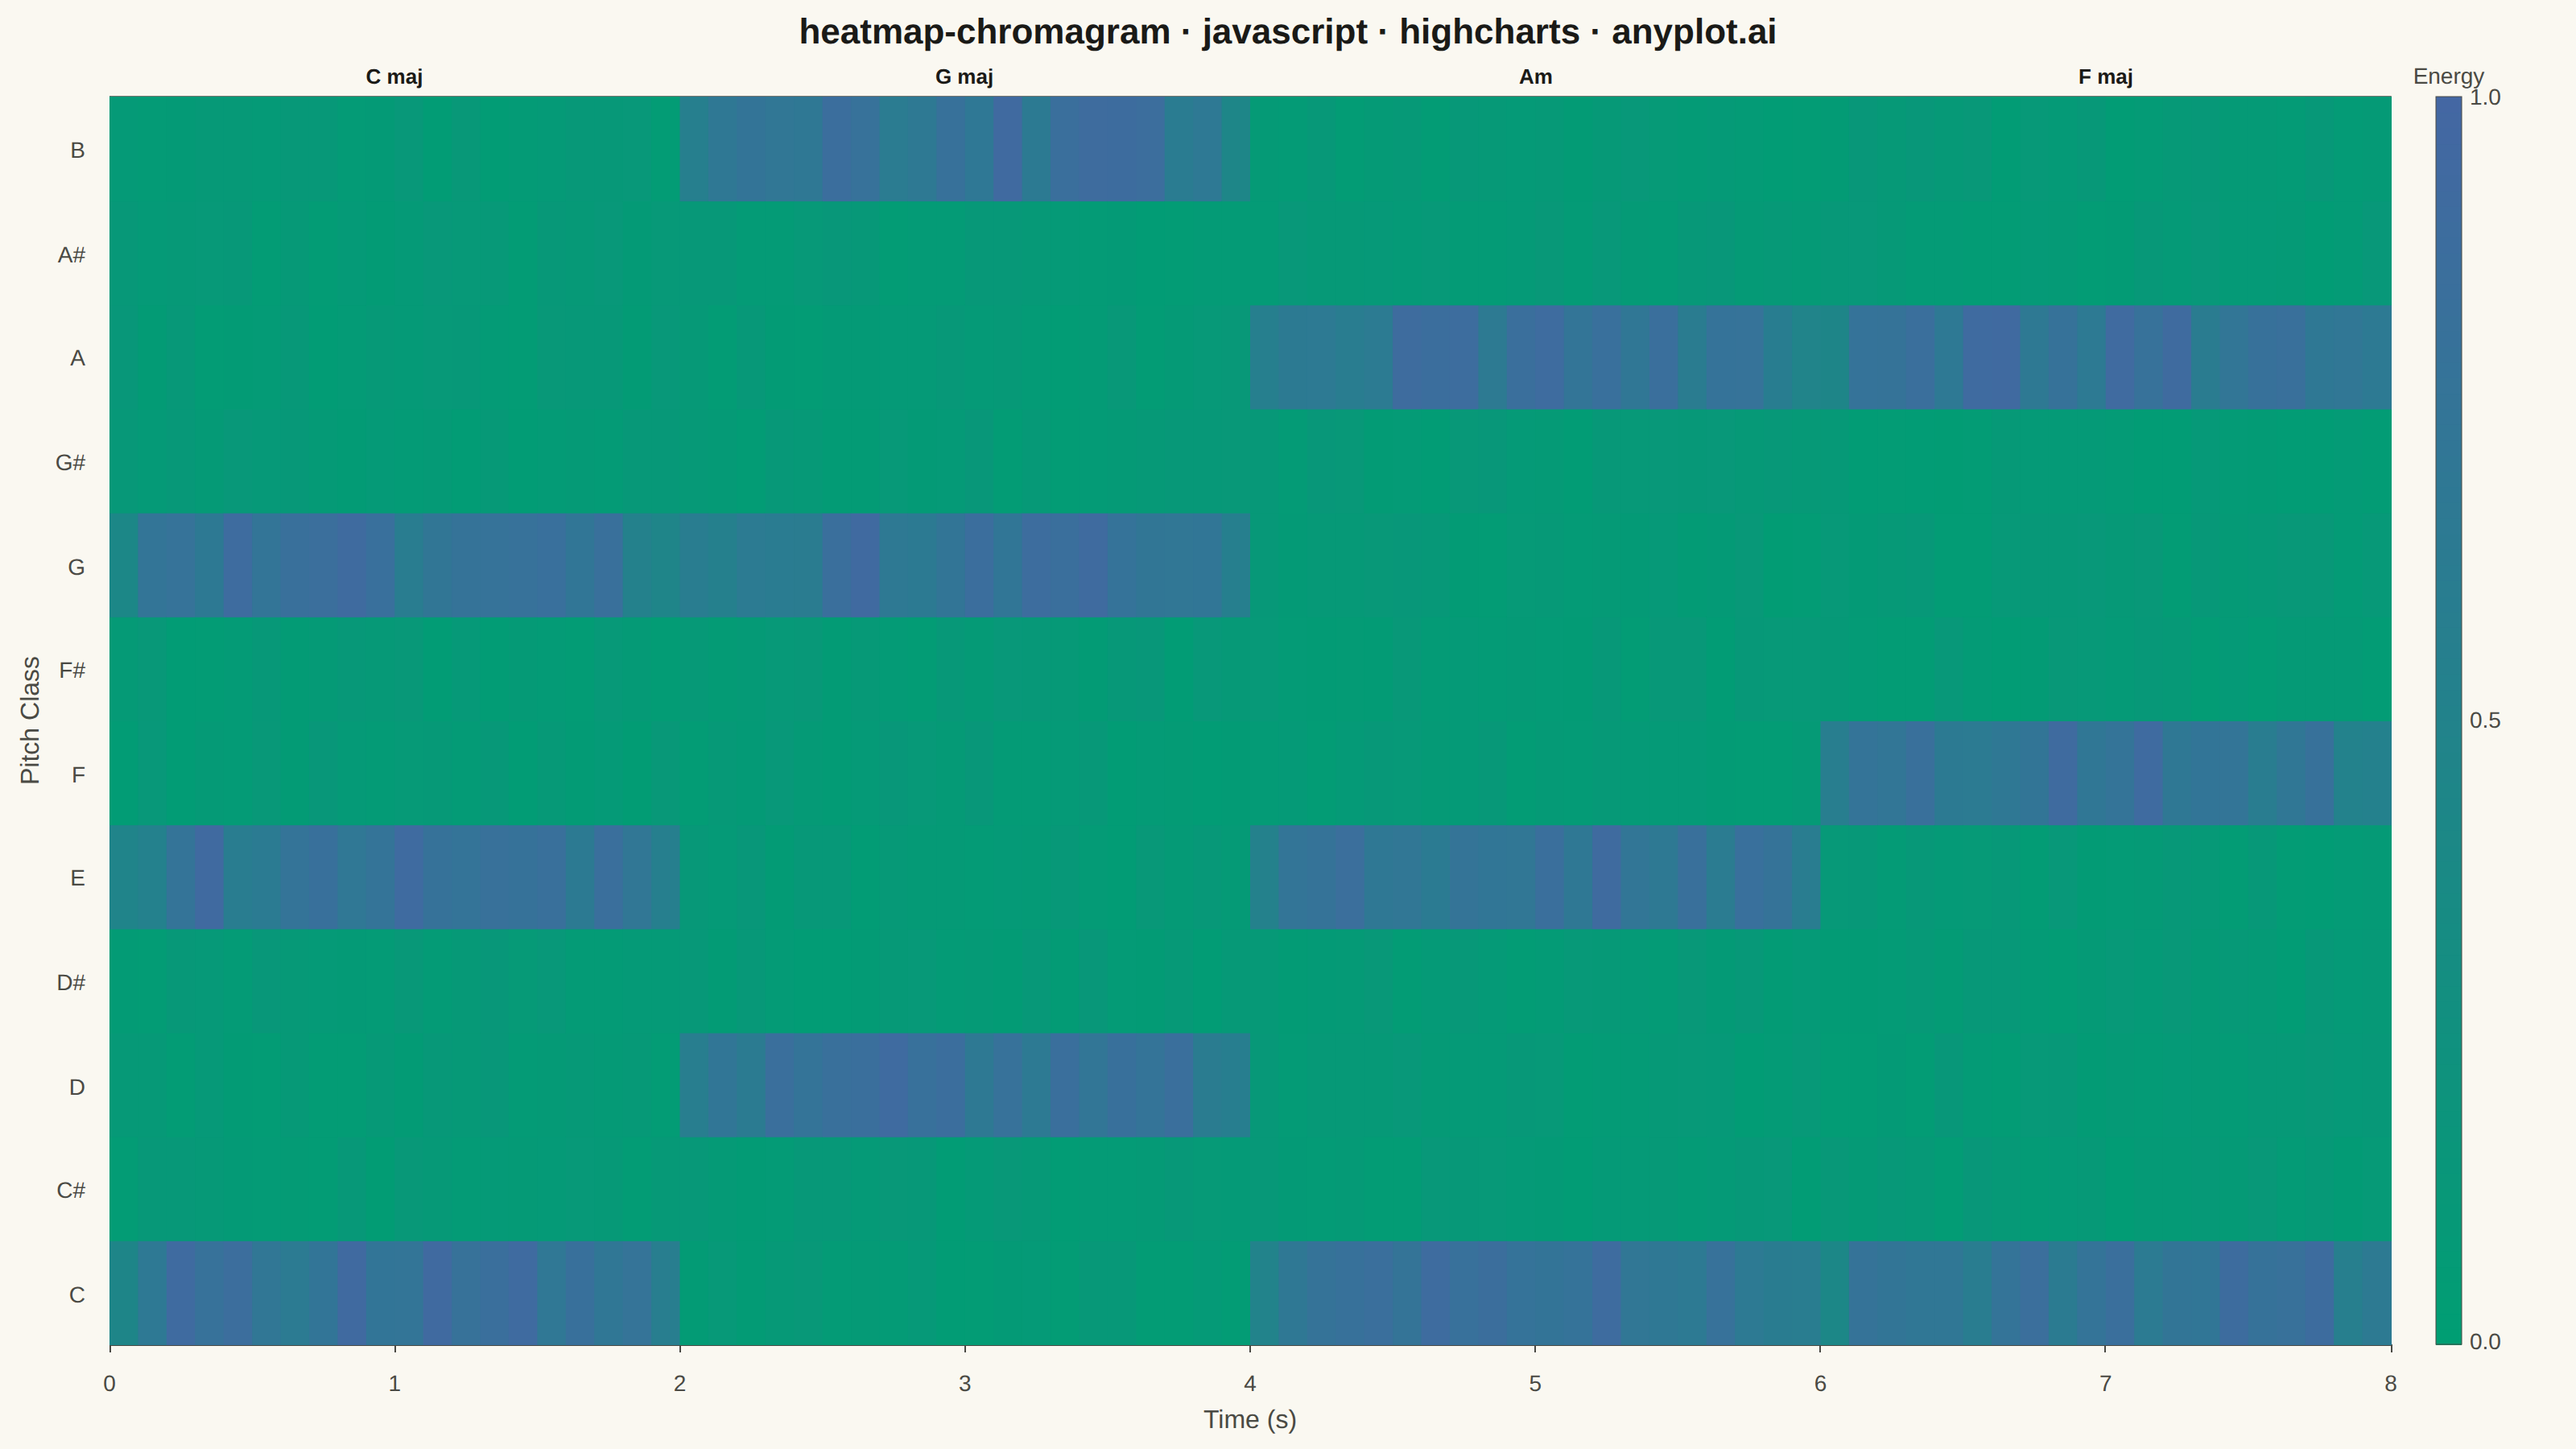
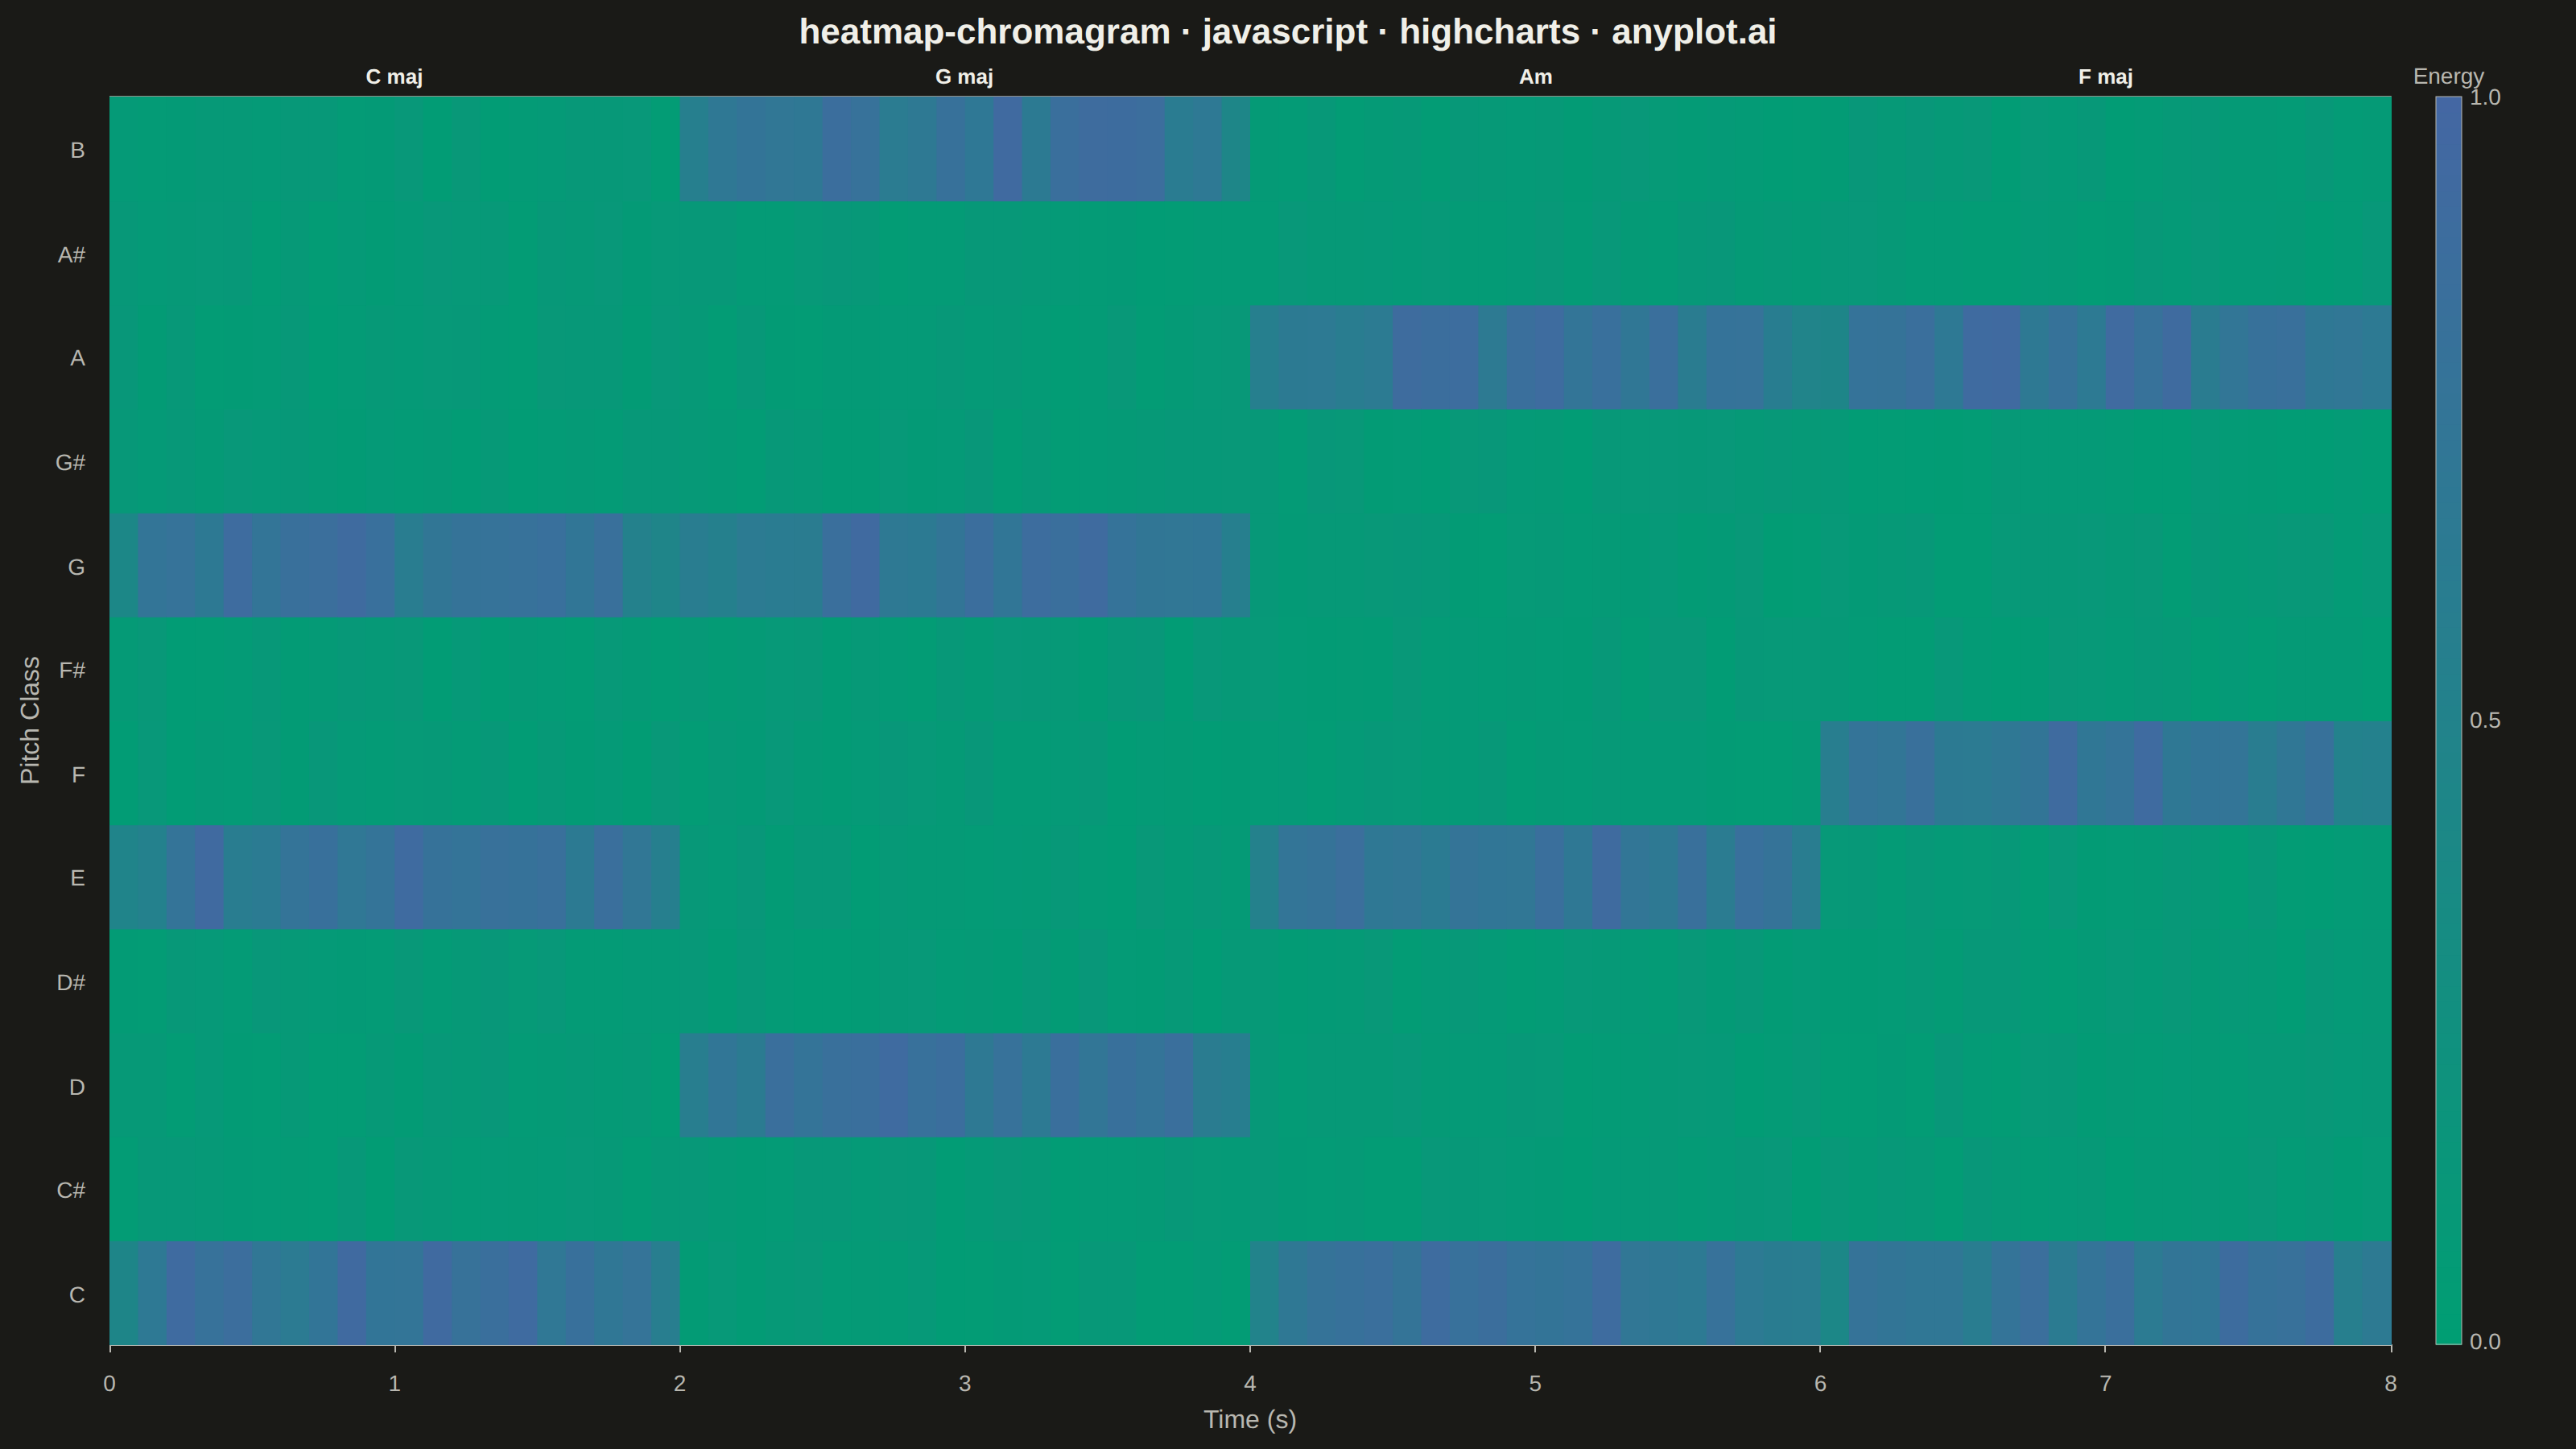
A heatmap-style visualization showing the energy distribution across the 12 pitch classes (C, C#, D, D#, E, F, F#, G, G#, A, A#, B) over time. Each column represents a time frame and each row a pitch class, with color intensity indicating the energy or magnitude at that pitch-time point. Widely used in music information retrieval to analyze harmonic content, detect chords, estimate musical key, and study tonal progressions in audio signals.
// anyplot.ai
// heatmap-chromagram: Music Chromagram (Pitch Class Distribution over Time)
// Library: highcharts 12.6.0 | JavaScript 22.22.3
// Quality: 92/100 | Created: 2026-06-24

const t = window.ANYPLOT_TOKENS;

// Chromatic pitch class labels (C at bottom index 0, B at top index 11)
const PITCH_CLASSES = ['C', 'C#', 'D', 'D#', 'E', 'F', 'F#', 'G', 'G#', 'A', 'A#', 'B'];

// Chord progression: C major → G major → A minor → F major
const CHORD_TONES = [
  [0, 4, 7],   // C major: C, E, G
  [7, 11, 2],  // G major: G, B, D
  [9, 0, 4],   // A minor: A, C, E
  [5, 9, 0],   // F major: F, A, C
];
const FRAMES_PER_CHORD = 20;
const NUM_FRAMES = FRAMES_PER_CHORD * CHORD_TONES.length; // 80
const DURATION = 8.0; // seconds

// Deterministic LCG PRNG
let _seed = 42;
function rand() {
  _seed = (_seed * 1664525 + 1013904223) >>> 0;
  return _seed / 4294967296;
}

// Generate chroma[pitch][frame] — chord tones get high energy, others get noise
const chroma = Array.from({ length: 12 }, () => new Array(NUM_FRAMES).fill(0));
for (let f = 0; f < NUM_FRAMES; f++) {
  const ci = Math.floor(f / FRAMES_PER_CHORD);
  const tones = CHORD_TONES[ci];
  const phi = f % FRAMES_PER_CHORD;
  // Attack / decay envelope at chord boundaries
  const env = phi < 2 ? 0.65 + 0.175 * phi : phi > 17 ? 1.0 - 0.15 * (phi - 17) : 1.0;
  for (let p = 0; p < 12; p++) {
    chroma[p][f] = tones.includes(p)
      ? Math.min(1.0, (0.60 + rand() * 0.35) * env)
      : 0.03 + rand() * 0.09;
  }
}

// imprint_seq: t.seq[0] (#009E73, brand green) → t.seq[1] (#4467A3, blue)
function h2r(hex) {
  return [parseInt(hex.slice(1, 3), 16), parseInt(hex.slice(3, 5), 16), parseInt(hex.slice(5, 7), 16)];
}
function seqColor(v) {
  const [r1, g1, b1] = h2r(t.seq[0]);
  const [r2, g2, b2] = h2r(t.seq[1]);
  return '#' + [r1 + (r2 - r1) * v, g1 + (g2 - g1) * v, b1 + (b2 - b1) * v]
    .map(c => Math.round(Math.max(0, Math.min(255, c))).toString(16).padStart(2, '0'))
    .join('');
}

const TITLE = 'heatmap-chromagram · javascript · highcharts · anyplot.ai';

// Dummy scatter data — invisible points force Y-axis to render all 12 category labels
const dummyData = PITCH_CLASSES.map((_, i) => ({ x: DURATION / 2, y: i }));

const chart = Highcharts.chart('container', {
  chart: {
    backgroundColor: 'transparent',
    animation: false,
    style: { fontFamily: 'inherit' },
    margin: [60, 115, 65, 68],
  },
  credits: { enabled: false },
  title: {
    text: TITLE,
    style: { color: t.ink, fontSize: '22px', fontWeight: '600' },
  },
  xAxis: {
    min: 0,
    max: DURATION,
    startOnTick: false,
    endOnTick: false,
    tickInterval: 1,
    title: { text: 'Time (s)', style: { color: t.inkSoft, fontSize: '16px' } },
    lineColor: t.inkSoft,
    lineWidth: 1,
    tickColor: t.inkSoft,
    tickLength: 5,
    gridLineWidth: 0,
    labels: { style: { color: t.inkSoft, fontSize: '14px' } },
  },
  yAxis: {
    categories: PITCH_CLASSES,
    reversed: false,  // category 0 (C) at bottom
    title: { text: 'Pitch Class', style: { color: t.inkSoft, fontSize: '16px' } },
    lineColor: t.inkSoft,
    lineWidth: 1,
    tickColor: t.inkSoft,
    tickLength: 5,
    gridLineWidth: 0,
    labels: { style: { color: t.inkSoft, fontSize: '14px' } },
  },
  legend: { enabled: false },
  // Invisible scatter series — required to make Highcharts render the axes
  series: [{
    type: 'scatter',
    data: dummyData,
    showInLegend: false,
    enableMouseTracking: false,
    color: 'transparent',
    marker: { radius: 0, enabled: false },
    states: { hover: { enabled: false }, inactive: { opacity: 1 } },
  }],
  plotOptions: { series: { animation: false } },
  tooltip: { enabled: false },
});

const ren = chart.renderer;
const { plotLeft: px, plotTop: py, plotWidth: pw, plotHeight: ph } = chart;
const cellW = pw / NUM_FRAMES;
const cellH = ph / 12;

// Draw heatmap cells into seriesGroup so they render behind axis labels
// p=0 (C) at bottom (large y), p=11 (B) at top (small y) — matches category reversed:false
const cellsGroup = ren.g('chroma-cells').add(chart.seriesGroup);
for (let f = 0; f < NUM_FRAMES; f++) {
  for (let p = 0; p < 12; p++) {
    ren.rect(px + f * cellW, py + (11 - p) * cellH, cellW + 0.5, cellH + 0.5)
      .attr({ fill: seqColor(chroma[p][f]), 'stroke-width': 0 })
      .add(cellsGroup);
  }
}

// Subtle border around the heatmap area (top + right lines; left and bottom drawn by axes)
ren.path(['M', px, py, 'L', px + pw, py, 'L', px + pw, py + ph])
  .attr({ stroke: t.inkSoft, 'stroke-width': 0.75 })
  .add();

// Colorbar (right side, outside plot area → root SVG)
const cbX = px + pw + 28;
const cbW = 16;
const CB_STEPS = 80;
for (let i = 0; i < CB_STEPS; i++) {
  const v = i / (CB_STEPS - 1);
  // i=0 (v=0, green, low energy) → bottom; i=CB_STEPS-1 (v=1, blue, high energy) → top
  ren.rect(cbX, py + (1 - (i + 1) / CB_STEPS) * ph, cbW, ph / CB_STEPS + 0.5)
    .attr({ fill: seqColor(v), 'stroke-width': 0 })
    .add();
}
ren.rect(cbX, py, cbW, ph)
  .attr({ fill: 'none', stroke: t.inkSoft, 'stroke-width': 0.5 })
  .add();

// Colorbar labels
const ls = { color: t.inkSoft, fontSize: '14px' };
const lx = cbX + cbW + 5;
ren.text('1.0', lx, py + 5).css(ls).attr({ align: 'left' }).add();
ren.text('0.5', lx, py + ph / 2 + 4).css(ls).attr({ align: 'left' }).add();
ren.text('0.0', lx, py + ph + 3).css(ls).attr({ align: 'left' }).add();
ren.text('Energy', cbX + cbW / 2, py - 8)
  .css({ color: t.inkSoft, fontSize: '14px' })
  .attr({ align: 'center' })
  .add();

// Chord section dividers at t=2, 4, 6 s
[2, 4, 6].forEach(tb => {
  const xDiv = px + (tb / DURATION) * pw;
  ren.path(['M', xDiv, py, 'L', xDiv, py + ph])
    .attr({ stroke: t.inkSoft, 'stroke-width': 1, dashstyle: 'ShortDash', opacity: 0.65 })
    .add();
});

// Chord name annotations just above the heatmap area
const CHORD_LABELS = ['C maj', 'G maj', 'Am', 'F maj'];
CHORD_LABELS.forEach((label, i) => {
  const midT = (i + 0.5) * (DURATION / CHORD_TONES.length);
  const xMid = px + (midT / DURATION) * pw;
  ren.text(label, xMid, py - 8)
    .css({ color: t.ink, fontSize: '13px', fontWeight: '600' })
    .attr({ align: 'center' })
    .add();
});
Runnable source as JSON, for any HTTP client: https://api.anyplot.ai/specs/heatmap-chromagram/highcharts/code. Any spec id and library id listed in llms-full.txt fit the same URL shape; every URL below is complete and callable.
{
  "spec_id": "heatmap-chromagram",
  "language": "javascript",
  "library": "highcharts",
  "page": "https://anyplot.ai/heatmap-chromagram/javascript/highcharts",
  "hub": "https://anyplot.ai/heatmap-chromagram",
  "code_json": "https://api.anyplot.ai/specs/heatmap-chromagram/highcharts/code",
  "spec_json": "https://api.anyplot.ai/specs/heatmap-chromagram",
  "render_light_png": "https://storage.googleapis.com/anyplot-images/plots/heatmap-chromagram/javascript/highcharts/plot-light.png",
  "render_dark_png": "https://storage.googleapis.com/anyplot-images/plots/heatmap-chromagram/javascript/highcharts/plot-dark.png",
  "interactive_light_html": "https://storage.googleapis.com/anyplot-images/plots/heatmap-chromagram/javascript/highcharts/plot-light.html",
  "interactive_dark_html": "https://storage.googleapis.com/anyplot-images/plots/heatmap-chromagram/javascript/highcharts/plot-dark.html",
  "quality_score": 92.0,
  "license": "MIT",
  "guide": "https://anyplot.ai/llms.txt"
}
Part of Music Chromagram (Pitch Class Distribution over Time) on anyplot.ai.