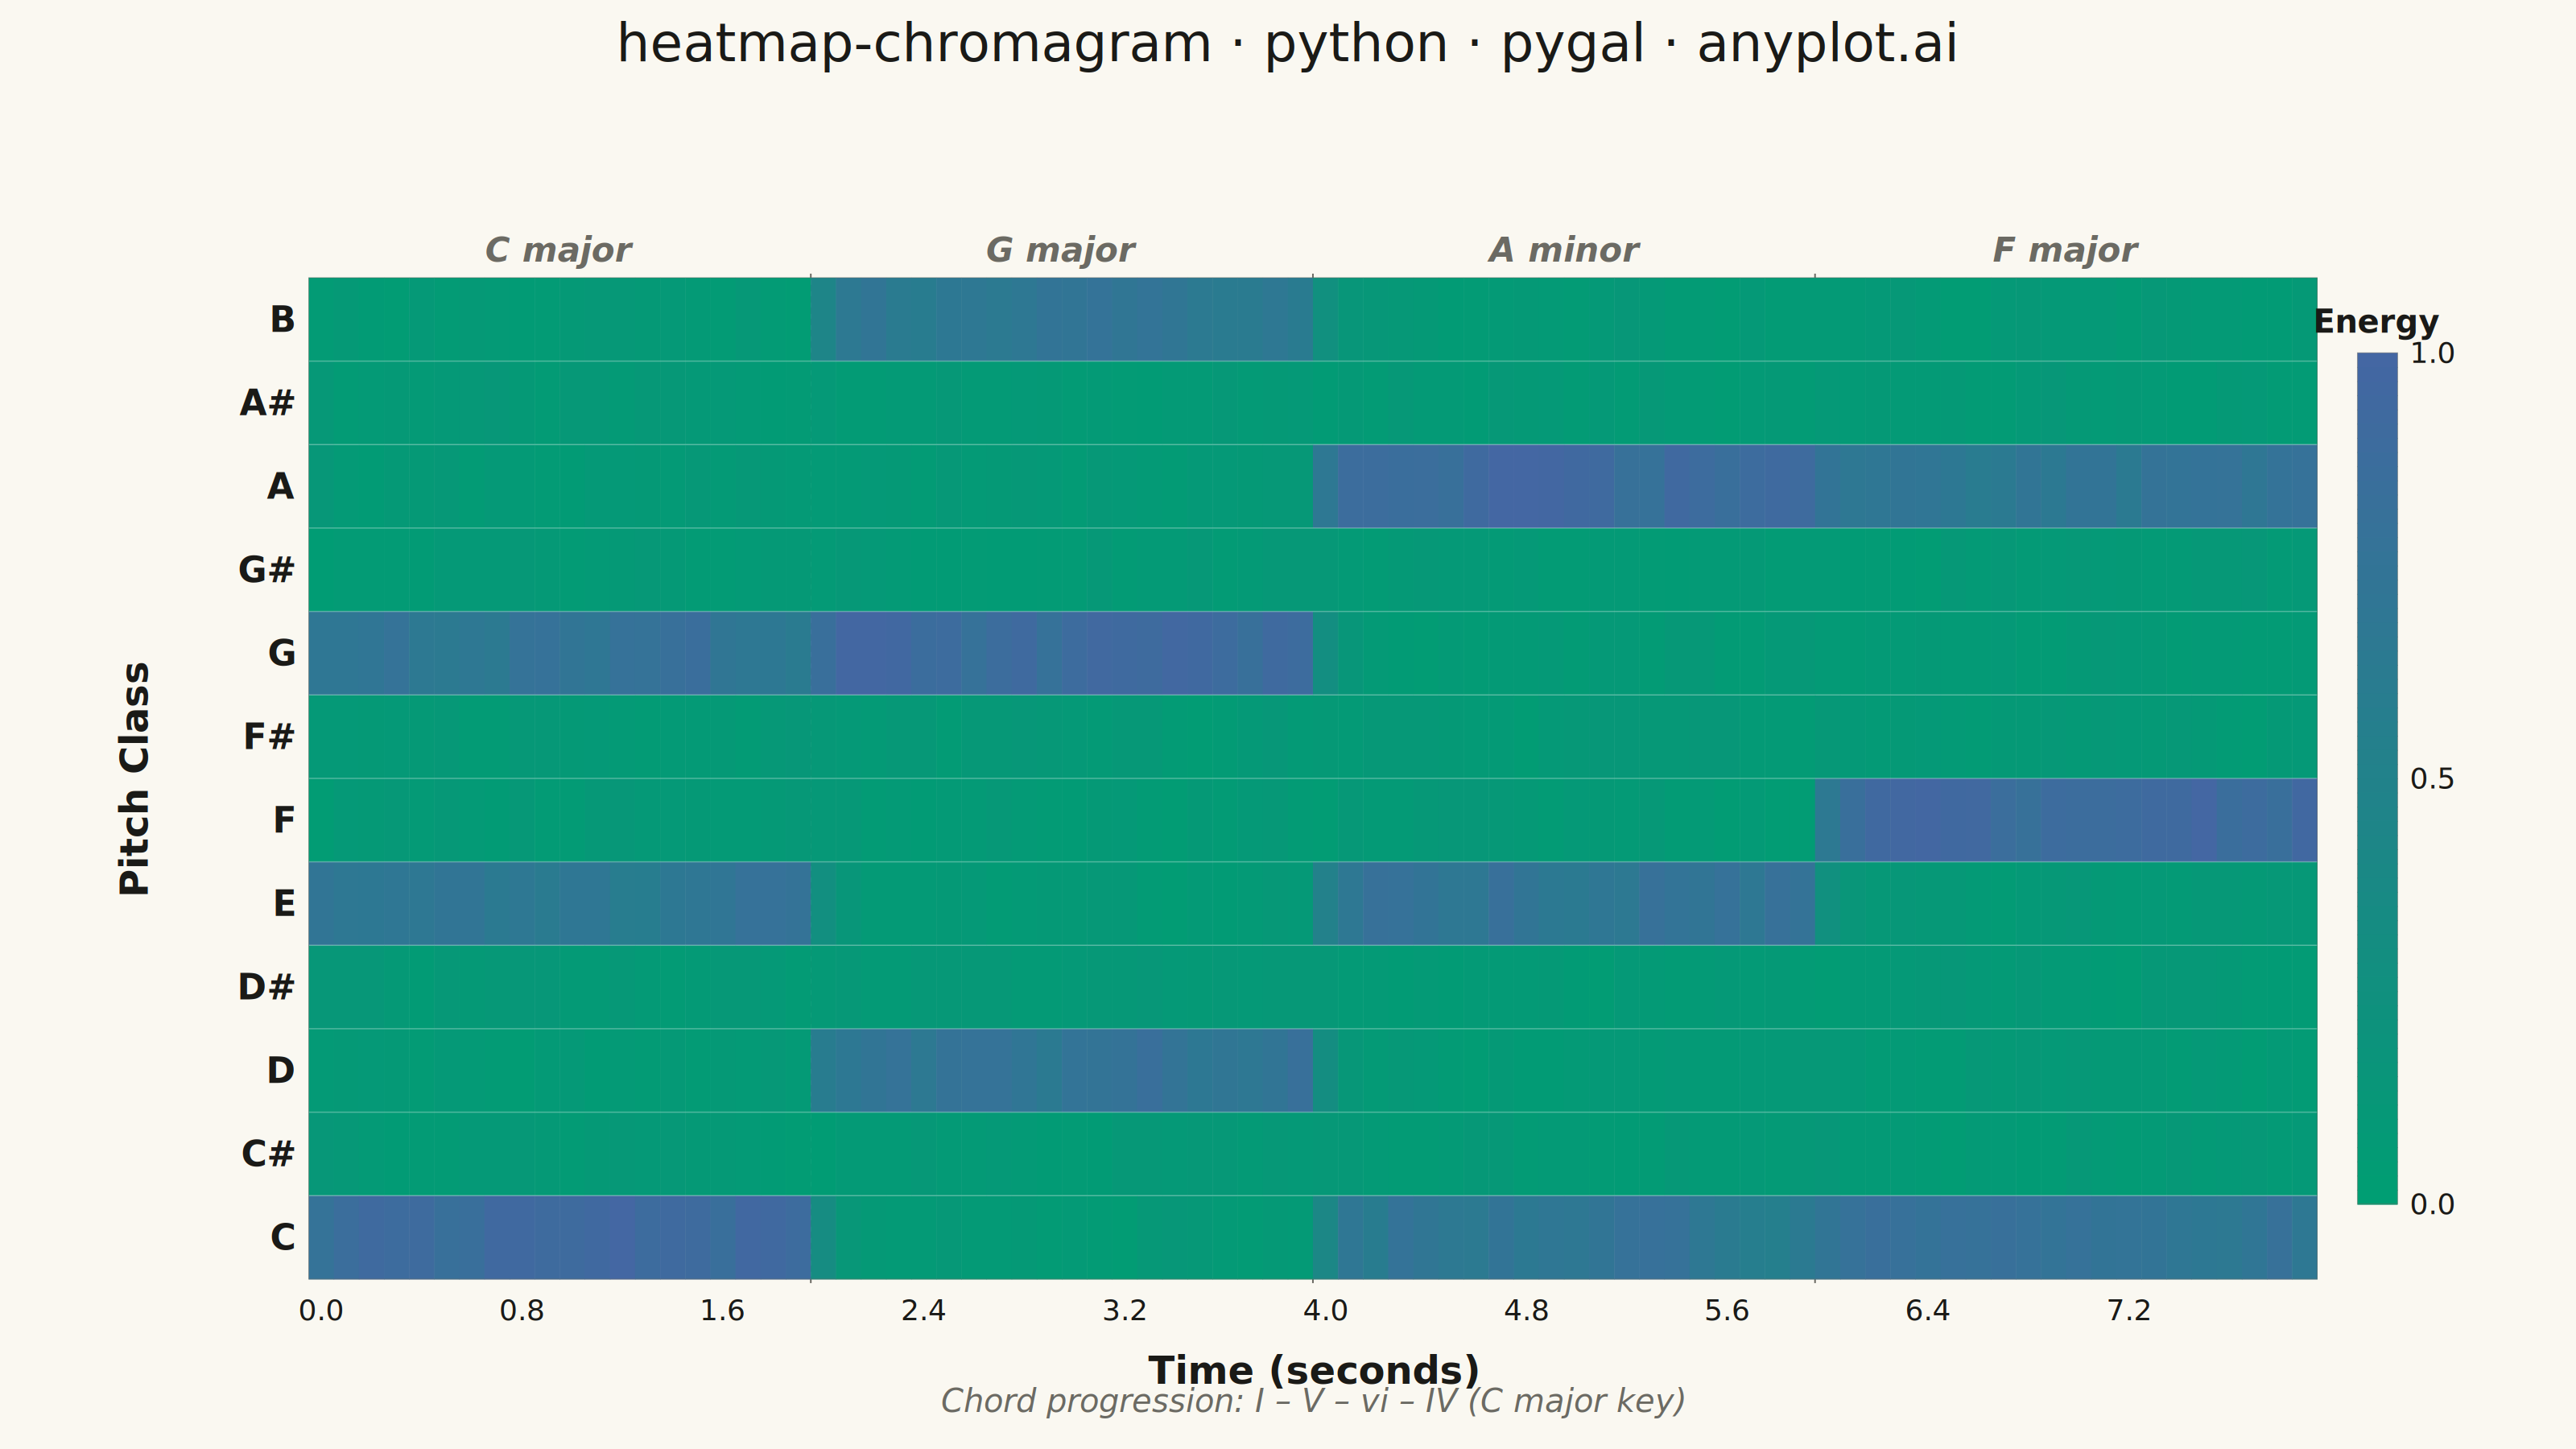
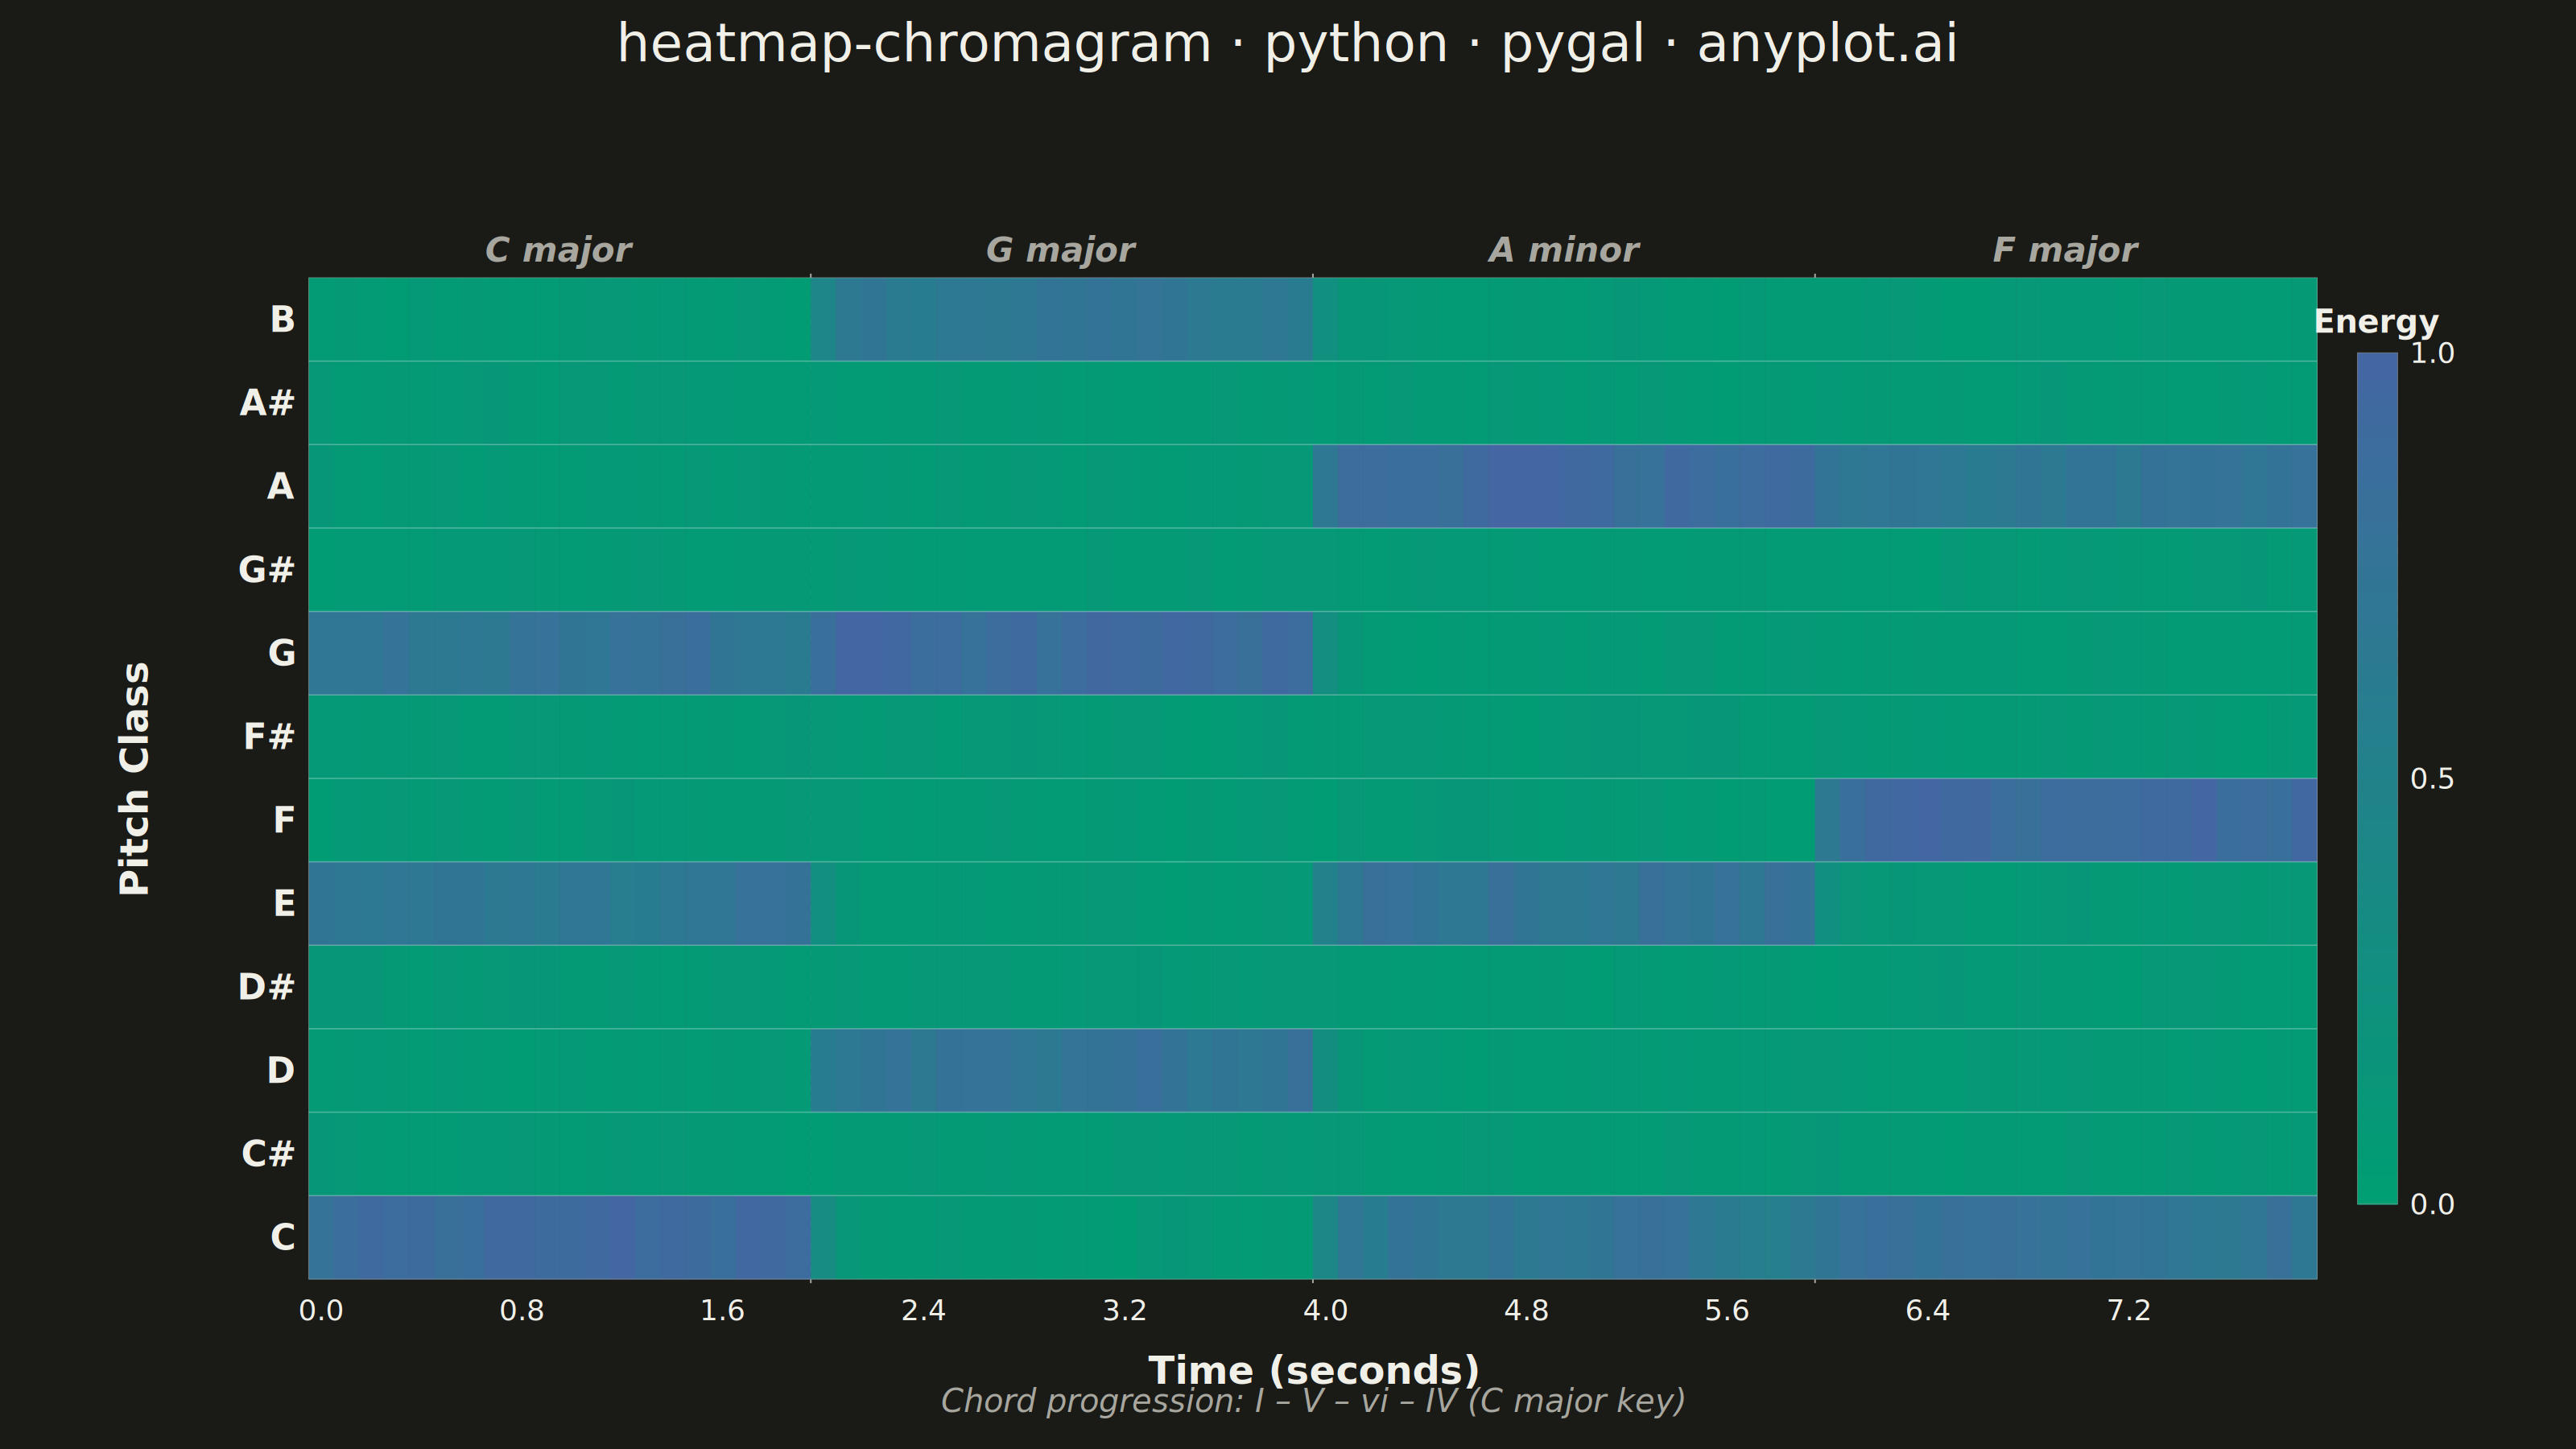
A heatmap-style visualization showing the energy distribution across the 12 pitch classes (C, C#, D, D#, E, F, F#, G, G#, A, A#, B) over time. Each column represents a time frame and each row a pitch class, with color intensity indicating the energy or magnitude at that pitch-time point. Widely used in music information retrieval to analyze harmonic content, detect chords, estimate musical key, and study tonal progressions in audio signals.
""" anyplot.ai
heatmap-chromagram: Music Chromagram (Pitch Class Distribution over Time)
Library: pygal 3.1.3 | Python 3.13.14
Quality: 90/100 | Updated: 2026-06-24
"""

import os
import sys

import numpy as np


THEME = os.getenv("ANYPLOT_THEME", "light")
PAGE_BG = "#FAF8F1" if THEME == "light" else "#1A1A17"
INK = "#1A1A17" if THEME == "light" else "#F0EFE8"
INK_MUTED = "#6B6A63" if THEME == "light" else "#A8A79F"

IMPRINT_PALETTE = ("#009E73", "#C475FD", "#4467A3", "#BD8233", "#AE3030", "#2ABCCD", "#954477", "#99B314")

# Imprint sequential colormap: #009E73 → #4467A3 (20 stops)
_N = 20
_c0, _c1 = (0, 158, 115), (68, 103, 163)
SEQ_CMAP = [
    "#{:02X}{:02X}{:02X}".format(
        round(_c0[0] + (_c1[0] - _c0[0]) * i / (_N - 1)),
        round(_c0[1] + (_c1[1] - _c0[1]) * i / (_N - 1)),
        round(_c0[2] + (_c1[2] - _c0[2]) * i / (_N - 1)),
    )
    for i in range(_N)
]

# Pop cwd from path so this file (pygal.py) doesn't shadow the pygal package
_p0 = sys.path.pop(0) if sys.path else ""
from pygal.graph.graph import Graph
from pygal.style import Style


sys.path.insert(0, _p0)


def _lerp_color(value, vmin=0.0, vmax=1.0):
    t = max(0.0, min(1.0, (value - vmin) / (vmax - vmin))) * (len(SEQ_CMAP) - 1)
    i, j = int(t), min(int(t) + 1, len(SEQ_CMAP) - 1)
    f = t - i
    c0, c1 = SEQ_CMAP[i], SEQ_CMAP[j]
    r = int(int(c0[1:3], 16) + (int(c1[1:3], 16) - int(c0[1:3], 16)) * f)
    g = int(int(c0[3:5], 16) + (int(c1[3:5], 16) - int(c0[3:5], 16)) * f)
    b = int(int(c0[5:7], 16) + (int(c1[5:7], 16) - int(c0[5:7], 16)) * f)
    return f"#{r:02x}{g:02x}{b:02x}"


def _render_heatmap(chart):
    if not chart.chroma_data:
        return

    n_rows, n_cols = len(chart.chroma_data), len(chart.chroma_data[0])
    m_l, m_b, m_t, m_r = 245, 180, 80, 300
    cw = (chart.view.width - m_l - m_r) / n_cols
    ch = (chart.view.height - m_b - m_t) / n_rows
    gw, gh = n_cols * cw, n_rows * ch
    x0 = chart.view.x(0) + m_l
    y0 = chart.view.y(n_rows) + m_t

    node = chart.svg.node(chart.nodes["plot"], class_="chroma-heatmap")

    # Chord region background bands — opacity raised to be clearly visible (DE-01)
    for k, reg in enumerate(chart.chord_regions):
        rx = x0 + reg["start"] * cw
        rw = (reg["end"] - reg["start"]) * cw
        chart.svg.node(node, "rect", x=rx, y=y0, width=rw, height=gh, fill=chart.ink, opacity=["0.12", "0.17"][k % 2])
        t = chart.svg.node(node, "text", x=rx + rw / 2, y=y0 - 20)
        t.set("text-anchor", "middle")
        t.set("fill", chart.ink_muted)
        t.set("style", "font-size:42px;font-weight:bold;font-family:sans-serif;font-style:italic")
        t.text = reg["label"]
        if reg["start"] > 0:
            chart.svg.node(
                node, "line", x1=rx, y1=y0 - 5, x2=rx, y2=y0 + gh + 5, stroke=chart.ink_muted, fill="none"
            ).set("style", "stroke-width:2;stroke-dasharray:8,6")

    # Subtitle below x-axis
    st = chart.svg.node(node, "text", x=x0 + gw / 2, y=y0 + gh + 165)
    st.set("text-anchor", "middle")
    st.set("fill", chart.ink_muted)
    st.set("style", "font-size:40px;font-family:sans-serif;font-style:italic")
    st.text = "Chord progression: I – V – vi – IV (C major key)"

    # Heatmap cells with SVG tooltip titles (pygal interactive feature)
    for i in range(n_rows):
        rg = chart.svg.node(node, "g", class_=f"row-{i}")
        for j in range(n_cols):
            v = chart.chroma_data[i][j]
            rect = chart.svg.node(
                rg,
                "rect",
                x=x0 + j * cw,
                y=y0 + i * ch,
                width=cw + 0.5,
                height=ch + 0.5,
                fill=_lerp_color(v),
                stroke="none",
            )
            chart.svg.node(rect, "title").text = f"{chart.pitch_labels[i]} @ {chart.time_labels[j]}s — Energy: {v:.3f}"

    # Thin horizontal pitch-row separators
    for i in range(1, n_rows):
        chart.svg.node(
            node,
            "line",
            x1=x0,
            y1=y0 + i * ch,
            x2=x0 + gw,
            y2=y0 + i * ch,
            stroke="#ffffff",
            fill="none",
            opacity="0.3",
        ).set("style", "stroke-width:1.5")

    # Heatmap border — INK_MUTED at 0.5 opacity to unify fine chrome (DE-02)
    chart.svg.node(node, "rect", x=x0, y=y0, width=gw, height=gh, fill="none", stroke=chart.ink_muted, opacity="0.5")

    # Y-axis: pitch class labels
    row_font = min(44, int(ch * 0.6))
    for i, label in enumerate(chart.pitch_labels):
        t = chart.svg.node(node, "text", x=x0 - 18, y=y0 + i * ch + ch / 2 + row_font * 0.35)
        t.set("text-anchor", "end")
        t.set("fill", chart.ink)
        t.set("style", f"font-size:{row_font}px;font-weight:600;font-family:sans-serif")
        t.text = label

    # Y-axis title (rotated)
    yt_x, yt_y = x0 - 200, y0 + gh / 2
    t = chart.svg.node(node, "text", x=yt_x, y=yt_y)
    t.set("text-anchor", "middle")
    t.set("fill", chart.ink)
    t.set("style", "font-size:48px;font-weight:bold;font-family:sans-serif")
    t.set("transform", f"rotate(-90, {yt_x}, {yt_y})")
    t.text = "Pitch Class"

    # X-axis: time tick labels
    step = max(1, n_cols // 10)
    for j in range(0, n_cols, step):
        t = chart.svg.node(node, "text", x=x0 + j * cw + cw / 2, y=y0 + gh + 51)
        t.set("text-anchor", "middle")
        t.set("fill", chart.ink)
        t.set("style", "font-size:36px;font-family:sans-serif")
        t.text = chart.time_labels[j]

    # X-axis title
    t = chart.svg.node(node, "text", x=x0 + gw / 2, y=y0 + gh + 130)
    t.set("text-anchor", "middle")
    t.set("fill", chart.ink)
    t.set("style", "font-size:48px;font-weight:bold;font-family:sans-serif")
    t.text = "Time (seconds)"

    # Colorbar gradient (high=blue at top, low=green at bottom)
    cb_w, n_seg = 50, 60
    cb_h = gh * 0.85
    cb_x, cb_y = x0 + gw + 50, y0 + (gh - cb_h) / 2
    seg_h = cb_h / n_seg
    for s in range(n_seg):
        chart.svg.node(
            node,
            "rect",
            x=cb_x,
            y=cb_y + s * seg_h,
            width=cb_w,
            height=seg_h + 1,
            fill=_lerp_color(1.0 - s / (n_seg - 1)),
        )

    chart.svg.node(
        node, "rect", x=cb_x, y=cb_y, width=cb_w, height=cb_h, fill="none", stroke=chart.ink_muted, opacity="0.5"
    )

    cb_font = 36
    for frac, txt in [(0.0, "1.0"), (0.5, "0.5"), (1.0, "0.0")]:
        t = chart.svg.node(node, "text", x=cb_x + cb_w + 15, y=cb_y + frac * cb_h + cb_font * 0.35)
        t.set("fill", chart.ink)
        t.set("style", f"font-size:{cb_font}px;font-family:sans-serif")
        t.text = txt

    t = chart.svg.node(node, "text", x=cb_x + cb_w / 2, y=cb_y - 25)
    t.set("text-anchor", "middle")
    t.set("fill", chart.ink)
    t.set("style", "font-size:40px;font-weight:bold;font-family:sans-serif")
    t.text = "Energy"


class ChromagramHeatmap(Graph):
    _series_margin = 0

    def __init__(self, chroma_data, pitch_labels, time_labels, chord_regions, ink, ink_muted, **kwargs):
        self.chroma_data = chroma_data
        self.pitch_labels = pitch_labels
        self.time_labels = time_labels
        self.chord_regions = chord_regions
        self.ink = ink
        self.ink_muted = ink_muted
        super().__init__(**kwargs)

    def _compute(self):
        nc = len(self.chroma_data[0]) if self.chroma_data else 1
        nr = len(self.chroma_data) if self.chroma_data else 1
        self._box.xmin, self._box.xmax = 0, nc
        self._box.ymin, self._box.ymax = 0, nr

    def _plot(self):
        _render_heatmap(self)


# Data: C major → G major → A minor → F major chord progression
np.random.seed(42)
pitch_classes = ["C", "C#", "D", "D#", "E", "F", "F#", "G", "G#", "A", "A#", "B"]
n_pitches, n_frames = len(pitch_classes), 80
time_positions = [f"{i * 0.1:.1f}" for i in range(n_frames)]

chroma = np.random.uniform(0.02, 0.12, (n_pitches, n_frames))
for f in range(0, 20):
    chroma[0, f] += np.random.uniform(0.7, 0.95)
    chroma[4, f] += np.random.uniform(0.5, 0.75)
    chroma[7, f] += np.random.uniform(0.55, 0.8)
for f in range(20, 40):
    chroma[7, f] += np.random.uniform(0.7, 0.95)
    chroma[11, f] += np.random.uniform(0.5, 0.75)
    chroma[2, f] += np.random.uniform(0.55, 0.8)
for f in range(40, 60):
    chroma[9, f] += np.random.uniform(0.7, 0.95)
    chroma[0, f] += np.random.uniform(0.5, 0.75)
    chroma[4, f] += np.random.uniform(0.55, 0.8)
for f in range(60, 80):
    chroma[5, f] += np.random.uniform(0.7, 0.95)
    chroma[9, f] += np.random.uniform(0.5, 0.75)
    chroma[0, f] += np.random.uniform(0.55, 0.8)
for f in range(n_frames - 1):
    chroma[:, f + 1] = 0.3 * chroma[:, f] + 0.7 * chroma[:, f + 1]
chroma = np.clip(chroma, 0, 1)

chroma_display = chroma[::-1]
pitch_labels_display = pitch_classes[::-1]
chord_regions = [
    {"start": 0, "end": 20, "label": "C major"},
    {"start": 20, "end": 40, "label": "G major"},
    {"start": 40, "end": 60, "label": "A minor"},
    {"start": 60, "end": 80, "label": "F major"},
]

custom_style = Style(
    background=PAGE_BG,
    plot_background=PAGE_BG,
    foreground=INK,
    foreground_strong=INK,
    foreground_subtle=INK_MUTED,
    colors=IMPRINT_PALETTE,
    title_font_size=66,
    label_font_size=56,
    major_label_font_size=44,
    legend_font_size=44,
    value_font_size=36,
    font_family="sans-serif",
)

chart = ChromagramHeatmap(
    chroma_data=chroma_display.tolist(),
    pitch_labels=pitch_labels_display,
    time_labels=time_positions,
    chord_regions=chord_regions,
    ink=INK,
    ink_muted=INK_MUTED,
    width=3200,
    height=1800,
    style=custom_style,
    title="heatmap-chromagram · python · pygal · anyplot.ai",
    show_legend=False,
    margin=80,
    margin_top=160,
    margin_bottom=60,
    show_x_labels=False,
    show_y_labels=False,
)
chart.add("chromagram", [0])

chart.render_to_file(f"plot-{THEME}.svg")
chart.render_to_png(f"plot-{THEME}.png")

svg_content = chart.render(is_unicode=True)
with open(f"plot-{THEME}.html", "w", encoding="utf-8") as f:
    f.write(
        "<!DOCTYPE html>\n<html>\n<head>\n"
        '    <meta charset="utf-8">\n'
        "    <title>heatmap-chromagram - python - pygal - anyplot.ai</title>\n"
        "    <style>\n"
        f"        body {{ margin: 0; display: flex; justify-content: center;"
        f" align-items: center; min-height: 100vh; background: {PAGE_BG}; }}\n"
        "        .chart { max-width: 100%; height: auto; }\n"
        "    </style>\n"
        "</head>\n<body>\n"
        '    <figure class="chart">\n' + svg_content + "\n    </figure>\n</body>\n</html>\n"
    )
Runnable source as JSON, for any HTTP client: https://api.anyplot.ai/specs/heatmap-chromagram/pygal/code. Any spec id and library id listed in llms-full.txt fit the same URL shape; every URL below is complete and callable.
{
  "spec_id": "heatmap-chromagram",
  "language": "python",
  "library": "pygal",
  "page": "https://anyplot.ai/heatmap-chromagram/python/pygal",
  "hub": "https://anyplot.ai/heatmap-chromagram",
  "code_json": "https://api.anyplot.ai/specs/heatmap-chromagram/pygal/code",
  "spec_json": "https://api.anyplot.ai/specs/heatmap-chromagram",
  "render_light_png": "https://storage.googleapis.com/anyplot-images/plots/heatmap-chromagram/python/pygal/plot-light.png",
  "render_dark_png": "https://storage.googleapis.com/anyplot-images/plots/heatmap-chromagram/python/pygal/plot-dark.png",
  "interactive_light_html": "https://storage.googleapis.com/anyplot-images/plots/heatmap-chromagram/python/pygal/plot-light.html",
  "interactive_dark_html": "https://storage.googleapis.com/anyplot-images/plots/heatmap-chromagram/python/pygal/plot-dark.html",
  "quality_score": 90.0,
  "license": "MIT",
  "guide": "https://anyplot.ai/llms.txt"
}
Part of Music Chromagram (Pitch Class Distribution over Time) on anyplot.ai.