The same plot in 14 other libraries — JavaScript: D3.js, Apache ECharts, Highcharts, MUI X Charts; Python: Altair, Bokeh, lets-plot, Matplotlib, Plotly, plotnine, Pygal, Seaborn; R: ggplot2; Julia: Makie.jl. Compare all 15 side by side: Music Chromagram (Pitch Class Distribution over Time) in Python, R, Julia and JavaScript.
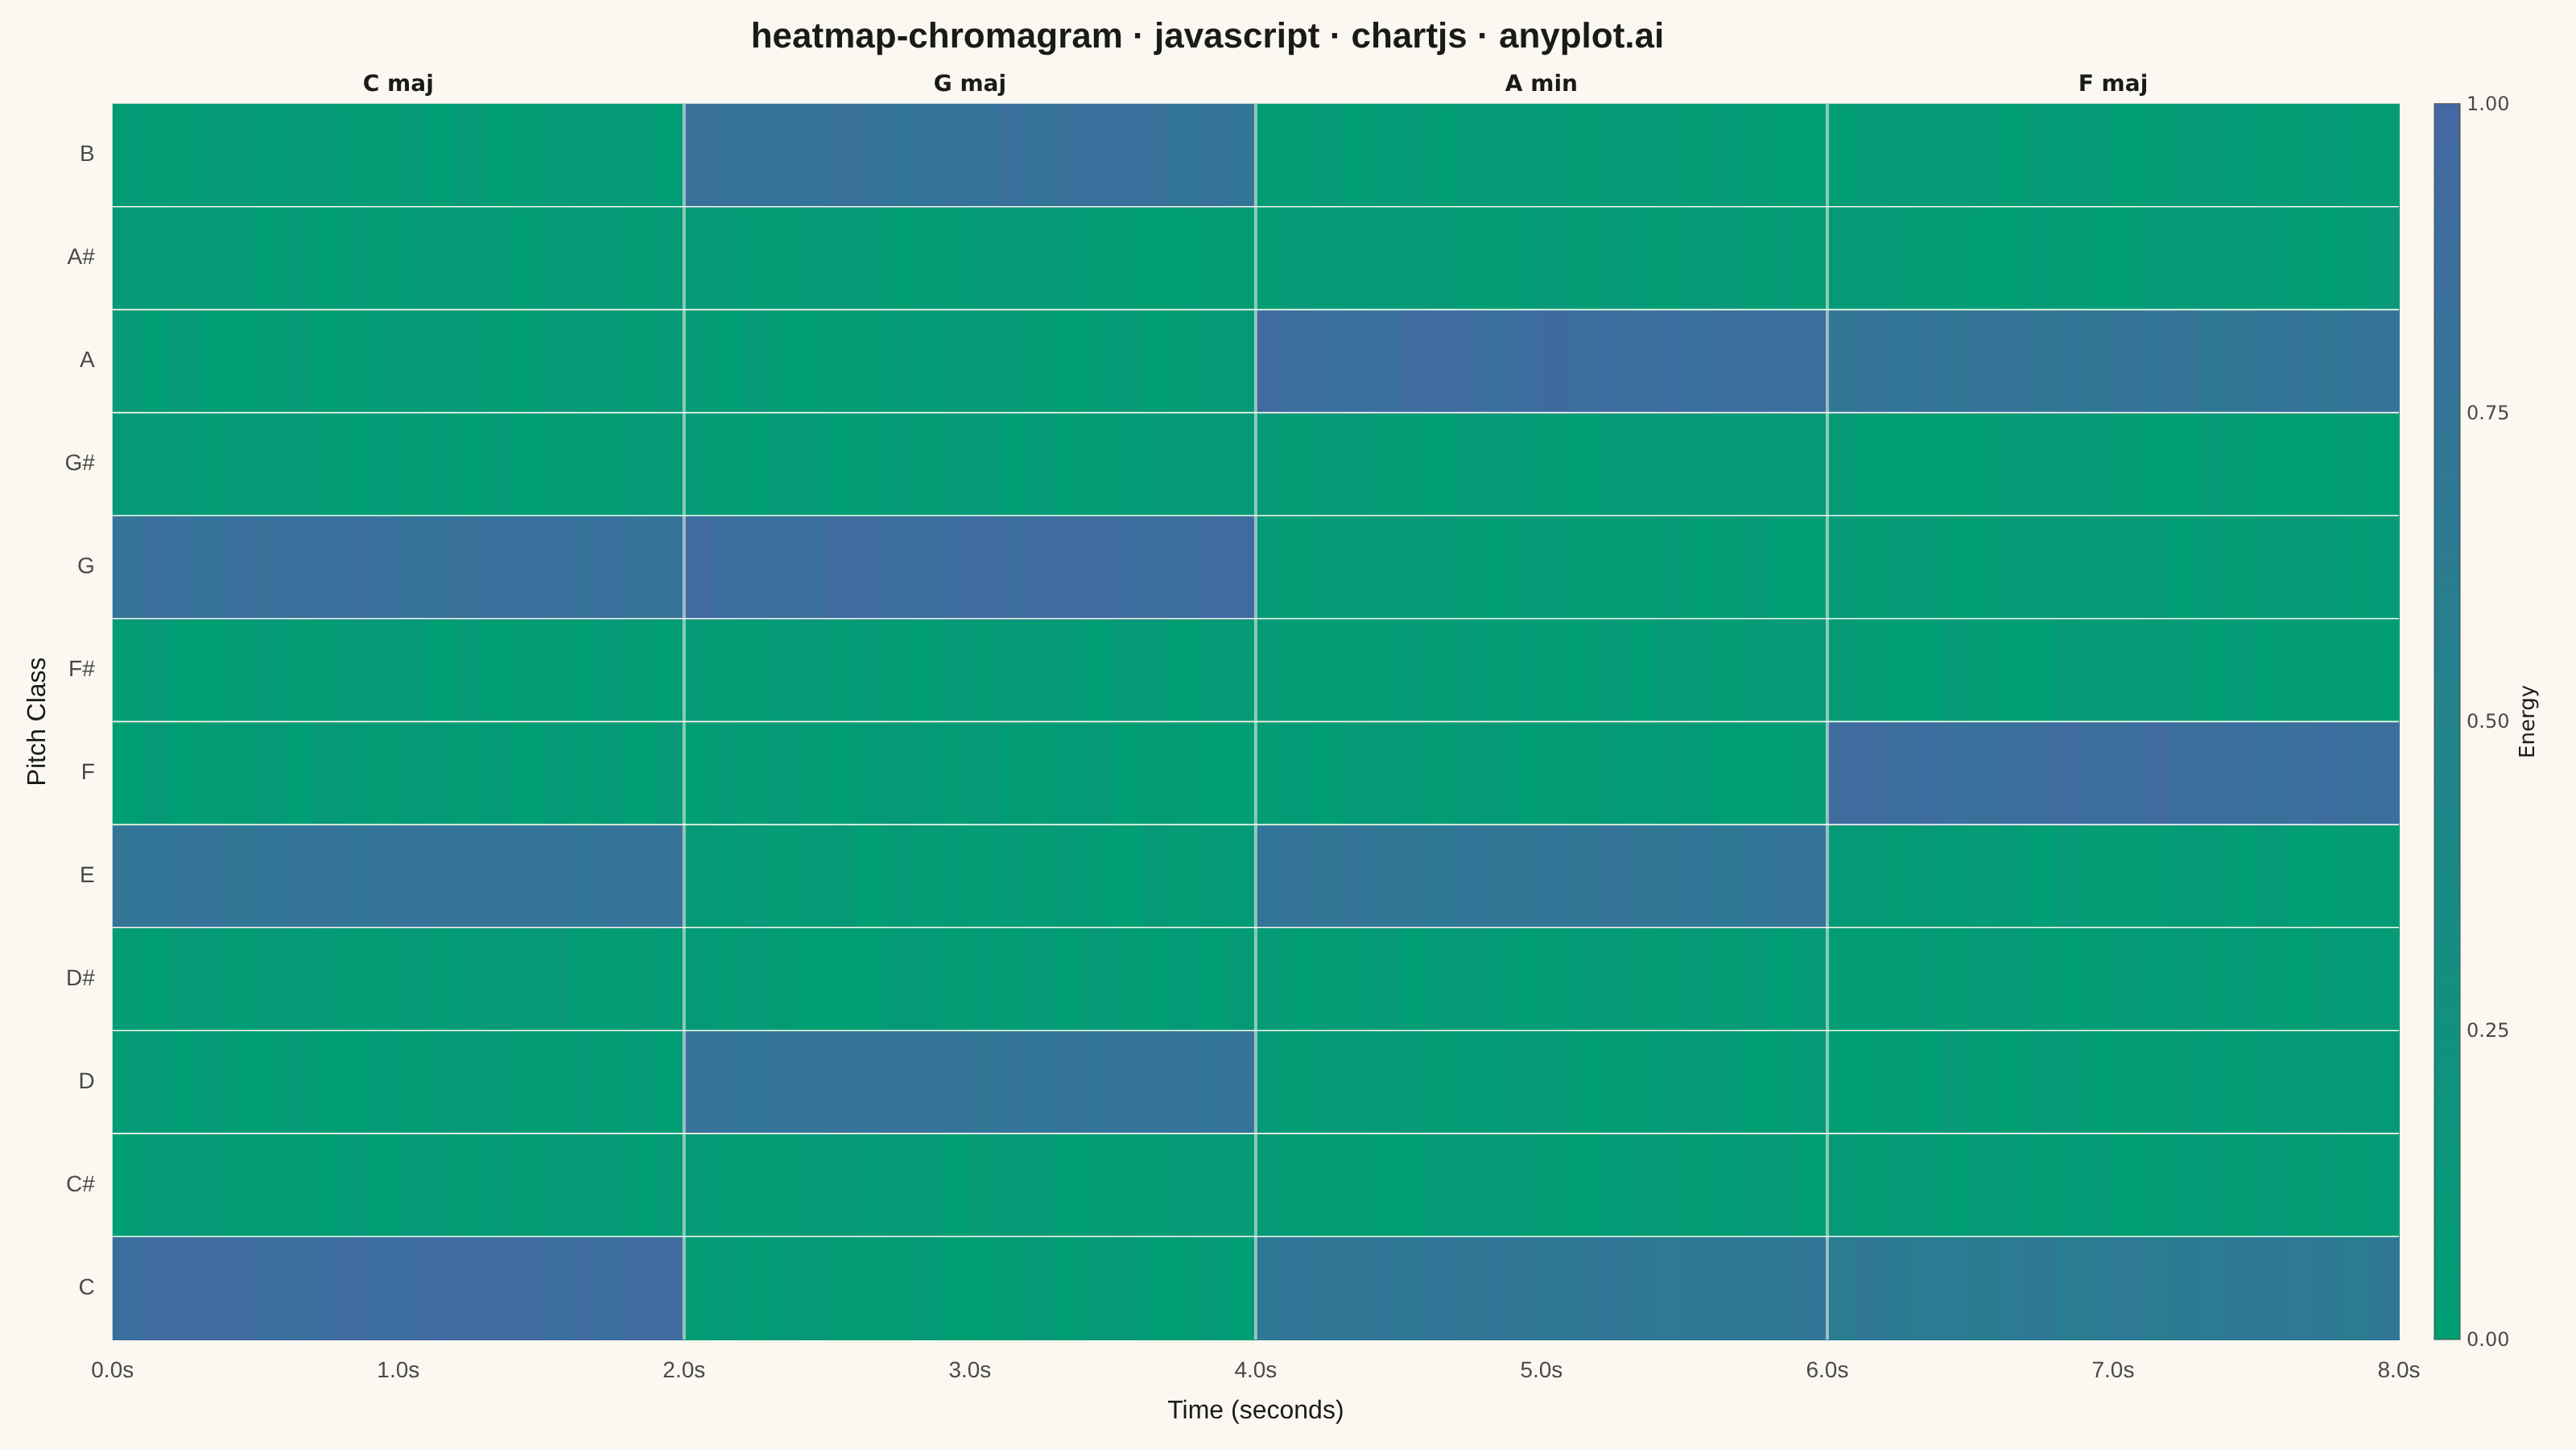
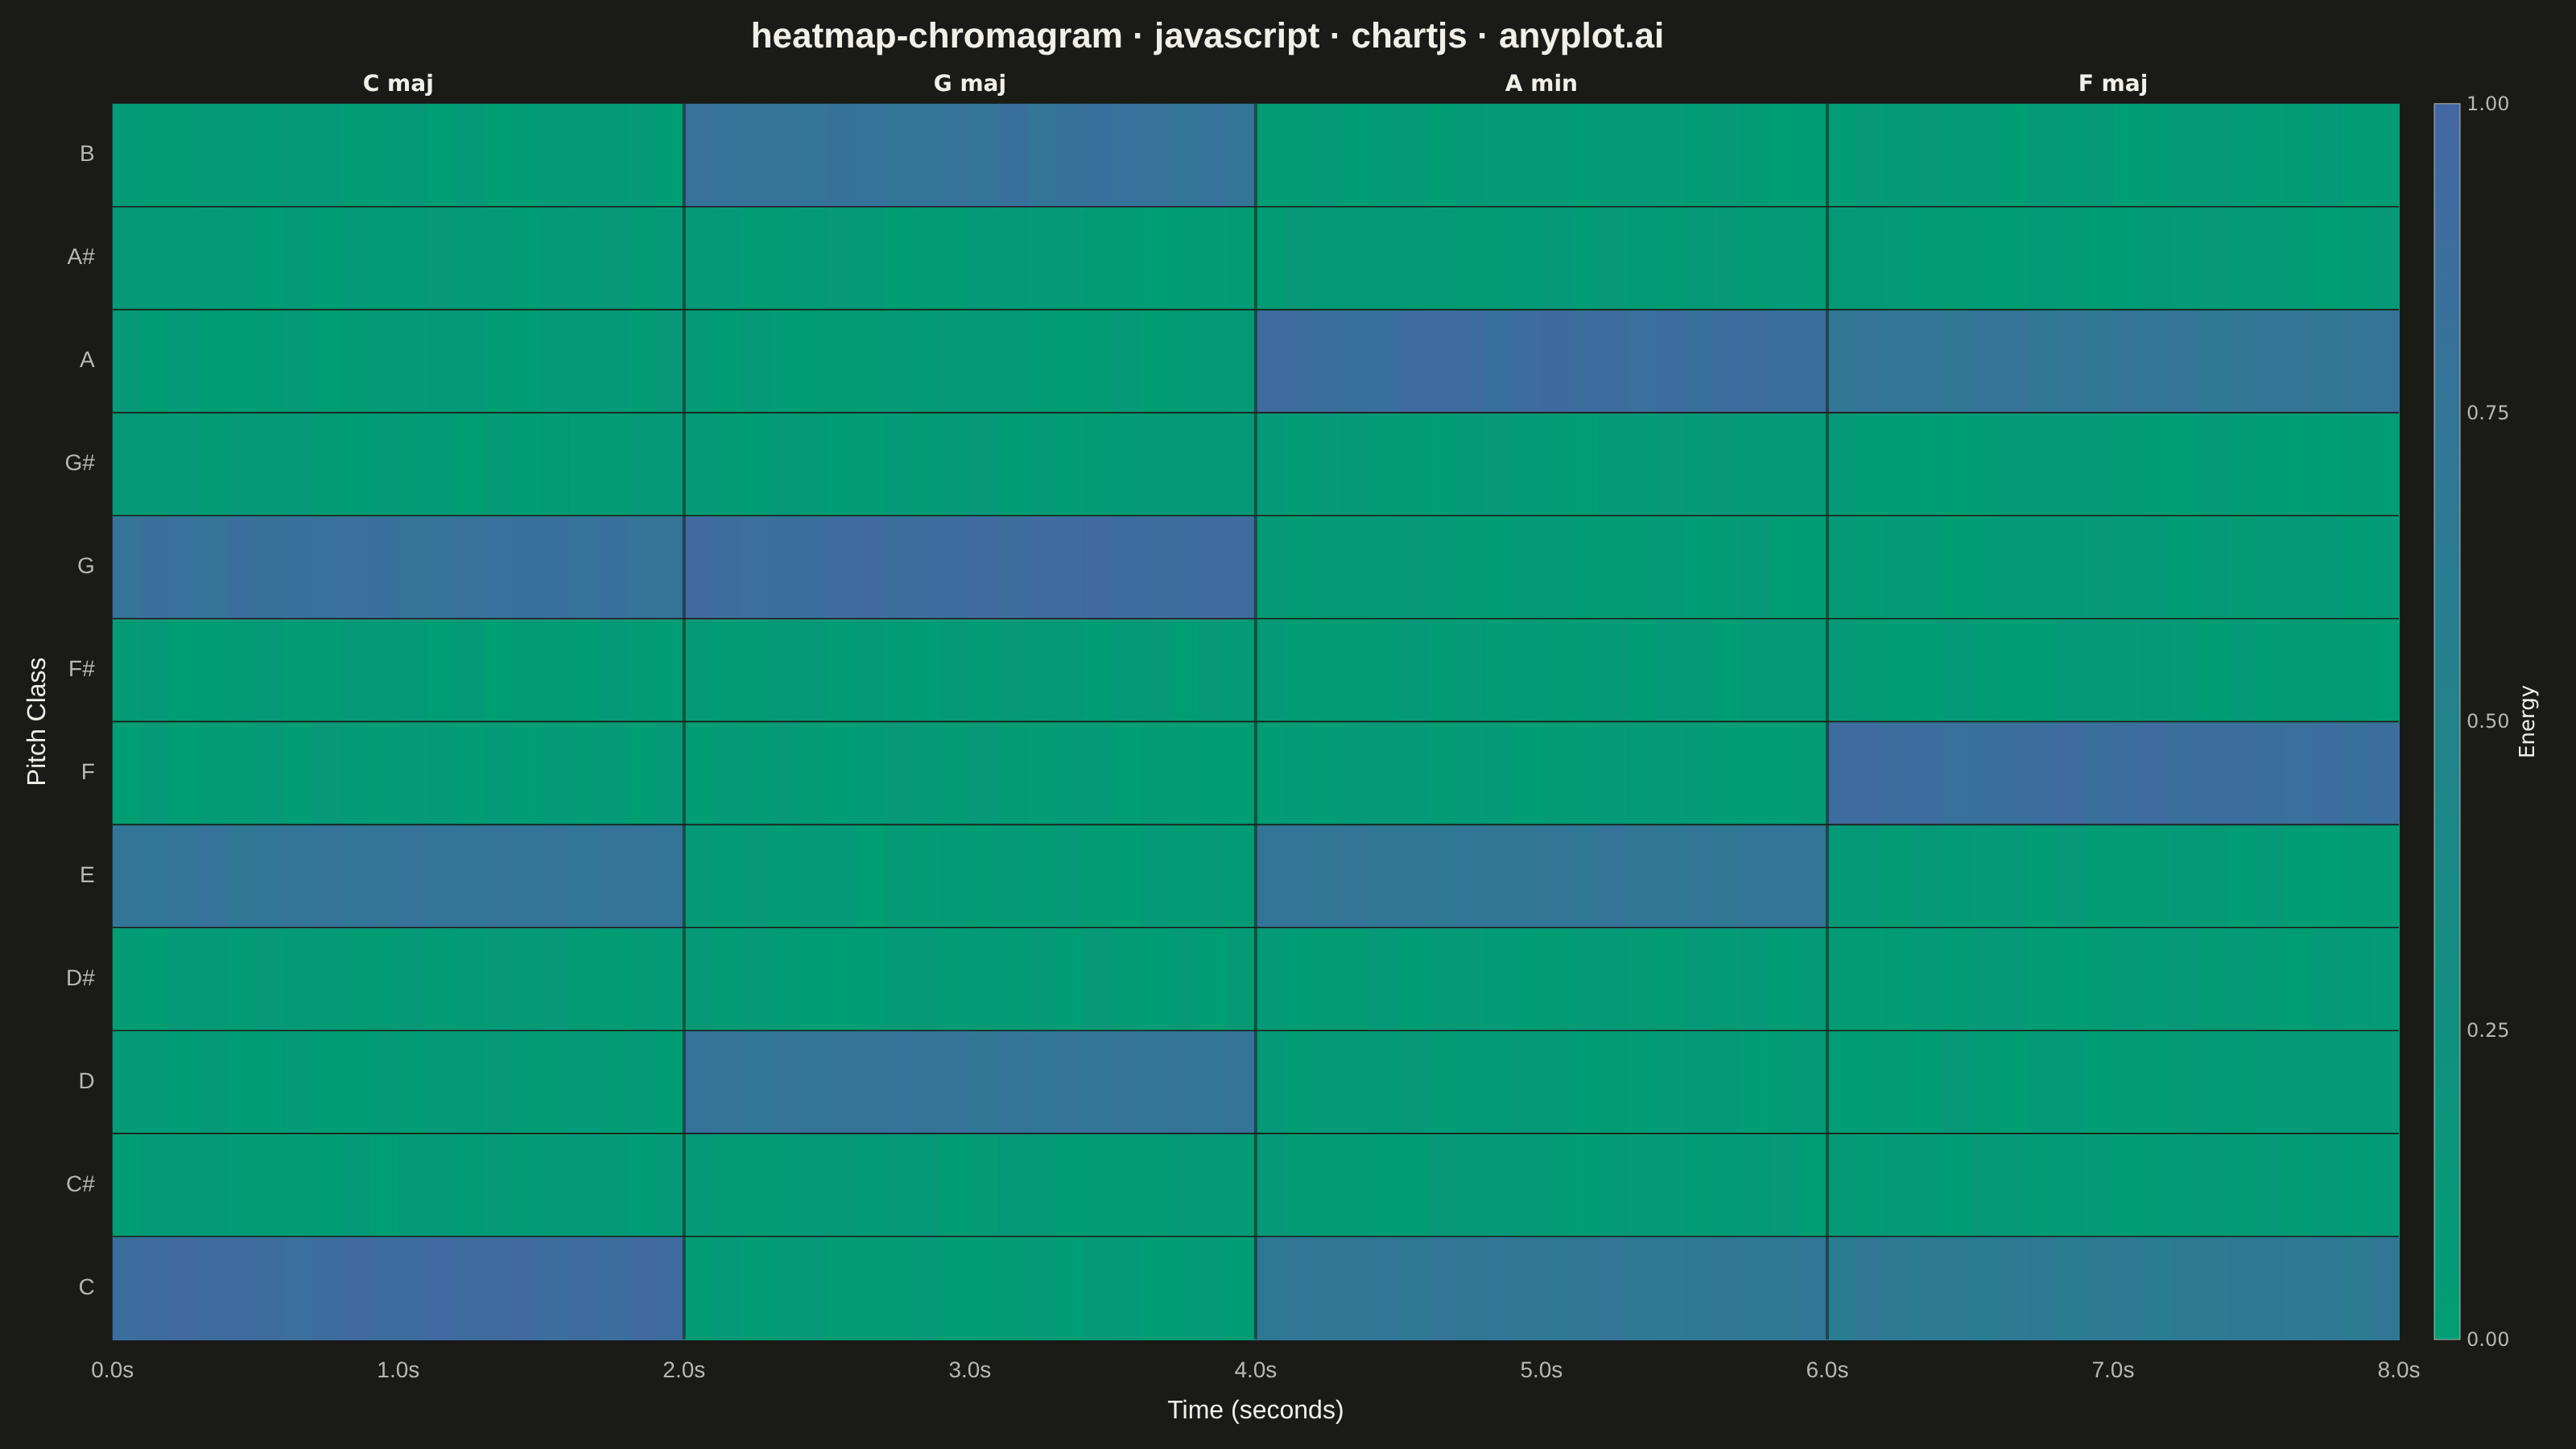
A heatmap-style visualization showing the energy distribution across the 12 pitch classes (C, C#, D, D#, E, F, F#, G, G#, A, A#, B) over time. Each column represents a time frame and each row a pitch class, with color intensity indicating the energy or magnitude at that pitch-time point. Widely used in music information retrieval to analyze harmonic content, detect chords, estimate musical key, and study tonal progressions in audio signals.
// anyplot.ai
// heatmap-chromagram: Music Chromagram (Pitch Class Distribution over Time)
// Library: chartjs 4.4.7 | JavaScript 22.22.3
// Quality: 90/100 | Created: 2026-06-24

//# anyplot-orientation: landscape

const t = window.ANYPLOT_TOKENS;

// --- Data (deterministic chord simulation) ---
const PITCH_CLASSES = ["C", "C#", "D", "D#", "E", "F", "F#", "G", "G#", "A", "A#", "B"];
const NUM_FRAMES = 80;
const CHORD_PROFILES = [
  [0.90, 0.05, 0.05, 0.05, 0.76, 0.05, 0.05, 0.82, 0.05, 0.05, 0.05, 0.05], // C major: C E G
  [0.05, 0.05, 0.76, 0.05, 0.05, 0.05, 0.05, 0.90, 0.05, 0.05, 0.05, 0.79], // G major: G B D
  [0.70, 0.05, 0.05, 0.05, 0.73, 0.05, 0.05, 0.05, 0.05, 0.88, 0.05, 0.05], // A minor: A C E
  [0.66, 0.05, 0.05, 0.05, 0.05, 0.88, 0.05, 0.05, 0.05, 0.74, 0.05, 0.05], // F major: F A C
];
const CHORD_LABELS = ["C maj", "G maj", "A min", "F maj"];

let seed = 42;
const lcg = () => { seed = (seed * 1664525 + 1013904223) & 0xffffffff; return (seed >>> 0) / 4294967295; };

const energy = Array.from({ length: 12 }, () => new Array(NUM_FRAMES).fill(0));
for (let f = 0; f < NUM_FRAMES; f++) {
  const profile = CHORD_PROFILES[Math.floor(f / 20) % 4];
  for (let p = 0; p < 12; p++) {
    energy[p][f] = Math.min(1, Math.max(0, profile[p] + (lcg() - 0.5) * 0.10));
  }
}

// --- Color (Imprint sequential: t.seq[0]=#009E73 → t.seq[1]=#4467A3) ---
const [sR, sG, sB] = t.seq[0].match(/[\da-f]{2}/gi).map(h => parseInt(h, 16));
const [eR, eG, eB] = t.seq[1].match(/[\da-f]{2}/gi).map(h => parseInt(h, 16));
function energyToColor(v) {
  v = Math.min(1, Math.max(0, v));
  return `rgb(${Math.round(sR + (eR - sR) * v)},${Math.round(sG + (eG - sG) * v)},${Math.round(sB + (eB - sB) * v)})`;
}

// --- Plugin: heatmap cells, separators, chord markers + labels, colorbar ---
const chromagramPlugin = {
  id: "chromagram",
  afterDraw(chart) {
    const ctx = chart.ctx;
    const { x: xScale, y: yScale } = chart.scales;

    // Heatmap cells
    for (let f = 0; f < NUM_FRAMES; f++) {
      const xL = xScale.getPixelForValue(f);
      const xR = xScale.getPixelForValue(f + 1);
      for (let p = 0; p < 12; p++) {
        const yT = yScale.getPixelForValue(p + 1);
        const yB = yScale.getPixelForValue(p);
        ctx.fillStyle = energyToColor(energy[p][f]);
        ctx.fillRect(xL, yT, xR - xL + 0.5, yB - yT + 0.5);
      }
    }

    // Thin row separators (page bg color delineates pitch classes)
    ctx.strokeStyle = t.pageBg;
    ctx.lineWidth = 0.8;
    for (let p = 1; p < 12; p++) {
      const y = yScale.getPixelForValue(p);
      ctx.beginPath();
      ctx.moveTo(xScale.left, y);
      ctx.lineTo(xScale.right, y);
      ctx.stroke();
    }

    // Chord-change markers at 2s / 4s / 6s
    ctx.globalAlpha = 0.55;
    ctx.strokeStyle = t.pageBg;
    ctx.lineWidth = 2;
    for (let f = 20; f < NUM_FRAMES; f += 20) {
      const x = xScale.getPixelForValue(f);
      ctx.beginPath();
      ctx.moveTo(x, yScale.top);
      ctx.lineTo(x, yScale.bottom);
      ctx.stroke();
    }
    ctx.globalAlpha = 1;

    // Chord section labels above each section
    ctx.fillStyle = t.ink;
    ctx.font = "bold 14px system-ui, sans-serif";
    ctx.textAlign = "center";
    for (let c = 0; c < 4; c++) {
      const cx = (xScale.getPixelForValue(c * 20) + xScale.getPixelForValue((c + 1) * 20)) / 2;
      ctx.fillText(CHORD_LABELS[c], cx, yScale.top - 8);
    }

    // Colorbar
    const cbX = xScale.right + 22;
    const cbY = yScale.top;
    const cbH = yScale.bottom - yScale.top;
    const cbW = 16;
    const grad = ctx.createLinearGradient(0, cbY + cbH, 0, cbY);
    for (let i = 0; i <= 20; i++) grad.addColorStop(i / 20, energyToColor(i / 20));
    ctx.fillStyle = grad;
    ctx.fillRect(cbX, cbY, cbW, cbH);
    ctx.strokeStyle = t.inkSoft;
    ctx.lineWidth = 0.5;
    ctx.strokeRect(cbX, cbY, cbW, cbH);

    // Colorbar tick labels
    ctx.fillStyle = t.inkSoft;
    ctx.font = "12px system-ui, sans-serif";
    ctx.textAlign = "left";
    for (let i = 0; i <= 4; i++) {
      const v = i / 4;
      ctx.fillText(v.toFixed(2), cbX + cbW + 4, cbY + cbH - v * cbH + 4);
    }

    // Colorbar axis label (rotated)
    ctx.save();
    ctx.fillStyle = t.ink;
    ctx.font = "13px system-ui, sans-serif";
    ctx.textAlign = "center";
    ctx.translate(cbX + cbW + 46, cbY + cbH / 2);
    ctx.rotate(-Math.PI / 2);
    ctx.fillText("Energy", 0, 0);
    ctx.restore();
  },
};

// --- Mount ---
const canvas = document.createElement("canvas");
document.getElementById("container").appendChild(canvas);

// --- Chart ---
new Chart(canvas, {
  type: "scatter",
  data: { datasets: [] },
  plugins: [chromagramPlugin],
  options: {
    responsive: true,
    maintainAspectRatio: false,
    animation: false,
    layout: {
      padding: { top: 10, right: 110, bottom: 10, left: 10 },
    },
    plugins: {
      title: {
        display: true,
        text: "heatmap-chromagram · javascript · chartjs · anyplot.ai",
        color: t.ink,
        font: { size: 22, weight: "bold" },
        padding: { bottom: 28 },
      },
      legend: { display: false },
      tooltip: { enabled: false },
    },
    scales: {
      x: {
        type: "linear",
        min: 0,
        max: NUM_FRAMES,
        title: {
          display: true,
          text: "Time (seconds)",
          color: t.ink,
          font: { size: 16 },
        },
        afterBuildTicks(scale) {
          scale.ticks = [0, 10, 20, 30, 40, 50, 60, 70, 80].map((v) => ({ value: v }));
        },
        ticks: {
          color: t.inkSoft,
          font: { size: 14 },
          callback: (v) => `${(v * 0.1).toFixed(1)}s`,
        },
        grid: { display: false },
        border: { display: false },
      },
      y: {
        type: "linear",
        min: 0,
        max: 12,
        title: {
          display: true,
          text: "Pitch Class",
          color: t.ink,
          font: { size: 16 },
        },
        afterBuildTicks(scale) {
          scale.ticks = PITCH_CLASSES.map((_, i) => ({ value: i + 0.5 }));
        },
        ticks: {
          color: t.inkSoft,
          font: { size: 14 },
          callback: (v) => PITCH_CLASSES[Math.floor(v)] ?? "",
        },
        grid: { display: false },
        border: { display: false },
      },
    },
  },
});
Runnable source as JSON, for any HTTP client: https://api.anyplot.ai/specs/heatmap-chromagram/chartjs/code. Any spec id and library id listed in llms-full.txt fit the same URL shape; every URL below is complete and callable.
{
  "spec_id": "heatmap-chromagram",
  "language": "javascript",
  "library": "chartjs",
  "page": "https://anyplot.ai/heatmap-chromagram/javascript/chartjs",
  "hub": "https://anyplot.ai/heatmap-chromagram",
  "code_json": "https://api.anyplot.ai/specs/heatmap-chromagram/chartjs/code",
  "spec_json": "https://api.anyplot.ai/specs/heatmap-chromagram",
  "render_light_png": "https://storage.googleapis.com/anyplot-images/plots/heatmap-chromagram/javascript/chartjs/plot-light.png",
  "render_dark_png": "https://storage.googleapis.com/anyplot-images/plots/heatmap-chromagram/javascript/chartjs/plot-dark.png",
  "interactive_light_html": "https://storage.googleapis.com/anyplot-images/plots/heatmap-chromagram/javascript/chartjs/plot-light.html",
  "interactive_dark_html": "https://storage.googleapis.com/anyplot-images/plots/heatmap-chromagram/javascript/chartjs/plot-dark.html",
  "quality_score": 90.0,
  "license": "MIT",
  "guide": "https://anyplot.ai/llms.txt"
}
Part of Music Chromagram (Pitch Class Distribution over Time) on anyplot.ai.