The same plot in 14 other libraries — JavaScript: Chart.js, D3.js, Highcharts, MUI X Charts; Python: Altair, Bokeh, lets-plot, Matplotlib, Plotly, plotnine, Pygal, Seaborn; R: ggplot2; Julia: Makie.jl. Compare all 15 side by side: Music Chromagram (Pitch Class Distribution over Time) in Python, R, Julia and JavaScript.
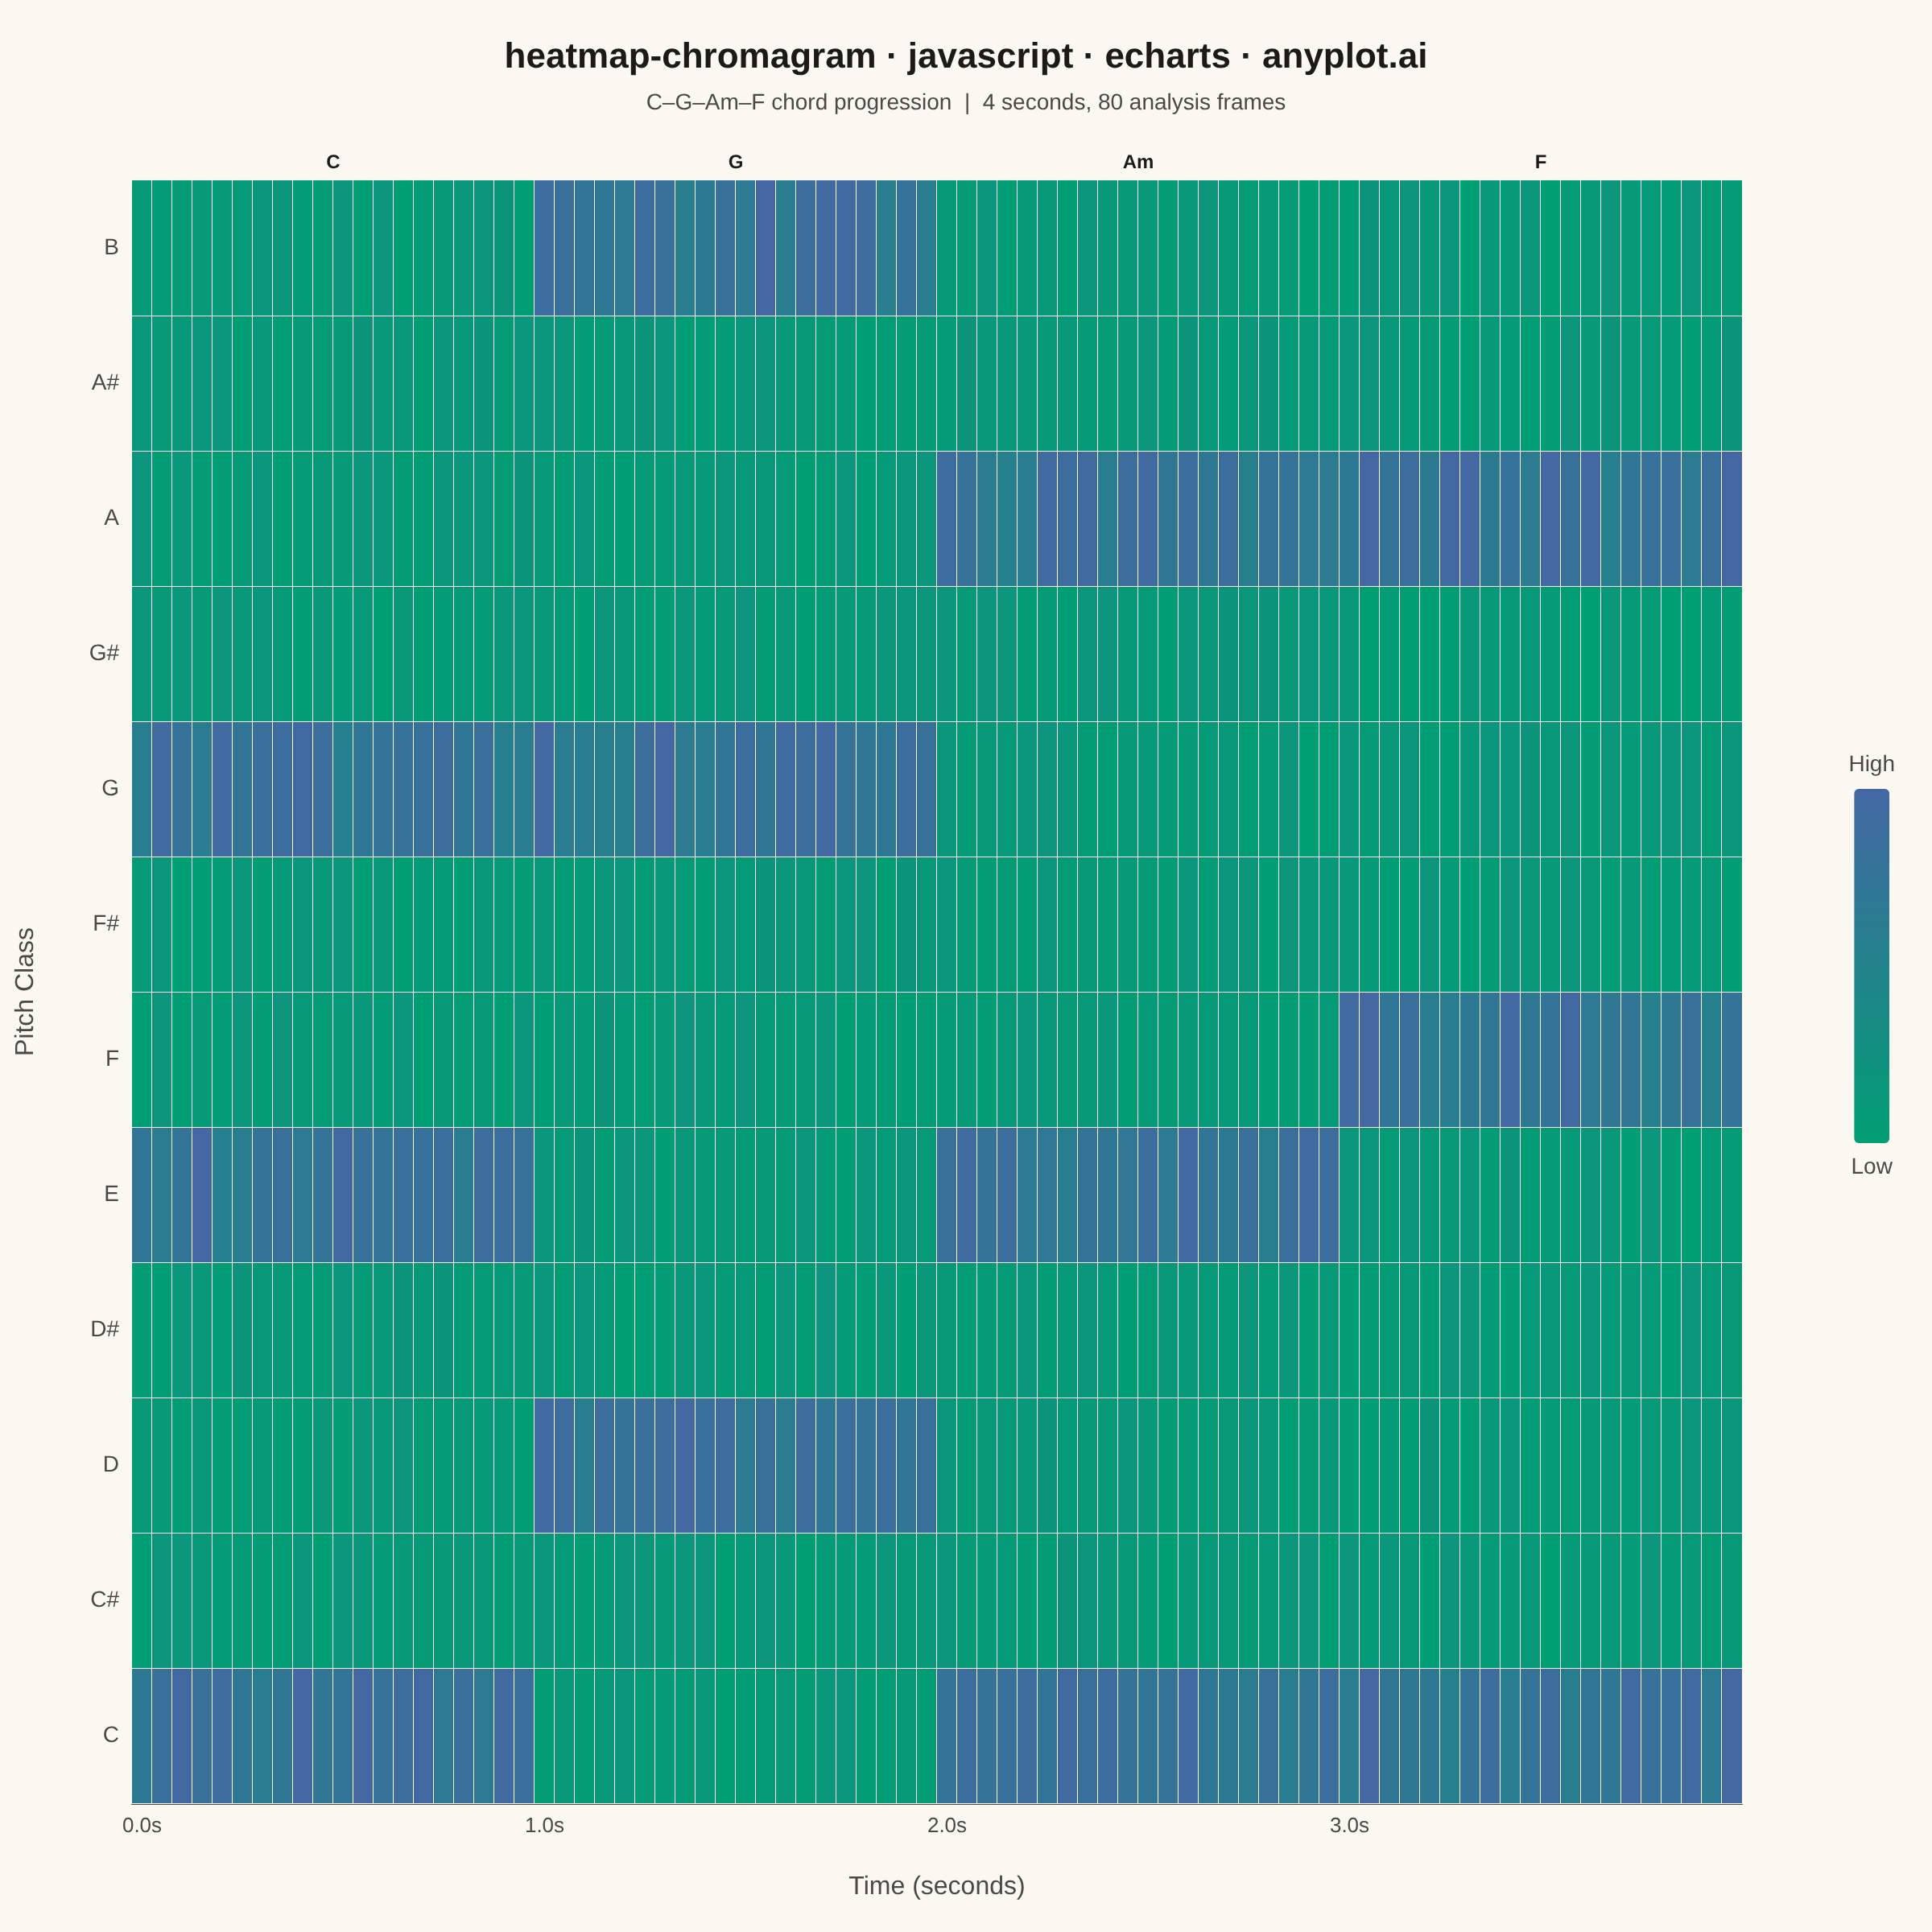
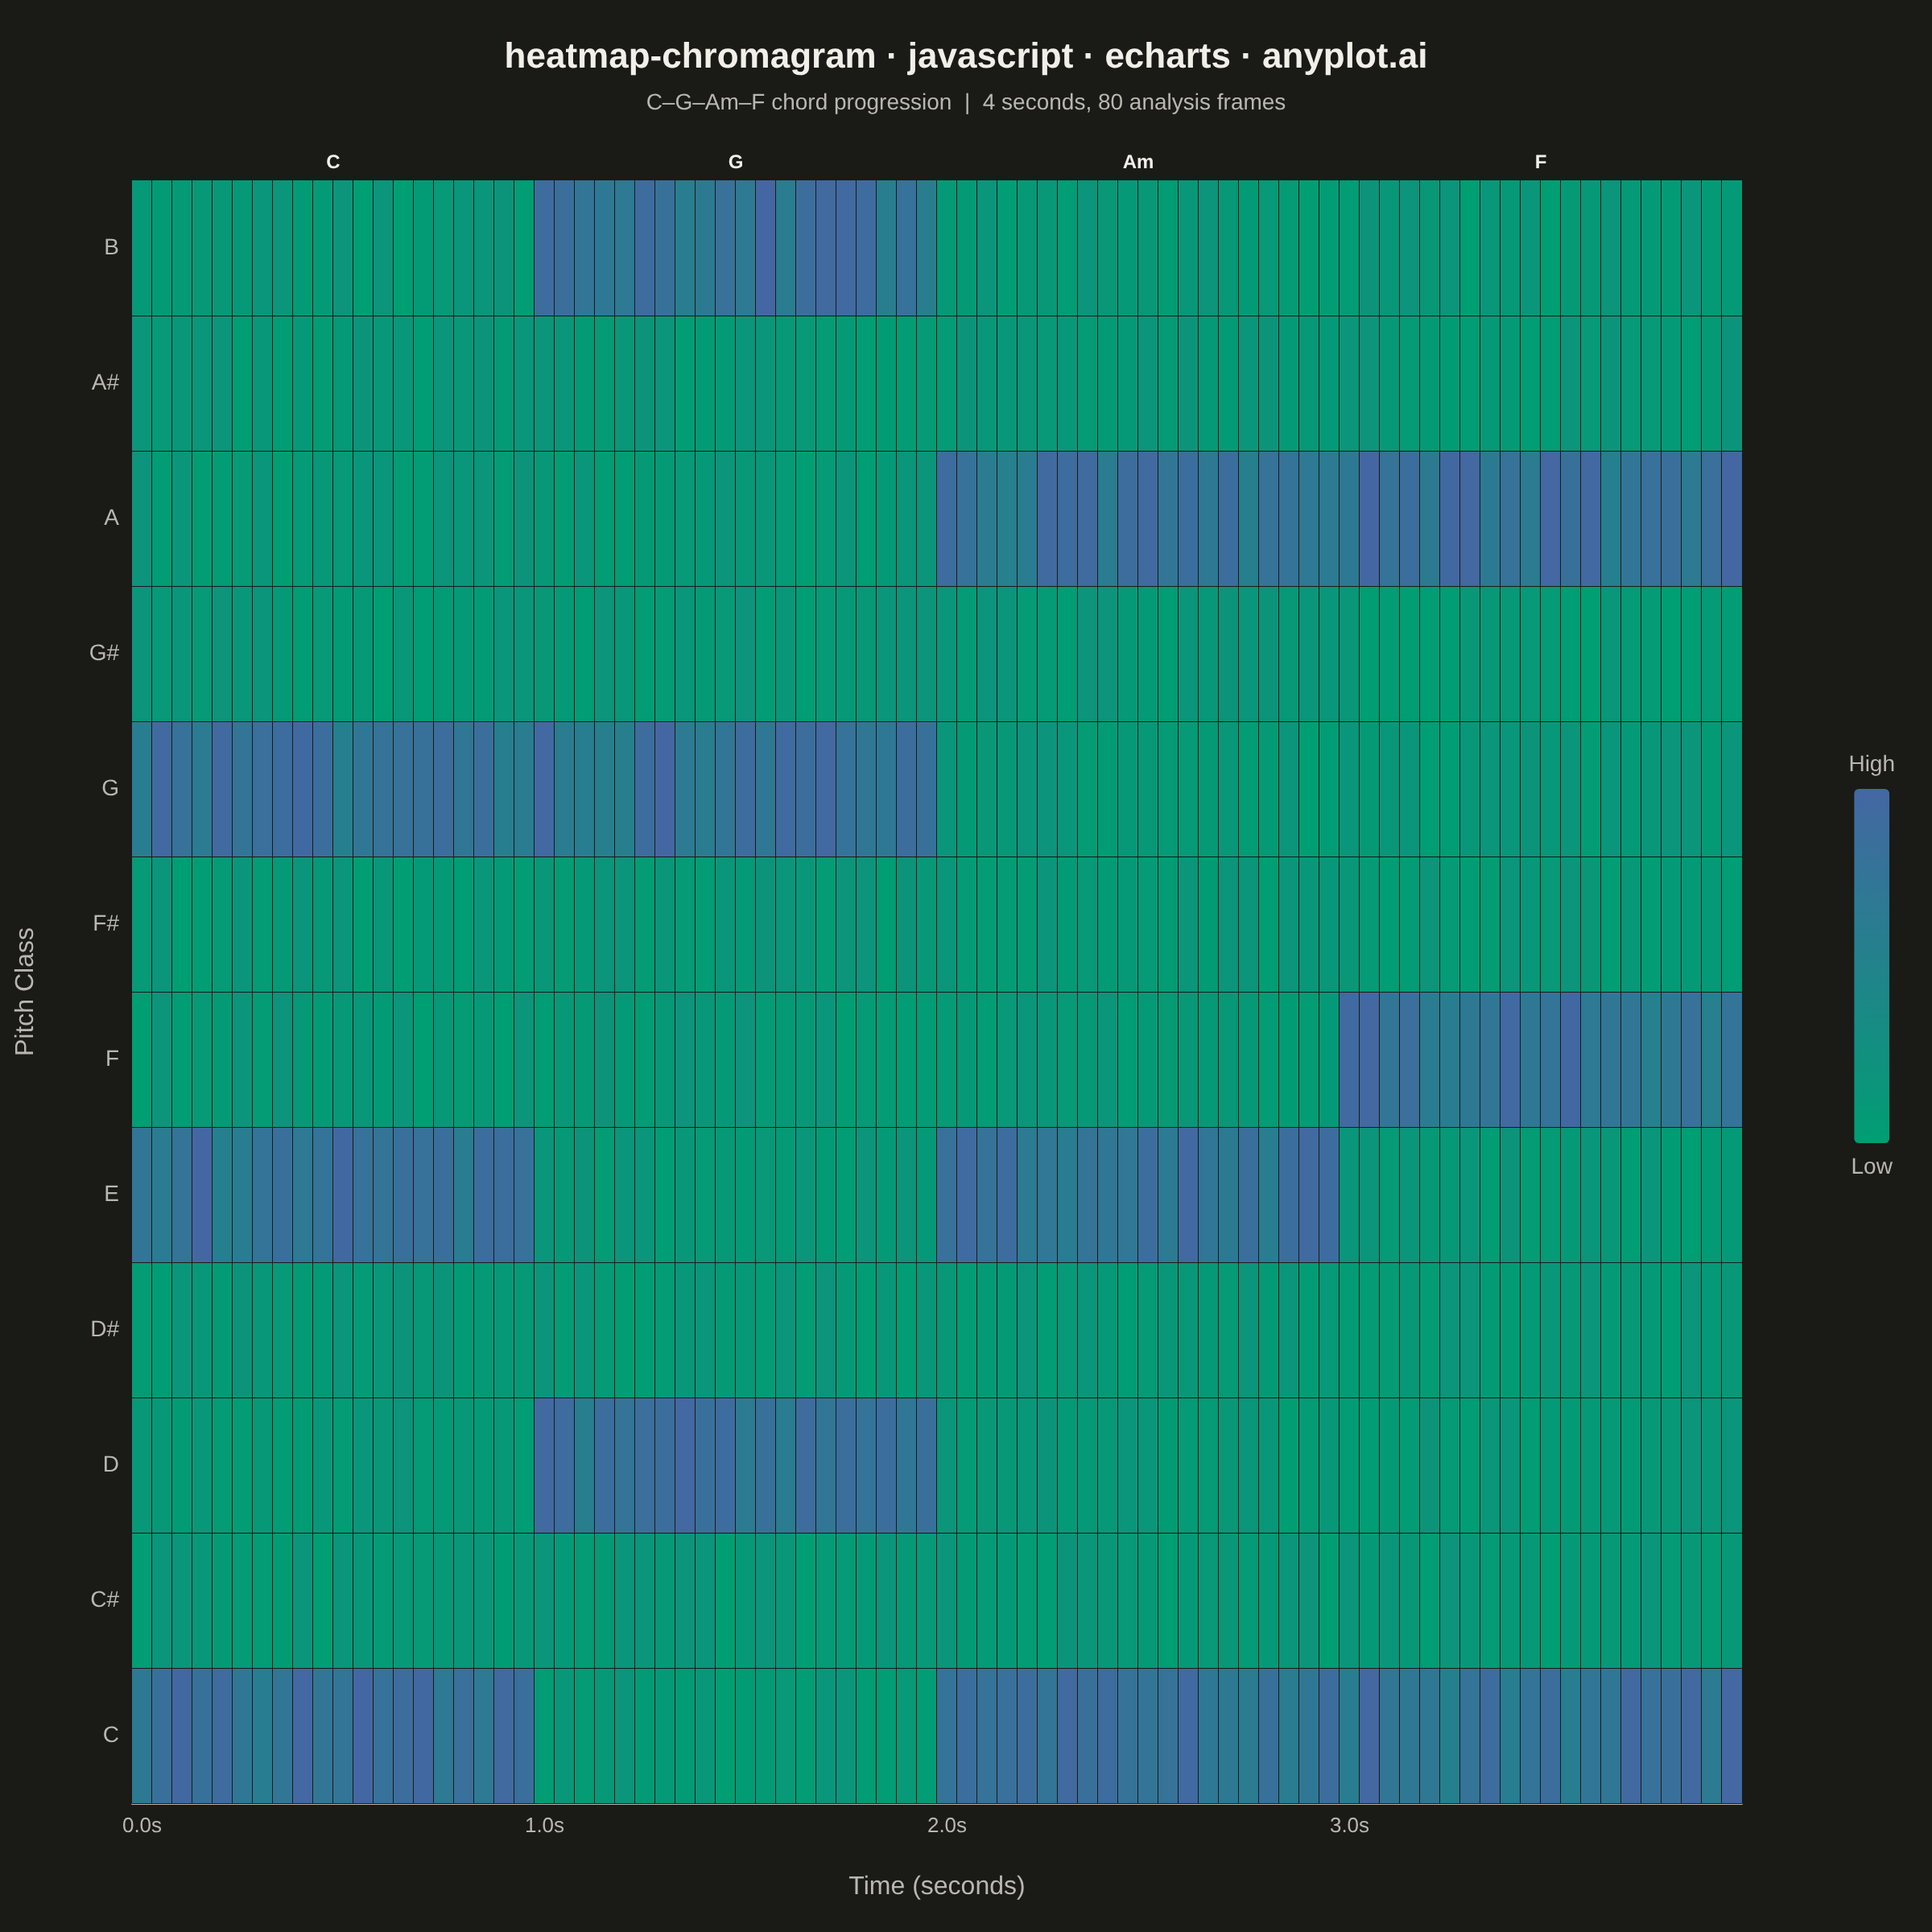
A heatmap-style visualization showing the energy distribution across the 12 pitch classes (C, C#, D, D#, E, F, F#, G, G#, A, A#, B) over time. Each column represents a time frame and each row a pitch class, with color intensity indicating the energy or magnitude at that pitch-time point. Widely used in music information retrieval to analyze harmonic content, detect chords, estimate musical key, and study tonal progressions in audio signals.
// anyplot.ai
// heatmap-chromagram: Music Chromagram (Pitch Class Distribution over Time)
// Library: echarts 5.5.1 | JavaScript 22.22.3
// Quality: 89/100 | Created: 2026-06-24
//# anyplot-orientation: square

const t = window.ANYPLOT_TOKENS;

// Pitch classes ordered C to B
const pitchClasses = ["C", "C#", "D", "D#", "E", "F", "F#", "G", "G#", "A", "A#", "B"];
const numFrames = 80;
const framesPerChord = 20;

// C–G–Am–F progression (indices into pitchClasses)
// C major: C(0), E(4), G(7)
// G major: D(2), G(7), B(11)
// A minor: C(0), E(4), A(9)
// F major: C(0), F(5), A(9)
const progression = [
  [0, 4, 7],
  [2, 7, 11],
  [0, 4, 9],
  [0, 5, 9],
];

// Deterministic LCG for reproducible noise (seed 42)
let seed = 42;
const lcg = () => {
  seed = (seed * 1664525 + 1013904223) >>> 0;
  return seed / 4294967296;
};

// Build chromagram: [frameIdx, pitchClassIdx, energy]
const chromaData = [];
for (let f = 0; f < numFrames; f++) {
  const chordTones = progression[Math.floor(f / framesPerChord)];
  for (let p = 0; p < 12; p++) {
    const isChordTone = chordTones.includes(p);
    const energy = isChordTone ? 0.55 + lcg() * 0.45 : lcg() * 0.18;
    chromaData.push([f, p, parseFloat(energy.toFixed(3))]);
  }
}

// X-axis labels: show seconds only at chord boundaries (every 20 frames = 1 second)
const timeLabels = Array.from({ length: numFrames }, (_, i) =>
  i % 20 === 0 ? `${(i * 0.05).toFixed(1)}s` : ""
);

// Chord section annotations — graphic positions in 1200×1200 CSS-px space
// Grid: left 82, right 118 (from right edge), top 112, bottom 80
// Grid area: x [82, 1082], y [112, 1120], width 1000, height 1008
const gLeft = 82;
const gTop = 112;
const gBottom = 1120;
const sectionW = 1000 / 4; // 250px per chord section

const chordNames = ["C", "G", "Am", "F"];
const labelGraphics = chordNames.map((name, i) => ({
  type: "text",
  style: {
    text: name,
    fill: t.ink,
    fontSize: 12,
    fontWeight: "bold",
    textAlign: "center",
    textVerticalAlign: "bottom",
  },
  x: gLeft + sectionW * i + sectionW / 2,
  y: gTop - 5,
}));

// Vertical dashed lines at chord boundaries (between sections)
const boundaryGraphics = [1, 2, 3].map((i) => ({
  type: "line",
  shape: {
    x1: gLeft + sectionW * i,
    y1: gTop,
    x2: gLeft + sectionW * i,
    y2: gBottom,
  },
  style: { stroke: t.inkSoft, lineWidth: 1, lineDash: [4, 3], opacity: 0.55 },
}));

const chart = echarts.init(document.getElementById("container"));

chart.setOption({
  animation: false,
  backgroundColor: "transparent",

  title: {
    text: "heatmap-chromagram · javascript · echarts · anyplot.ai",
    subtext: "C–G–Am–F chord progression  |  4 seconds, 80 analysis frames",
    left: "center",
    top: 20,
    textStyle: { color: t.ink, fontSize: 22, fontWeight: "bold" },
    subtextStyle: { color: t.inkSoft, fontSize: 14 },
  },

  grid: { left: 82, right: 118, top: 112, bottom: 80 },

  xAxis: {
    type: "category",
    data: timeLabels,
    name: "Time (seconds)",
    nameLocation: "middle",
    nameGap: 44,
    nameTextStyle: { color: t.inkSoft, fontSize: 16 },
    axisLabel: { color: t.inkSoft, fontSize: 13, interval: 0 },
    axisLine: { lineStyle: { color: t.inkSoft } },
    axisTick: { show: false },
    splitLine: { show: false },
  },

  yAxis: {
    type: "category",
    data: pitchClasses,
    name: "Pitch Class",
    nameLocation: "middle",
    nameGap: 58,
    nameTextStyle: { color: t.inkSoft, fontSize: 16 },
    axisLabel: { color: t.inkSoft, fontSize: 14 },
    axisLine: { lineStyle: { color: t.inkSoft } },
    axisTick: { show: false },
    splitLine: { show: false },
  },

  visualMap: {
    min: 0,
    max: 1,
    calculable: false,
    orient: "vertical",
    right: 18,
    top: "center",
    itemWidth: 22,
    itemHeight: 220,
    inRange: { color: t.seq },
    text: ["High", "Low"],
    textGap: 8,
    textStyle: { color: t.inkSoft, fontSize: 14 },
    outOfRange: { color: t.pageBg },
  },

  graphic: [...labelGraphics, ...boundaryGraphics],

  series: [
    {
      type: "heatmap",
      data: chromaData,
      itemStyle: {
        borderWidth: 0.5,
        borderColor: t.pageBg,
      },
      emphasis: { disabled: true },
    },
  ],
});
Runnable source as JSON, for any HTTP client: https://api.anyplot.ai/specs/heatmap-chromagram/echarts/code. Any spec id and library id listed in llms-full.txt fit the same URL shape; every URL below is complete and callable.
{
  "spec_id": "heatmap-chromagram",
  "language": "javascript",
  "library": "echarts",
  "page": "https://anyplot.ai/heatmap-chromagram/javascript/echarts",
  "hub": "https://anyplot.ai/heatmap-chromagram",
  "code_json": "https://api.anyplot.ai/specs/heatmap-chromagram/echarts/code",
  "spec_json": "https://api.anyplot.ai/specs/heatmap-chromagram",
  "render_light_png": "https://storage.googleapis.com/anyplot-images/plots/heatmap-chromagram/javascript/echarts/plot-light.png",
  "render_dark_png": "https://storage.googleapis.com/anyplot-images/plots/heatmap-chromagram/javascript/echarts/plot-dark.png",
  "interactive_light_html": "https://storage.googleapis.com/anyplot-images/plots/heatmap-chromagram/javascript/echarts/plot-light.html",
  "interactive_dark_html": "https://storage.googleapis.com/anyplot-images/plots/heatmap-chromagram/javascript/echarts/plot-dark.html",
  "quality_score": 89.0,
  "license": "MIT",
  "guide": "https://anyplot.ai/llms.txt"
}
Part of Music Chromagram (Pitch Class Distribution over Time) on anyplot.ai.