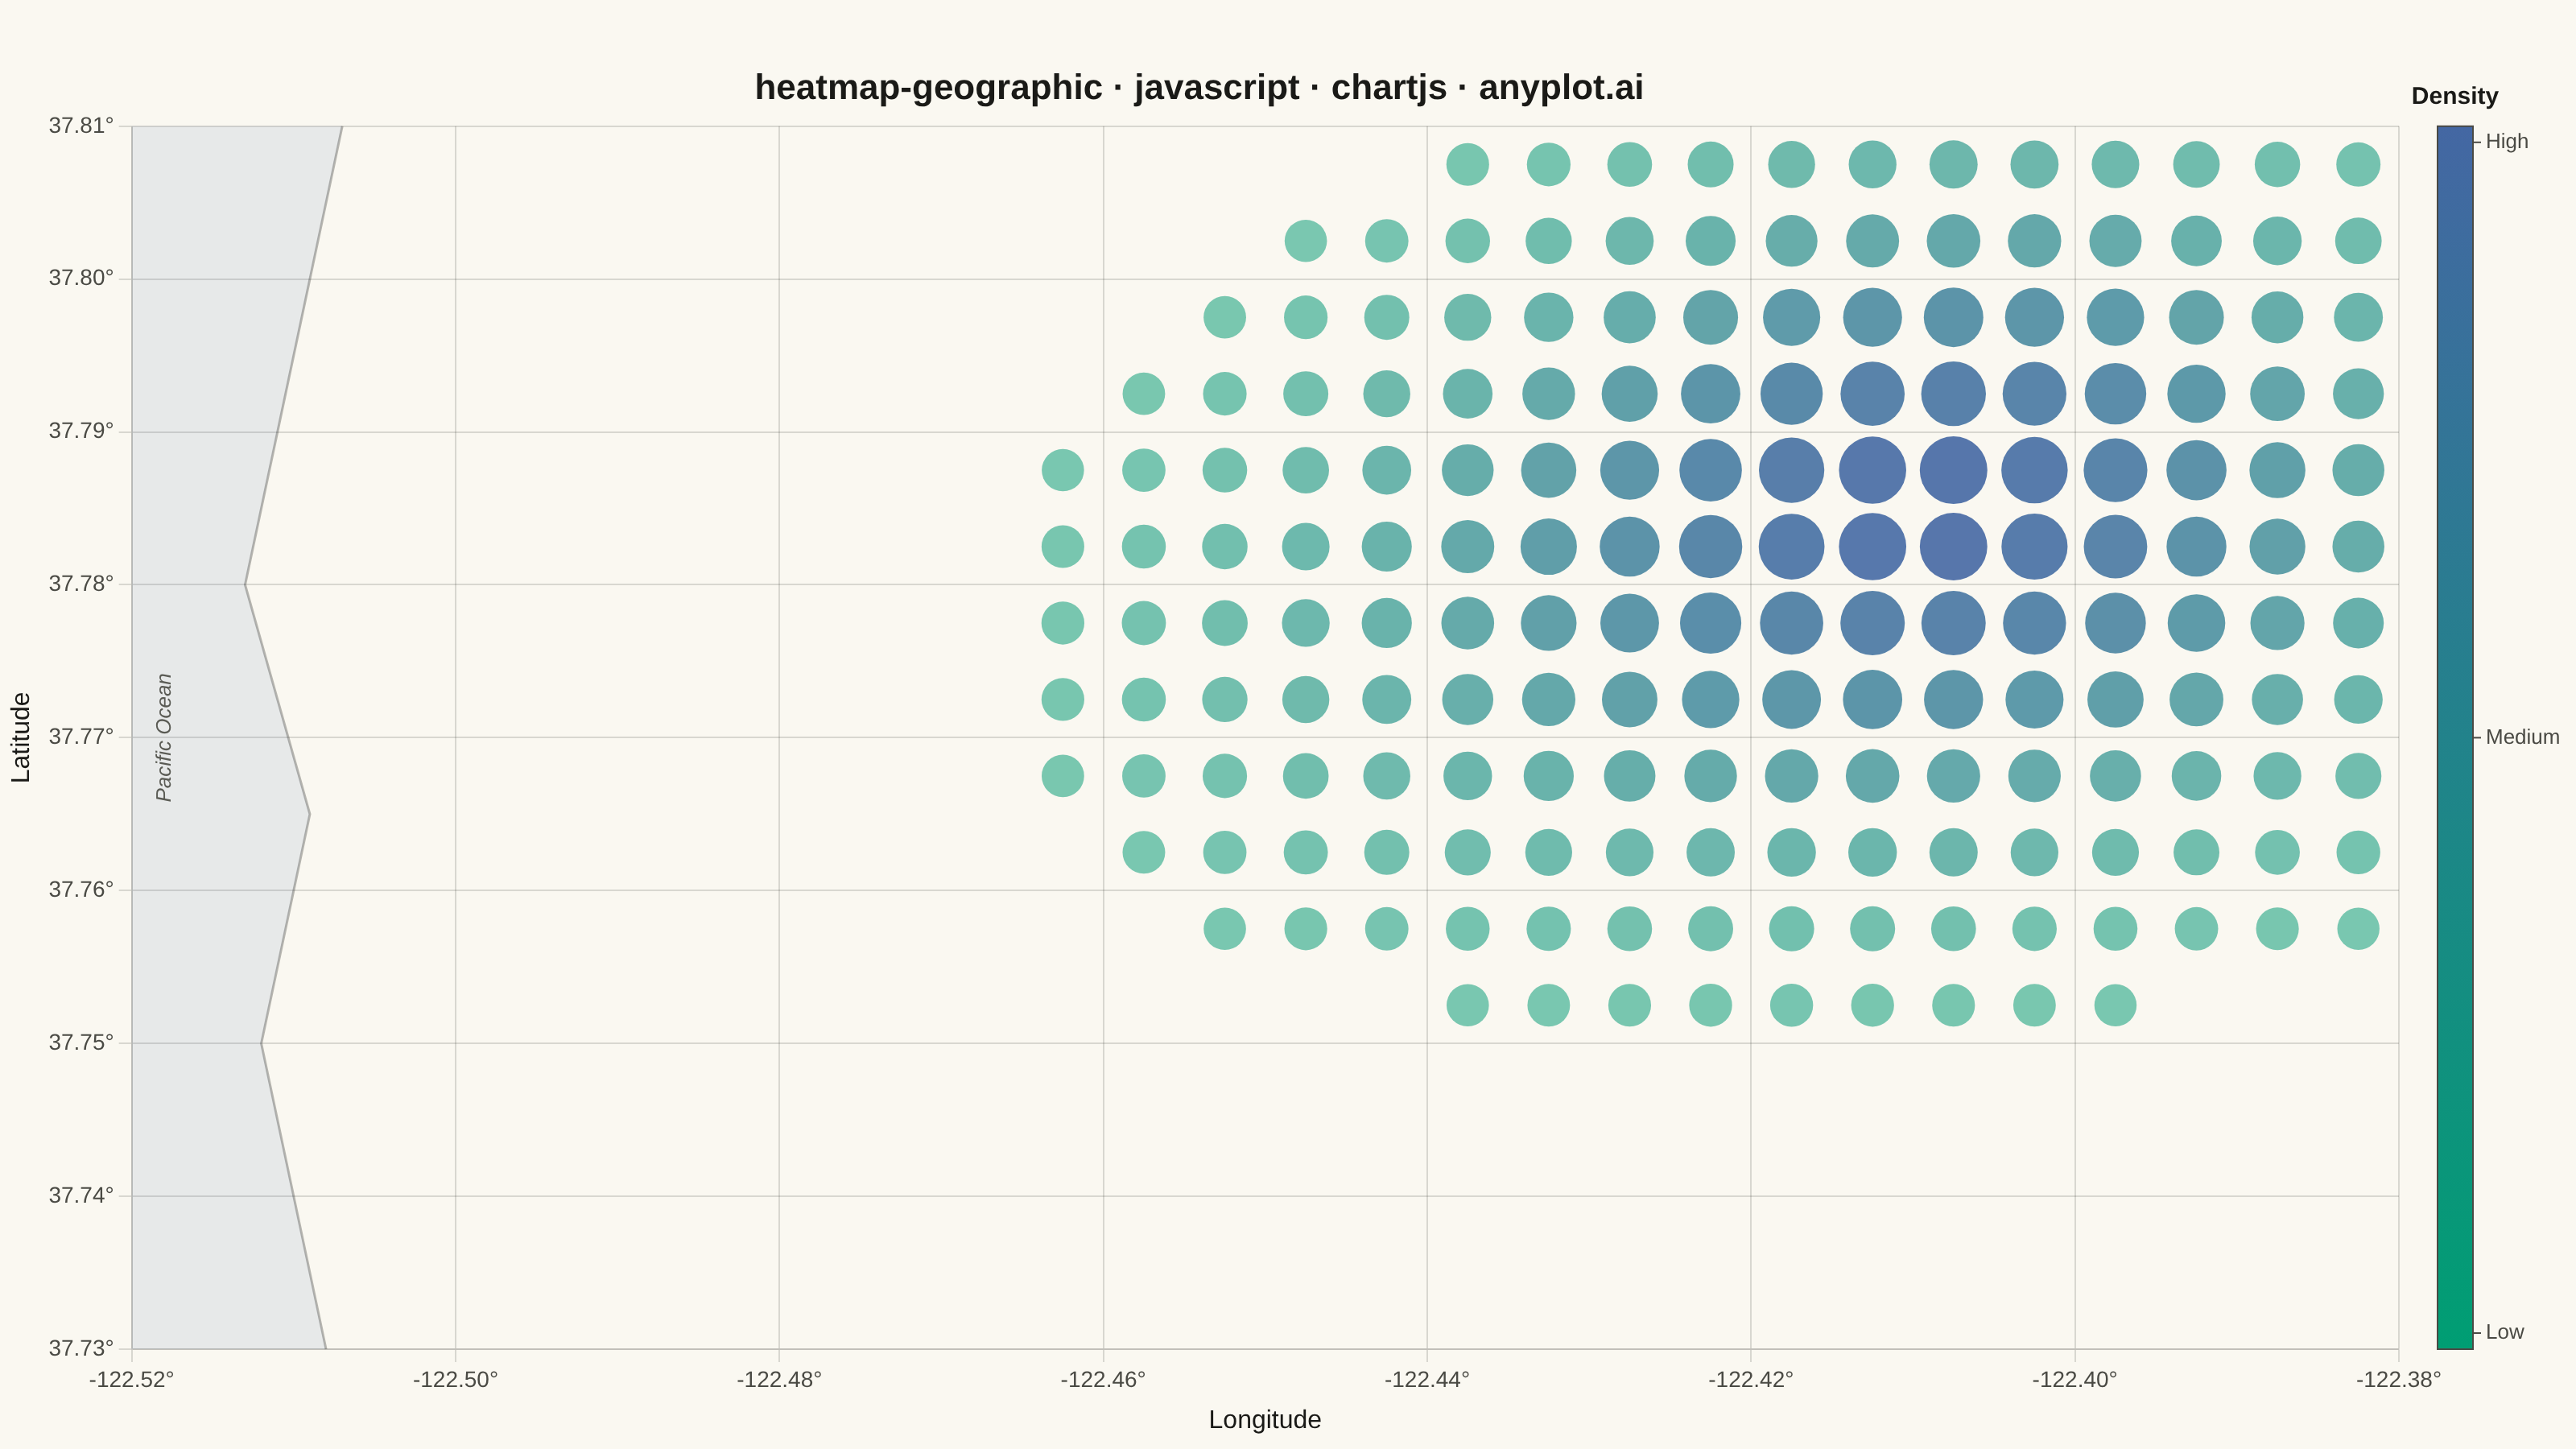
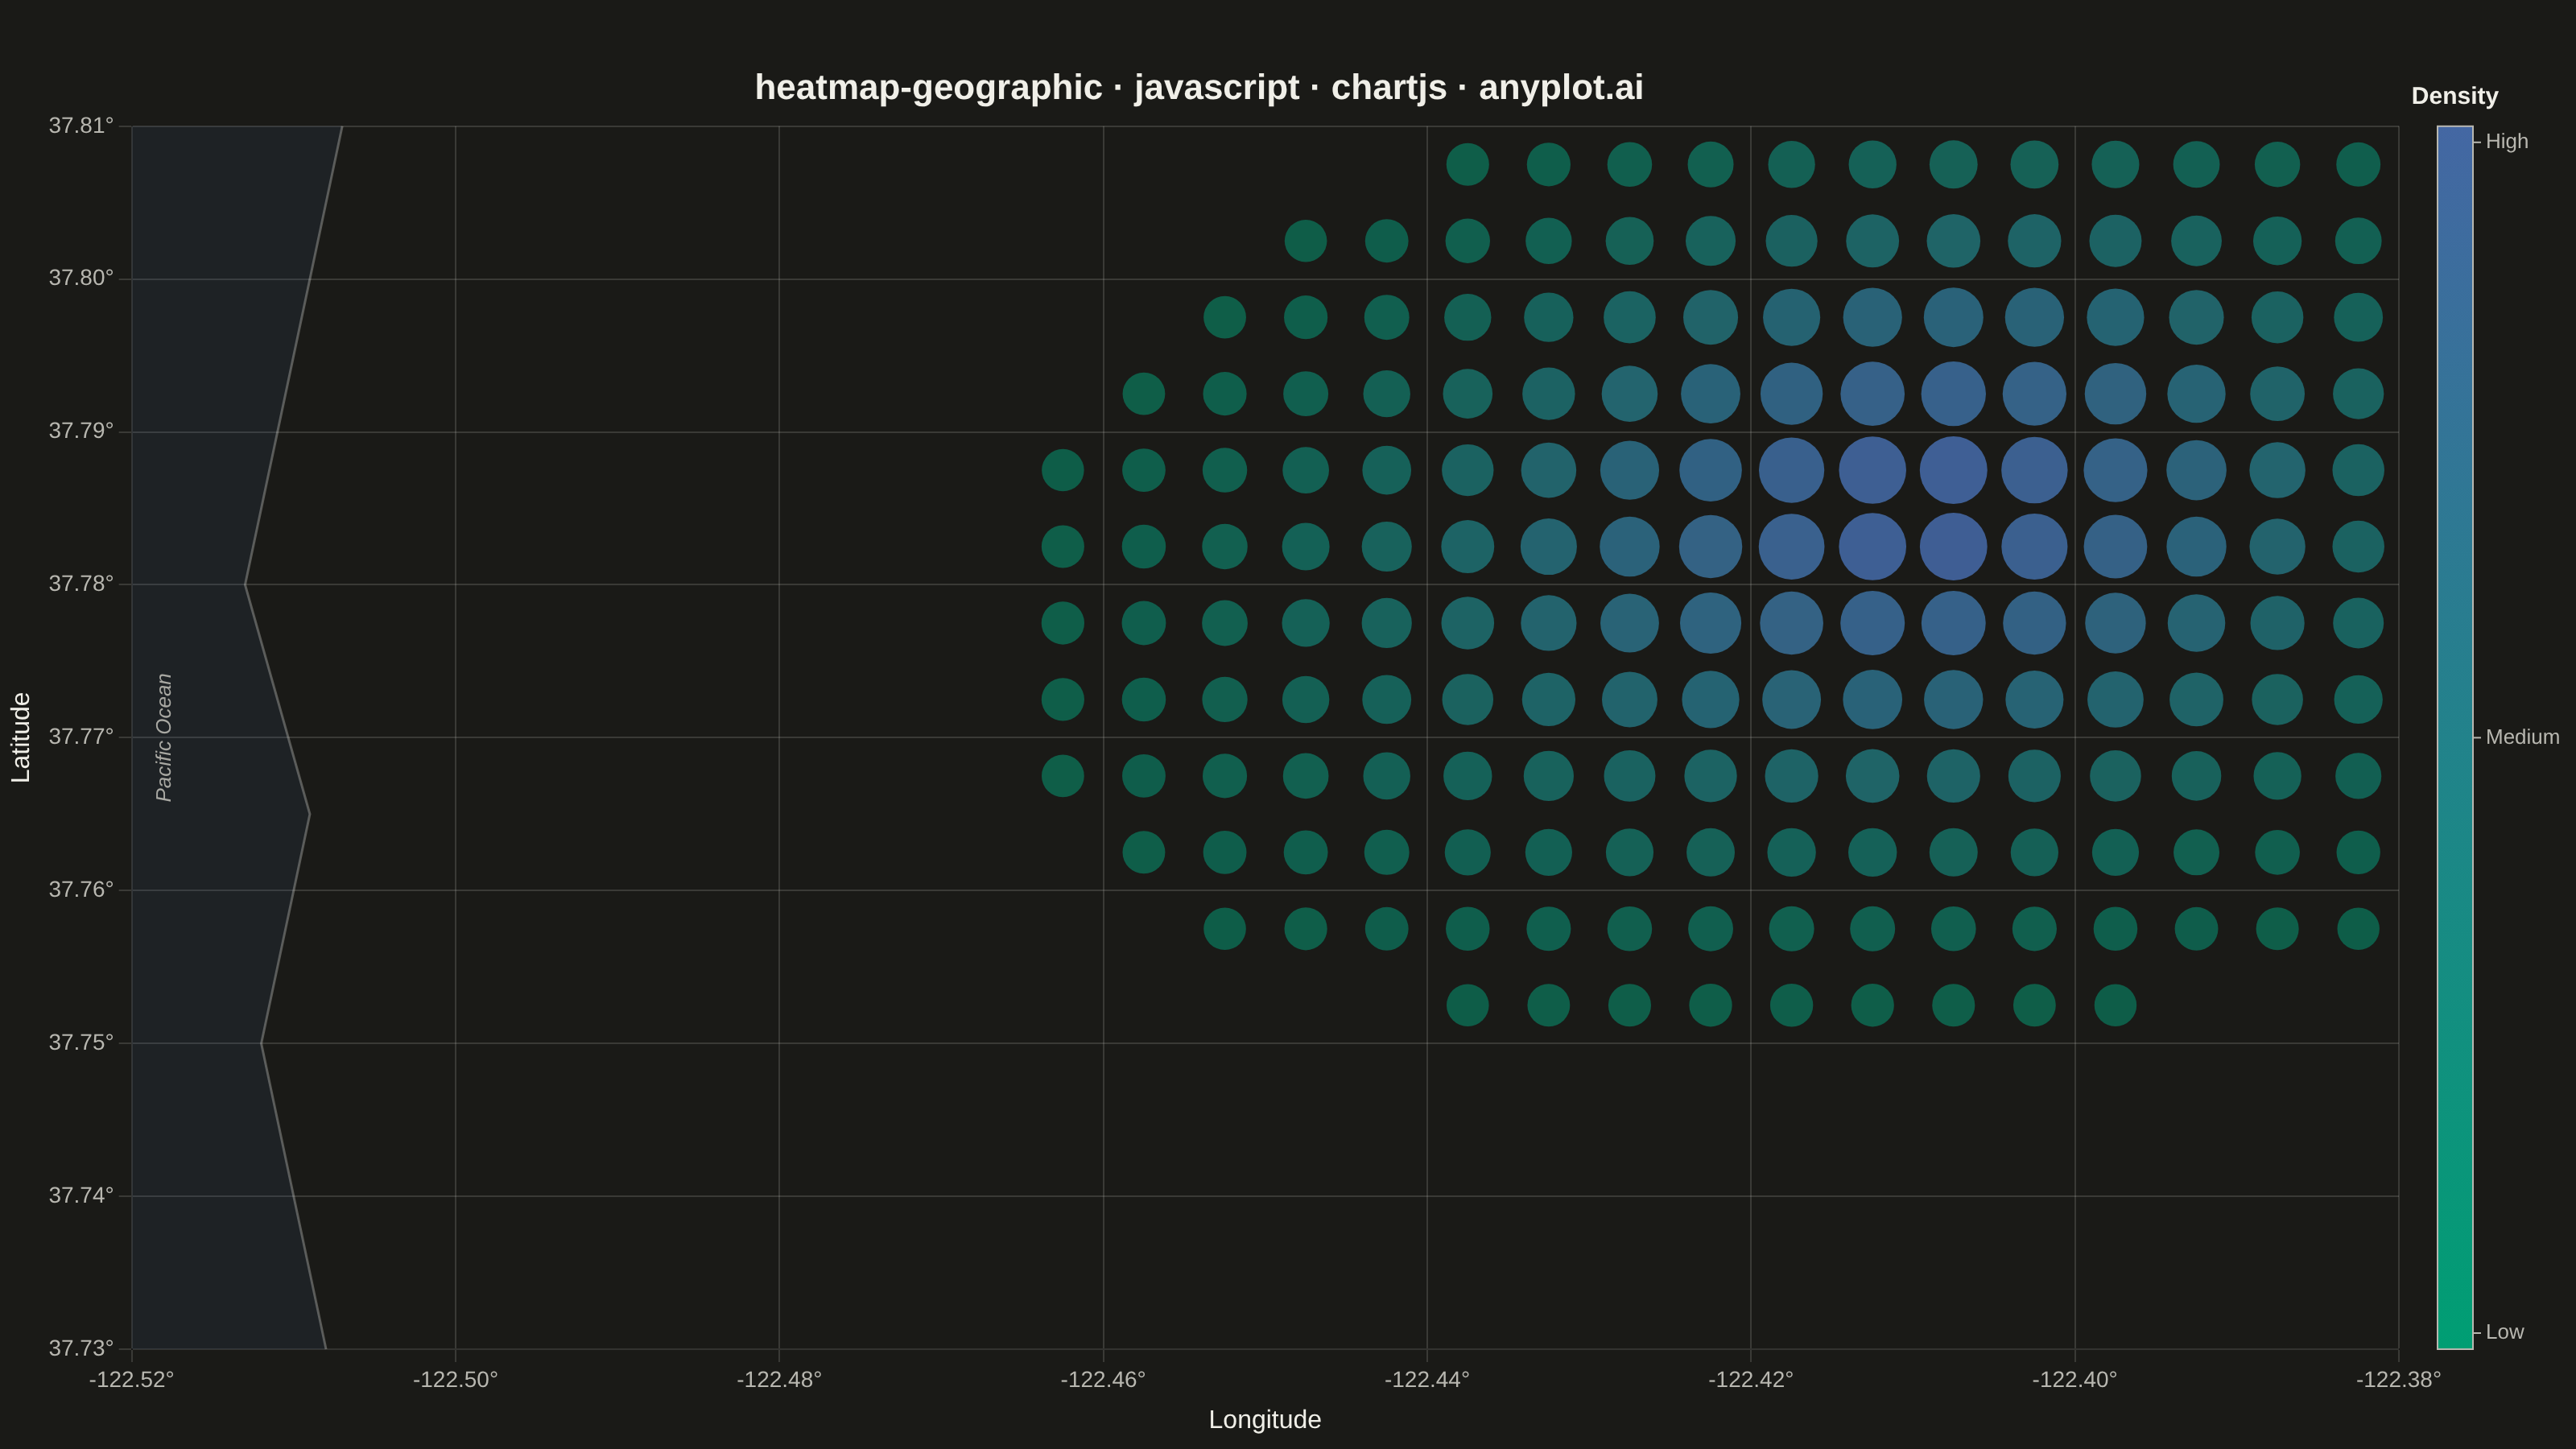
The same plot in 14 other libraries — JavaScript: D3.js, Apache ECharts, Highcharts, MUI X Charts; Python: Altair, Bokeh, lets-plot, Matplotlib, Plotly, plotnine, Pygal, Seaborn; R: ggplot2; Julia: Makie.jl. Compare all 15 side by side: Geographic Heatmap for Spatial Density in Python, R, Julia and JavaScript.
A geographic heatmap visualizes spatial density or intensity values across a map using continuous color gradients. Unlike choropleth maps that color discrete regions, this plot shows smooth density variations computed from point data or gridded values. The color intensity at each location represents the concentration or magnitude of the underlying data, making it ideal for identifying hotspots, clusters, and spatial patterns in geographic data.
// anyplot.ai
// heatmap-geographic: Geographic Heatmap for Spatial Density
// Library: chartjs 4.4.7 | JavaScript 22.23.2
// Quality: 91/100 | Created: 2026-09-02

//# anyplot-orientation: landscape
const t = window.ANYPLOT_TOKENS;

// --- Deterministic PRNG (32-bit LCG, Math.imul avoids float precision loss) -
let seed = 42;
function rand() {
  seed = (Math.imul(seed, 1103515245) + 12345) & 0x7fffffff;
  return seed / 0x7fffffff;
}
function gaussian() {
  const u1 = Math.max(rand(), 1e-9);
  const u2 = rand();
  return Math.sqrt(-2 * Math.log(u1)) * Math.cos(2 * Math.PI * u2);
}

// --- Data: simulated incident reports across a downtown bounding box -------
const LON_MIN = -122.52;
const LON_MAX = -122.38;
const LAT_MIN = 37.73;
const LAT_MAX = 37.81;

const hotspots = [
  { lon: -122.412, lat: 37.784, weight: 0.42, spreadLon: 0.012, spreadLat: 0.01 }, // downtown core
  { lon: -122.404, lat: 37.792, weight: 0.24, spreadLon: 0.01, spreadLat: 0.008 }, // financial district
  { lon: -122.431, lat: 37.775, weight: 0.2, spreadLon: 0.014, spreadLat: 0.011 }, // tenderloin
  { lon: -122.393, lat: 37.778, weight: 0.14, spreadLon: 0.013, spreadLat: 0.01 }, // transit hub
];

const incidents = [];
for (let i = 0; i < 900; i++) {
  const r = rand();
  let acc = 0;
  let cluster = hotspots[hotspots.length - 1];
  for (const h of hotspots) {
    acc += h.weight;
    if (r <= acc) {
      cluster = h;
      break;
    }
  }
  const lon = cluster.lon + gaussian() * cluster.spreadLon;
  const lat = cluster.lat + gaussian() * cluster.spreadLat;
  if (lon < LON_MIN || lon > LON_MAX || lat < LAT_MIN || lat > LAT_MAX) continue;
  incidents.push({ lon, lat, severity: 0.6 + rand() * 0.4 });
}

// --- Kernel density estimation on a regular grid ----------------------------
const COLS = 28;
const ROWS = 16;
const bwLon = (LON_MAX - LON_MIN) / 9;
const bwLat = (LAT_MAX - LAT_MIN) / 9;

const cells = [];
let maxDensity = 0;
for (let cy = 0; cy < ROWS; cy++) {
  for (let cx = 0; cx < COLS; cx++) {
    const lon = LON_MIN + (cx + 0.5) * ((LON_MAX - LON_MIN) / COLS);
    const lat = LAT_MIN + (cy + 0.5) * ((LAT_MAX - LAT_MIN) / ROWS);
    let density = 0;
    for (const p of incidents) {
      const dx = (p.lon - lon) / bwLon;
      const dy = (p.lat - lat) / bwLat;
      density += p.severity * Math.exp(-0.5 * (dx * dx + dy * dy));
    }
    if (density > maxDensity) maxDensity = density;
    cells.push({ lon, lat, density });
  }
}

// Hide near-zero cells so the page background reads through, like a basemap.
const DENSITY_FLOOR = 0.06;
const points = cells
  .map((c) => ({ x: c.lon, y: c.lat, d: c.density / maxDensity }))
  .filter((c) => c.d > DENSITY_FLOOR);

// --- Imprint sequential colormap (brand green -> blue) ----------------------
function hexToRgba(hex, alpha) {
  const r = parseInt(hex.slice(1, 3), 16);
  const g = parseInt(hex.slice(3, 5), 16);
  const b = parseInt(hex.slice(5, 7), 16);
  return `rgba(${r}, ${g}, ${b}, ${alpha})`;
}
function lerpRGB(hexA, hexB, f) {
  const a = [1, 3, 5].map((i) => parseInt(hexA.slice(i, i + 2), 16));
  const b = [1, 3, 5].map((i) => parseInt(hexB.slice(i, i + 2), 16));
  return a.map((v, i) => Math.round(v + (b[i] - v) * f));
}
function densityColor(f, alpha) {
  const [r, g, b] = lerpRGB(t.seq[0], t.seq[1], f);
  return `rgba(${r}, ${g}, ${b}, ${alpha})`;
}

// Radius approximates half the grid spacing so hotspot cells read as a
// continuous mosaic while sparse cells stay small and let the page bg show.
// The alpha floor (0.55) keeps low-density edge cells visible against a
// near-black dark-theme background instead of fading out entirely.
const CELL_RADIUS = 21;
const bubbleData = points.map((p) => ({
  x: p.x,
  y: p.y,
  r: CELL_RADIUS * (0.6 + 0.4 * p.d),
  d: p.d,
}));

// --- Simplified Pacific coastline for basemap context (rough, schematic) ---
// Ocean Beach runs roughly along -122.51 deg; sketched as a gentle
// north-south curve at the low-longitude edge of the bounding box, well
// west of every hotspot so it never competes with the density bubbles.
const COASTLINE = [
  { lon: -122.508, lat: LAT_MIN },
  { lon: -122.512, lat: 37.75 },
  { lon: -122.509, lat: 37.765 },
  { lon: -122.513, lat: 37.78 },
  { lon: -122.51, lat: 37.795 },
  { lon: -122.507, lat: LAT_MAX },
];

const basemapPlugin = {
  id: "basemap",
  beforeDatasetsDraw(chart) {
    const {
      ctx,
      scales: { x, y },
      chartArea: ca,
    } = chart;
    const coastPx = COASTLINE.map((p) => [x.getPixelForValue(p.lon), y.getPixelForValue(p.lat)]);

    ctx.save();
    ctx.beginPath();
    coastPx.forEach(([px, py], i) => (i === 0 ? ctx.moveTo(px, py) : ctx.lineTo(px, py)));
    ctx.lineTo(ca.left, ca.top);
    ctx.lineTo(ca.left, ca.bottom);
    ctx.closePath();
    ctx.fillStyle = hexToRgba(t.seq[1], 0.1);
    ctx.fill();

    ctx.beginPath();
    coastPx.forEach(([px, py], i) => (i === 0 ? ctx.moveTo(px, py) : ctx.lineTo(px, py)));
    ctx.strokeStyle = hexToRgba(t.ink, 0.3);
    ctx.lineWidth = 1.5;
    ctx.stroke();

    ctx.save();
    ctx.translate(ca.left + 24, (ca.top + ca.bottom) / 2);
    ctx.rotate(-Math.PI / 2);
    ctx.font = "italic 13px sans-serif";
    ctx.fillStyle = hexToRgba(t.inkSoft, 0.9);
    ctx.textAlign = "center";
    ctx.fillText("Pacific Ocean", 0, 0);
    ctx.restore();
    ctx.restore();
  },
};

// --- Density colorbar (replaces a discrete-band legend with a true scale) --
const colorbarPlugin = {
  id: "colorbar",
  afterDraw(chart) {
    const { ctx, chartArea: ca } = chart;
    const barX = ca.right + 24;
    const barW = 22;
    const barH = ca.bottom - ca.top;

    ctx.save();
    const grad = ctx.createLinearGradient(0, ca.bottom, 0, ca.top);
    grad.addColorStop(0, t.seq[0]);
    grad.addColorStop(1, t.seq[1]);
    ctx.fillStyle = grad;
    ctx.fillRect(barX, ca.top, barW, barH);
    ctx.strokeStyle = t.inkSoft;
    ctx.lineWidth = 1;
    ctx.strokeRect(barX, ca.top, barW, barH);

    ctx.fillStyle = t.ink;
    ctx.font = "bold 15px sans-serif";
    ctx.textAlign = "center";
    ctx.fillText("Density", barX + barW / 2, ca.top - 14);

    const TICK_INSET = 10;
    const ticks = [
      { f: 1, label: "High" },
      { f: 0.5, label: "Medium" },
      { f: 0, label: "Low" },
    ];
    ctx.font = "13px sans-serif";
    ctx.fillStyle = t.inkSoft;
    ctx.strokeStyle = t.inkSoft;
    ctx.textAlign = "left";
    ctx.textBaseline = "middle";
    for (const { f, label } of ticks) {
      const ty = ca.bottom - TICK_INSET - f * (barH - 2 * TICK_INSET);
      ctx.beginPath();
      ctx.moveTo(barX + barW, ty);
      ctx.lineTo(barX + barW + 5, ty);
      ctx.stroke();
      ctx.fillText(label, barX + barW + 8, ty);
    }
    ctx.restore();
  },
};

// --- Mount -------------------------------------------------------------------
const canvas = document.createElement("canvas");
document.getElementById("container").appendChild(canvas);

// --- Chart -------------------------------------------------------------------
const chart = new Chart(canvas, {
  type: "bubble",
  data: {
    datasets: [
      {
        label: "Incident density",
        data: bubbleData,
        backgroundColor: bubbleData.map((p) => densityColor(p.d, 0.5 + 0.4 * p.d)),
        borderWidth: 0,
      },
    ],
  },
  plugins: [basemapPlugin, colorbarPlugin],
  options: {
    responsive: true,
    maintainAspectRatio: false,
    animation: false,
    layout: { padding: { right: 110, top: 32, bottom: 4 } },
    plugins: {
      title: {
        display: true,
        text: "heatmap-geographic · javascript · chartjs · anyplot.ai",
        color: t.ink,
        font: { size: 22 },
      },
      legend: { display: false },
    },
    scales: {
      x: {
        min: LON_MIN,
        max: LON_MAX,
        ticks: { color: t.inkSoft, font: { size: 14 }, callback: (v) => `${Number(v).toFixed(2)}°` },
        grid: { color: t.grid },
        title: { display: true, text: "Longitude", color: t.ink, font: { size: 16 } },
      },
      y: {
        min: LAT_MIN,
        max: LAT_MAX,
        ticks: { color: t.inkSoft, font: { size: 14 }, callback: (v) => `${Number(v).toFixed(2)}°` },
        grid: { color: t.grid },
        title: { display: true, text: "Latitude", color: t.ink, font: { size: 16 } },
      },
    },
  },
});

// --- Zoom & pan (native wheel/drag, no external plugin) ---------------------
// The spec asks interactive libraries to let users explore density at
// different scales; chartjs-plugin-zoom isn't installed in this runtime, so
// wheel-to-zoom and drag-to-pan are wired directly onto the linear scales.
canvas.style.cursor = "grab";
let isPanning = false;
let lastX = 0;
let lastY = 0;
canvas.addEventListener("mousedown", (evt) => {
  isPanning = true;
  lastX = evt.offsetX;
  lastY = evt.offsetY;
  canvas.style.cursor = "grabbing";
});
canvas.addEventListener("mousemove", (evt) => {
  if (!isPanning) return;
  const { x: xScale, y: yScale } = chart.scales;
  const dLon = xScale.getValueForPixel(lastX) - xScale.getValueForPixel(evt.offsetX);
  const dLat = yScale.getValueForPixel(lastY) - yScale.getValueForPixel(evt.offsetY);
  xScale.options.min += dLon;
  xScale.options.max += dLon;
  yScale.options.min += dLat;
  yScale.options.max += dLat;
  lastX = evt.offsetX;
  lastY = evt.offsetY;
  chart.update("none");
});
["mouseup", "mouseleave"].forEach((evtName) =>
  canvas.addEventListener(evtName, () => {
    isPanning = false;
    canvas.style.cursor = "grab";
  }),
);
canvas.addEventListener(
  "wheel",
  (evt) => {
    evt.preventDefault();
    const { x: xScale, y: yScale } = chart.scales;
    const zoomFactor = evt.deltaY < 0 ? 0.9 : 1.1;
    const cursorLon = xScale.getValueForPixel(evt.offsetX);
    const cursorLat = yScale.getValueForPixel(evt.offsetY);
    xScale.options.min = cursorLon + (xScale.min - cursorLon) * zoomFactor;
    xScale.options.max = cursorLon + (xScale.max - cursorLon) * zoomFactor;
    yScale.options.min = cursorLat + (yScale.min - cursorLat) * zoomFactor;
    yScale.options.max = cursorLat + (yScale.max - cursorLat) * zoomFactor;
    chart.update("none");
  },
  { passive: false },
);
Runnable source as JSON, for any HTTP client: https://api.anyplot.ai/specs/heatmap-geographic/chartjs/code. Any spec id and library id listed in llms-full.txt fit the same URL shape; every URL below is complete and callable.
{
  "spec_id": "heatmap-geographic",
  "language": "javascript",
  "library": "chartjs",
  "page": "https://anyplot.ai/heatmap-geographic/javascript/chartjs",
  "hub": "https://anyplot.ai/heatmap-geographic",
  "code_json": "https://api.anyplot.ai/specs/heatmap-geographic/chartjs/code",
  "spec_json": "https://api.anyplot.ai/specs/heatmap-geographic",
  "render_light_png": "https://storage.googleapis.com/anyplot-images/plots/heatmap-geographic/javascript/chartjs/plot-light.png",
  "render_dark_png": "https://storage.googleapis.com/anyplot-images/plots/heatmap-geographic/javascript/chartjs/plot-dark.png",
  "interactive_light_html": "https://storage.googleapis.com/anyplot-images/plots/heatmap-geographic/javascript/chartjs/plot-light.html",
  "interactive_dark_html": "https://storage.googleapis.com/anyplot-images/plots/heatmap-geographic/javascript/chartjs/plot-dark.html",
  "quality_score": 91.0,
  "license": "MIT",
  "guide": "https://anyplot.ai/llms.txt"
}
Part of Geographic Heatmap for Spatial Density on anyplot.ai.