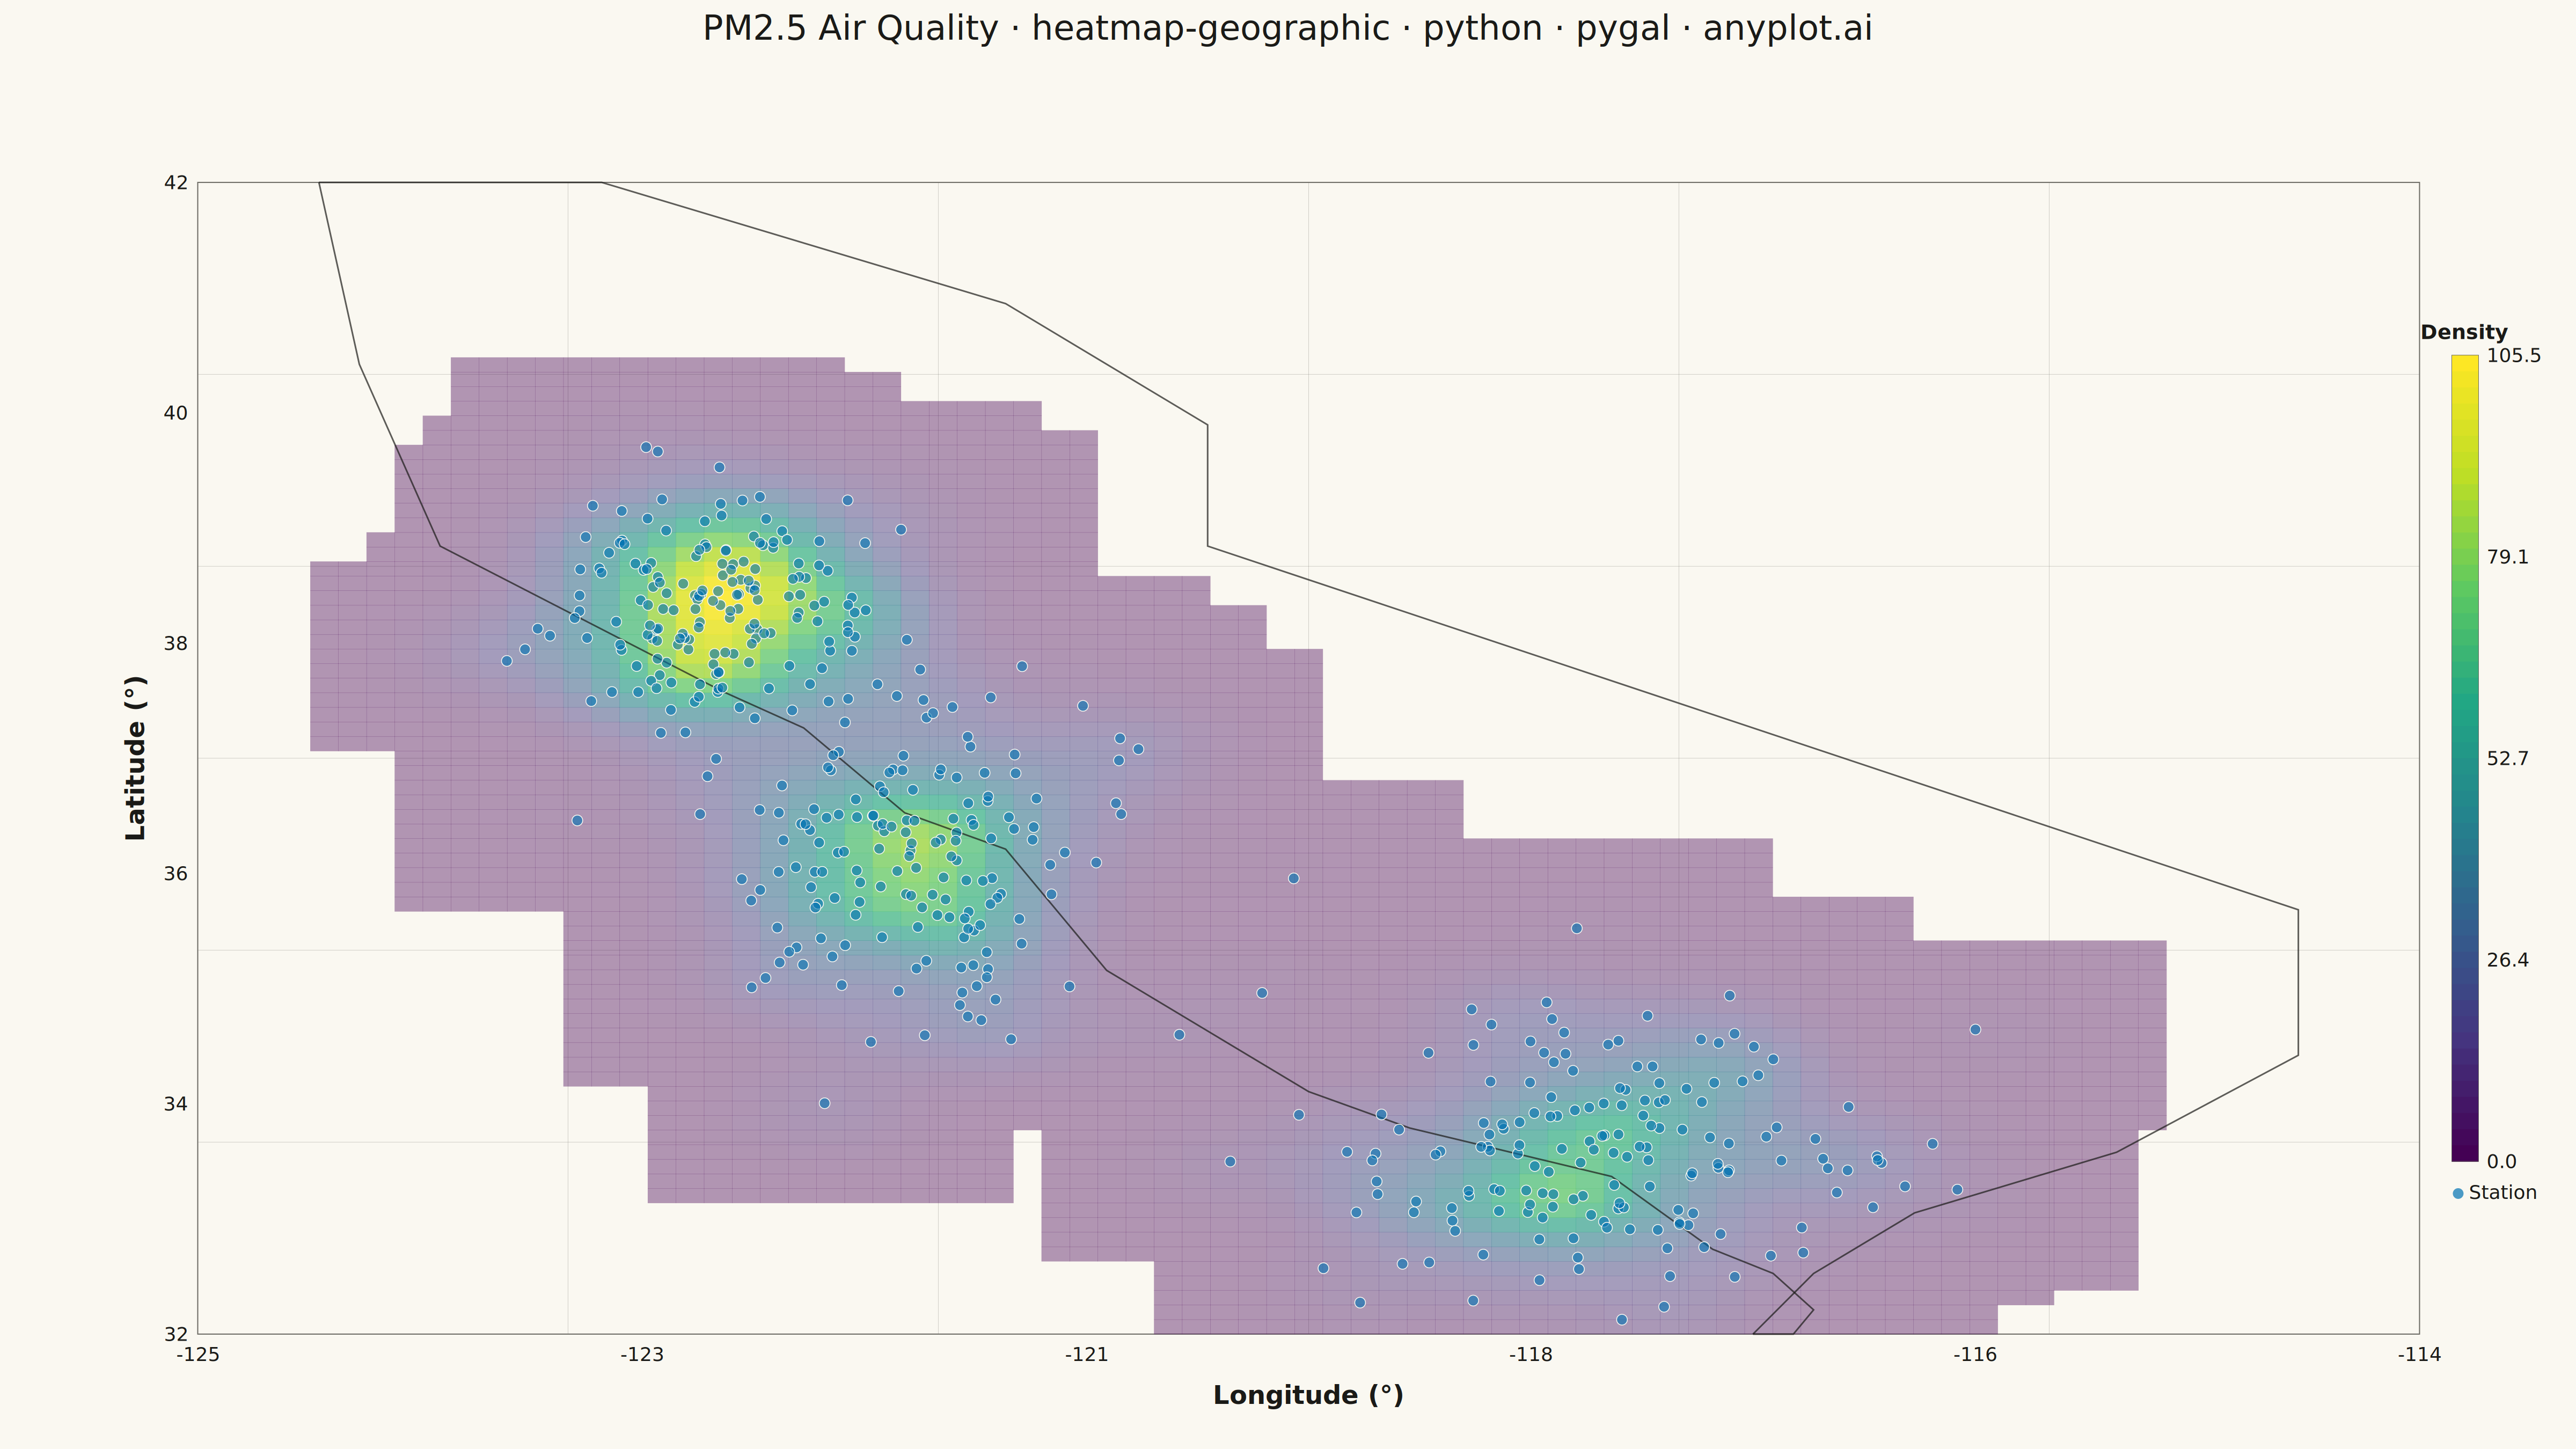
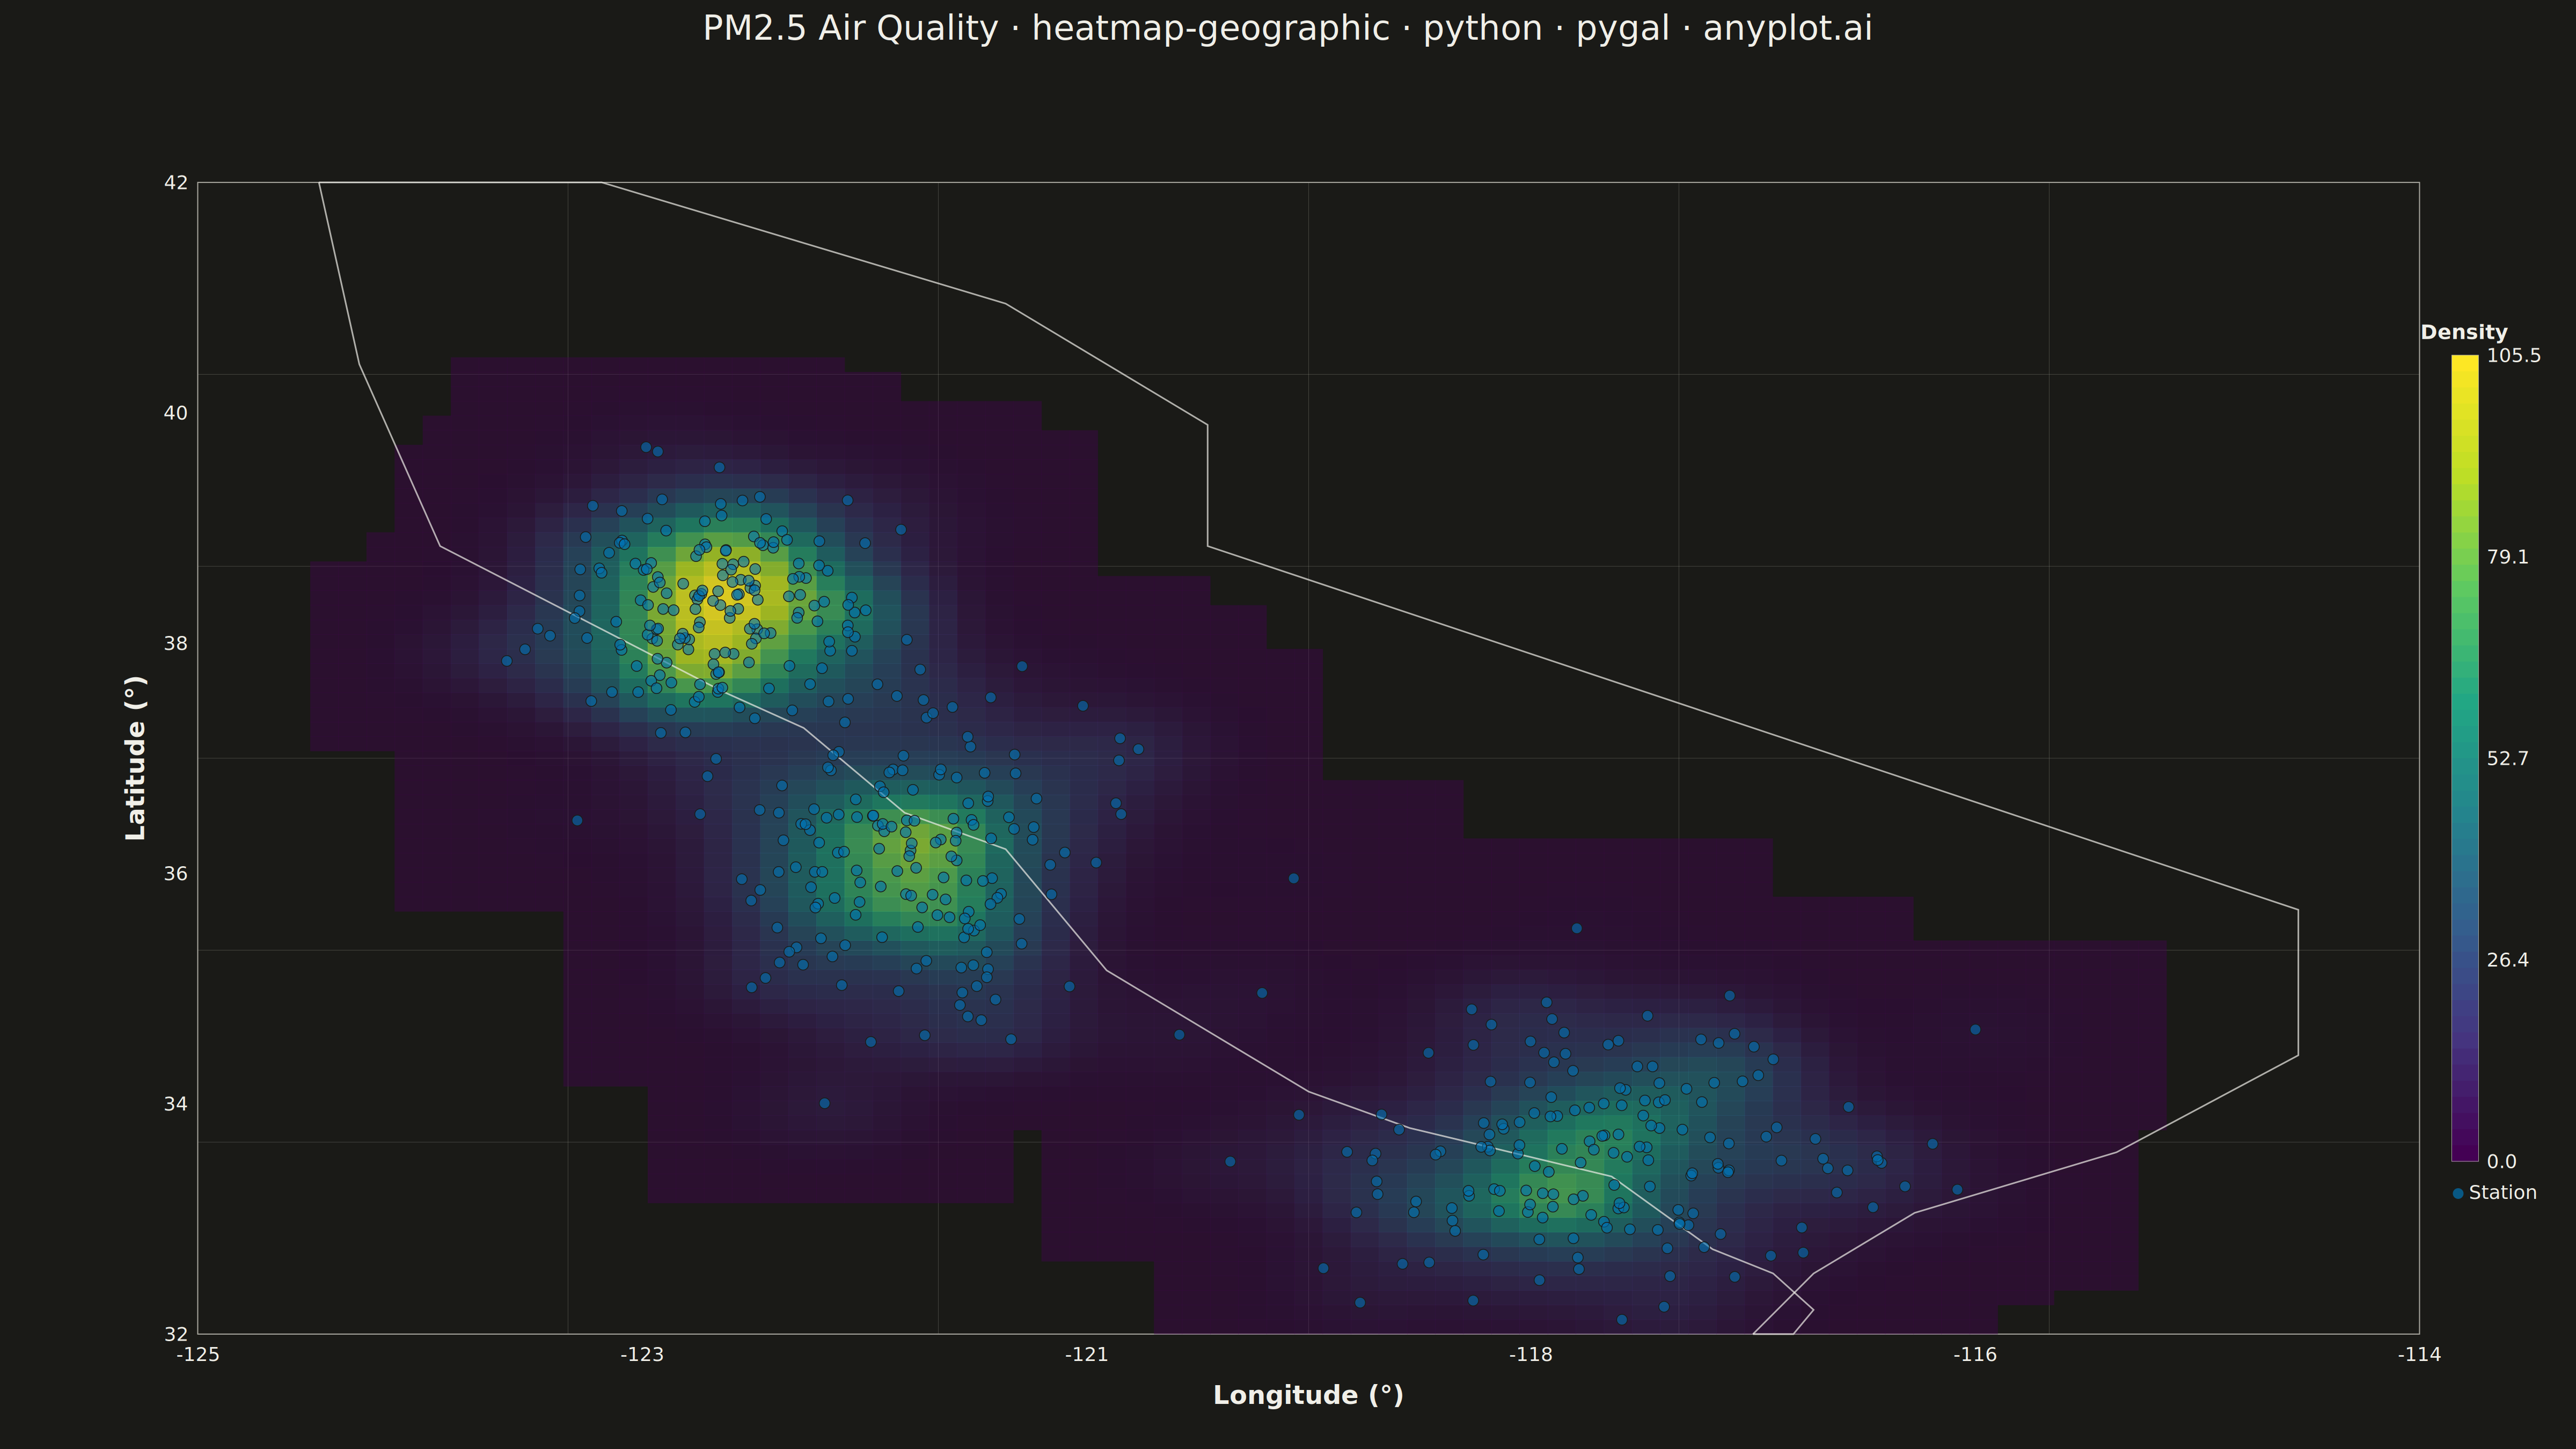
A geographic heatmap visualizes spatial density or intensity values across a map using continuous color gradients. Unlike choropleth maps that color discrete regions, this plot shows smooth density variations computed from point data or gridded values. The color intensity at each location represents the concentration or magnitude of the underlying data, making it ideal for identifying hotspots, clusters, and spatial patterns in geographic data.
""" anyplot.ai
heatmap-geographic: Geographic Heatmap for Spatial Density
Library: pygal 3.1.0 | Python 3.13.13
Quality: 73/100 | Updated: 2026-05-19
"""

import sys

import numpy as np


# Remove current directory from path to avoid shadowing the pygal package
_cwd = sys.path[0] if sys.path and sys.path[0] else "."
if _cwd in sys.path:
    sys.path.remove(_cwd)

from pygal.graph.graph import Graph
from pygal.style import Style


sys.path.insert(0, _cwd)


class GeoHeatmap(Graph):
    """Custom Geographic Heatmap for pygal - displays spatial density as colored grid."""

    def __init__(self, *args, **kwargs):
        self.heatmap_data = kwargs.pop("heatmap_data", None)
        self.lat_range = kwargs.pop("lat_range", (-90, 90))
        self.lon_range = kwargs.pop("lon_range", (-180, 180))
        self.colormap = kwargs.pop("colormap", ["#ffffb2", "#fecc5c", "#fd8d3c", "#f03b20", "#bd0026"])
        self.coastlines = kwargs.pop("coastlines", [])
        self.point_data = kwargs.pop("point_data", None)
        super().__init__(*args, **kwargs)

    def _interpolate_color(self, value, min_val, max_val):
        """Interpolate color for smooth gradient."""
        if max_val == min_val:
            return self.colormap[-1]

        normalized = (value - min_val) / (max_val - min_val)
        normalized = max(0, min(1, normalized))

        pos = normalized * (len(self.colormap) - 1)
        idx1 = int(pos)
        idx2 = min(idx1 + 1, len(self.colormap) - 1)
        frac = pos - idx1

        c1 = self.colormap[idx1]
        c2 = self.colormap[idx2]

        r1, g1, b1 = int(c1[1:3], 16), int(c1[3:5], 16), int(c1[5:7], 16)
        r2, g2, b2 = int(c2[1:3], 16), int(c2[3:5], 16), int(c2[5:7], 16)

        r = int(r1 + (r2 - r1) * frac)
        g = int(g1 + (g2 - g1) * frac)
        b = int(b1 + (b2 - b1) * frac)

        return f"#{r:02x}{g:02x}{b:02x}"

    def _plot(self):
        """Draw the geographic heatmap."""
        if self.heatmap_data is None:
            return

        heatmap = self.heatmap_data
        n_rows, n_cols = heatmap.shape

        plot_width = self.view.width
        plot_height = self.view.height

        # Layout margins
        label_margin_left = 180
        label_margin_right = 280
        label_margin_top = 60
        label_margin_bottom = 180

        available_width = plot_width - label_margin_left - label_margin_right
        available_height = plot_height - label_margin_top - label_margin_bottom

        # Calculate cell size
        cell_width = available_width / n_cols
        cell_height = available_height / n_rows

        x_offset = self.view.x(0) + label_margin_left
        y_offset = self.view.y(n_rows) + label_margin_top

        # Create group for the heatmap
        plot_node = self.nodes["plot"]
        heatmap_group = self.svg.node(plot_node, class_="geo-heatmap")

        # Draw background rectangle for plot area
        bg_rect = self.svg.node(
            heatmap_group, "rect", x=x_offset, y=y_offset, width=available_width, height=available_height
        )
        bg_rect.set("fill", "#e8f4f8")
        bg_rect.set("stroke", "#333333")
        bg_rect.set("stroke-width", "2")

        # Draw grid lines
        lat_min, lat_max = self.lat_range
        lon_min, lon_max = self.lon_range

        def lon_to_x(lon):
            return x_offset + (lon - lon_min) / (lon_max - lon_min) * available_width

        def lat_to_y(lat):
            return y_offset + (1 - (lat - lat_min) / (lat_max - lat_min)) * available_height

        # Vertical grid lines (longitude)
        n_lon_lines = 7
        for i in range(n_lon_lines):
            lon = lon_min + (lon_max - lon_min) * i / (n_lon_lines - 1)
            x = lon_to_x(lon)
            line = self.svg.node(heatmap_group, "line", x1=x, y1=y_offset, x2=x, y2=y_offset + available_height)
            line.set("stroke", "#cccccc")
            line.set("stroke-width", "1")
            line.set("stroke-opacity", "0.5")

        # Horizontal grid lines (latitude)
        n_lat_lines = 7
        for i in range(n_lat_lines):
            lat = lat_min + (lat_max - lat_min) * i / (n_lat_lines - 1)
            y = lat_to_y(lat)
            line = self.svg.node(heatmap_group, "line", x1=x_offset, y1=y, x2=x_offset + available_width, y2=y)
            line.set("stroke", "#cccccc")
            line.set("stroke-width", "1")
            line.set("stroke-opacity", "0.5")

        # Draw heatmap cells
        all_values = heatmap.flatten()
        positive_values = all_values[all_values > 0]
        if len(positive_values) > 0:
            min_val = positive_values.min()
            max_val = positive_values.max()
        else:
            min_val, max_val = 0, 1

        for i in range(n_rows):
            for j in range(n_cols):
                value = heatmap[i, j]
                if value <= 0:
                    continue

                color = self._interpolate_color(value, min_val, max_val)
                # Variable opacity based on value intensity for basemap visibility
                opacity = 0.4 + 0.45 * (value - min_val) / (max_val - min_val) if max_val > min_val else 0.65

                x = x_offset + j * cell_width
                y = y_offset + (n_rows - 1 - i) * cell_height

                rect = self.svg.node(heatmap_group, "rect", x=x, y=y, width=cell_width + 0.5, height=cell_height + 0.5)
                rect.set("fill", color)
                rect.set("fill-opacity", str(opacity))
                rect.set("stroke", "none")

        # Draw coastlines
        for coastline in self.coastlines:
            if len(coastline) < 2:
                continue
            points = " ".join([f"{lon_to_x(lon)},{lat_to_y(lat)}" for lon, lat in coastline])
            polyline = self.svg.node(heatmap_group, "polyline", points=points)
            polyline.set("fill", "none")
            polyline.set("stroke", "#333333")
            polyline.set("stroke-width", "3")
            polyline.set("stroke-opacity", "0.7")

        # Draw scatter points with improved visibility (larger radius for better visibility)
        if self.point_data is not None:
            for lon, lat in self.point_data:
                cx = lon_to_x(lon)
                cy = lat_to_y(lat)
                circle = self.svg.node(heatmap_group, "circle", cx=cx, cy=cy, r=12)
                circle.set("fill", "#306998")
                circle.set("fill-opacity", "0.7")
                circle.set("stroke", "#1a3a5c")
                circle.set("stroke-width", "1.5")
                circle.set("stroke-opacity", "0.9")

        # Draw axis labels
        axis_font_size = 48
        tick_font_size = 36

        # X-axis label
        text_node = self.svg.node(
            heatmap_group, "text", x=x_offset + available_width / 2, y=y_offset + available_height + 130
        )
        text_node.set("text-anchor", "middle")
        text_node.set("fill", "#333333")
        text_node.set("style", f"font-size:{axis_font_size}px;font-weight:bold;font-family:sans-serif")
        text_node.text = "Longitude (°)"

        # Y-axis label
        text_node = self.svg.node(heatmap_group, "text", x=x_offset - 100, y=y_offset + available_height / 2)
        text_node.set("text-anchor", "middle")
        text_node.set("fill", "#333333")
        text_node.set("style", f"font-size:{axis_font_size}px;font-weight:bold;font-family:sans-serif")
        text_node.set("transform", f"rotate(-90, {x_offset - 100}, {y_offset + available_height / 2})")
        text_node.text = "Latitude (°)"

        # X-axis ticks
        n_x_ticks = 6
        for i in range(n_x_ticks):
            lon = lon_min + (lon_max - lon_min) * i / (n_x_ticks - 1)
            x = lon_to_x(lon)
            text_node = self.svg.node(heatmap_group, "text", x=x, y=y_offset + available_height + 50)
            text_node.set("text-anchor", "middle")
            text_node.set("fill", "#333333")
            text_node.set("style", f"font-size:{tick_font_size}px;font-family:sans-serif")
            text_node.text = f"{lon:.0f}"

        # Y-axis ticks
        n_y_ticks = 6
        for i in range(n_y_ticks):
            lat = lat_min + (lat_max - lat_min) * i / (n_y_ticks - 1)
            y = lat_to_y(lat)
            text_node = self.svg.node(heatmap_group, "text", x=x_offset - 20, y=y + tick_font_size * 0.35)
            text_node.set("text-anchor", "end")
            text_node.set("fill", "#333333")
            text_node.set("style", f"font-size:{tick_font_size}px;font-family:sans-serif")
            text_node.text = f"{lat:.0f}"

        # Draw colorbar on the right
        colorbar_width = 50
        colorbar_height = available_height * 0.7
        colorbar_x = x_offset + available_width + 60
        colorbar_y = y_offset + (available_height - colorbar_height) / 2

        # Draw gradient colorbar
        n_segments = 50
        segment_height = colorbar_height / n_segments
        for i in range(n_segments):
            seg_value = min_val + (max_val - min_val) * (n_segments - 1 - i) / (n_segments - 1)
            seg_color = self._interpolate_color(seg_value, min_val, max_val)
            seg_y = colorbar_y + i * segment_height

            self.svg.node(
                heatmap_group,
                "rect",
                x=colorbar_x,
                y=seg_y,
                width=colorbar_width,
                height=segment_height + 1,
                fill=seg_color,
            )

        # Colorbar border
        self.svg.node(
            heatmap_group,
            "rect",
            x=colorbar_x,
            y=colorbar_y,
            width=colorbar_width,
            height=colorbar_height,
            fill="none",
            stroke="#333333",
        )

        # Colorbar labels with 5 tick values
        cb_label_size = 36
        n_cb_ticks = 5
        for i in range(n_cb_ticks):
            tick_value = max_val - (max_val - min_val) * i / (n_cb_ticks - 1)
            tick_y = colorbar_y + colorbar_height * i / (n_cb_ticks - 1)
            text_node = self.svg.node(
                heatmap_group, "text", x=colorbar_x + colorbar_width + 15, y=tick_y + cb_label_size * 0.35
            )
            text_node.set("fill", "#333333")
            text_node.set("style", f"font-size:{cb_label_size}px;font-family:sans-serif")
            text_node.text = f"{tick_value:.1f}"

        # Colorbar title
        cb_title_size = 38
        cb_title_x = colorbar_x + colorbar_width / 2
        cb_title_y = colorbar_y - 30
        text_node = self.svg.node(heatmap_group, "text", x=cb_title_x, y=cb_title_y)
        text_node.set("text-anchor", "middle")
        text_node.set("fill", "#333333")
        text_node.set("style", f"font-size:{cb_title_size}px;font-weight:bold;font-family:sans-serif")
        text_node.text = "Density"

        # Legend for scatter points (below colorbar)
        legend_y = colorbar_y + colorbar_height + 60
        legend_x = colorbar_x

        # Legend marker (circle matching scatter points)
        legend_circle = self.svg.node(heatmap_group, "circle", cx=legend_x + 12, cy=legend_y, r=12)
        legend_circle.set("fill", "#306998")
        legend_circle.set("fill-opacity", "0.7")
        legend_circle.set("stroke", "#1a3a5c")
        legend_circle.set("stroke-width", "1.5")

        # Legend text
        legend_text = self.svg.node(heatmap_group, "text", x=legend_x + 35, y=legend_y + 10)
        legend_text.set("fill", "#333333")
        legend_text.set("style", f"font-size:{cb_label_size}px;font-family:sans-serif")
        legend_text.text = "Station"

    def _compute(self):
        """Compute the box for rendering."""
        n_rows = self.heatmap_data.shape[0] if self.heatmap_data is not None else 1
        n_cols = self.heatmap_data.shape[1] if self.heatmap_data is not None else 1
        self._box.xmin = 0
        self._box.xmax = n_cols
        self._box.ymin = 0
        self._box.ymax = n_rows


# Data: Simulated environmental monitoring stations across California
np.random.seed(42)

n_points = 500

# Create clusters representing different monitoring regions
# Central California coast cluster
coast_lat = np.random.normal(36.5, 0.8, n_points // 3)
coast_lon = np.random.normal(-121.5, 0.5, n_points // 3)

# Southern California cluster
socal_lat = np.random.normal(34.0, 0.6, n_points // 3)
socal_lon = np.random.normal(-118.0, 0.7, n_points // 3)

# Northern California cluster
norcal_lat = np.random.normal(38.5, 0.5, n_points // 3 + n_points % 3)
norcal_lon = np.random.normal(-122.5, 0.4, n_points // 3 + n_points % 3)

# Combine all clusters
latitudes = np.concatenate([coast_lat, socal_lat, norcal_lat])
longitudes = np.concatenate([coast_lon, socal_lon, norcal_lon])

# Measurement values (air quality index readings)
values = np.random.exponential(scale=50, size=len(latitudes)) + 20

# Map boundaries for California
lat_min, lat_max = 32.5, 42.0
lon_min, lon_max = -125.0, -114.0

# Create 2D histogram for density estimation
grid_resolution = 80
lat_bins = np.linspace(lat_min, lat_max, grid_resolution)
lon_bins = np.linspace(lon_min, lon_max, grid_resolution)

heatmap, lat_edges, lon_edges = np.histogram2d(
    latitudes, longitudes, bins=[lat_bins, lon_bins], weights=values, density=False
)

# Apply Gaussian smoothing for continuous appearance
sigma = 2
kernel_size = int(6 * sigma + 1)
if kernel_size % 2 == 0:
    kernel_size += 1
kernel_x = np.arange(kernel_size) - kernel_size // 2
kernel_1d = np.exp(-(kernel_x**2) / (2 * sigma**2))
kernel_1d = kernel_1d / kernel_1d.sum()

heatmap_smooth = np.apply_along_axis(lambda row: np.convolve(row, kernel_1d, mode="same"), axis=0, arr=heatmap)
heatmap_smooth = np.apply_along_axis(lambda col: np.convolve(col, kernel_1d, mode="same"), axis=1, arr=heatmap_smooth)

# California coastline approximation
coast_lons = [
    -124.4,
    -124.2,
    -123.8,
    -122.4,
    -122.0,
    -121.5,
    -121.0,
    -120.5,
    -120.0,
    -119.5,
    -119.0,
    -118.5,
    -118.0,
    -117.5,
    -117.2,
    -117.0,
    -117.1,
    -117.3,
]
coast_lats = [
    42.0,
    40.5,
    39.0,
    37.8,
    37.5,
    36.8,
    36.5,
    35.5,
    35.0,
    34.5,
    34.2,
    34.0,
    33.8,
    33.2,
    33.0,
    32.7,
    32.5,
    32.5,
]
coastline_west = list(zip(coast_lons, coast_lats, strict=True))

east_lons = [-117.3, -117.0, -116.5, -115.5, -114.6, -114.6, -120.0, -120.0, -121.0, -122.0, -123.0, -124.2, -124.4]
east_lats = [32.5, 33.0, 33.5, 34.0, 34.8, 36.0, 39.0, 40.0, 41.0, 41.5, 42.0, 42.0, 42.0]
coastline_east = list(zip(east_lons, east_lats, strict=True))

coastlines = [coastline_west, coastline_east]

# Point data for scatter overlay
point_data = list(zip(longitudes, latitudes, strict=True))

# YlOrRd colormap
colormap = ["#ffffb2", "#fed976", "#feb24c", "#fd8d3c", "#fc4e2a", "#e31a1c", "#b10026"]

# Custom style
custom_style = Style(
    background="white",
    plot_background="#e8f4f8",
    foreground="#333333",
    foreground_strong="#333333",
    foreground_subtle="#666666",
    colors=("#306998",),
    title_font_size=64,
    legend_font_size=40,
    label_font_size=42,
    value_font_size=36,
    font_family="sans-serif",
)

# Create heatmap chart
chart = GeoHeatmap(
    width=4800,
    height=2700,
    style=custom_style,
    title="heatmap-geographic · pygal · pyplots.ai",
    heatmap_data=heatmap_smooth,
    lat_range=(lat_min, lat_max),
    lon_range=(lon_min, lon_max),
    colormap=colormap,
    coastlines=coastlines,
    point_data=point_data,
    show_legend=False,
    margin=100,
    margin_top=160,
    margin_bottom=80,
    show_x_labels=False,
    show_y_labels=False,
)

# Add a dummy series to trigger _plot
chart.add("", [0])

# Save PNG output only
chart.render_to_png("plot.png")
Runnable source as JSON, for any HTTP client: https://api.anyplot.ai/specs/heatmap-geographic/pygal/code. Any spec id and library id listed in llms-full.txt fit the same URL shape; every URL below is complete and callable.
{
  "spec_id": "heatmap-geographic",
  "language": "python",
  "library": "pygal",
  "page": "https://anyplot.ai/heatmap-geographic/python/pygal",
  "hub": "https://anyplot.ai/heatmap-geographic",
  "code_json": "https://api.anyplot.ai/specs/heatmap-geographic/pygal/code",
  "spec_json": "https://api.anyplot.ai/specs/heatmap-geographic",
  "render_light_png": "https://storage.googleapis.com/anyplot-images/plots/heatmap-geographic/python/pygal/plot-light.png",
  "render_dark_png": "https://storage.googleapis.com/anyplot-images/plots/heatmap-geographic/python/pygal/plot-dark.png",
  "interactive_light_html": "https://storage.googleapis.com/anyplot-images/plots/heatmap-geographic/python/pygal/plot-light.html",
  "interactive_dark_html": "https://storage.googleapis.com/anyplot-images/plots/heatmap-geographic/python/pygal/plot-dark.html",
  "quality_score": 73.0,
  "license": "MIT",
  "guide": "https://anyplot.ai/llms.txt"
}
Part of Geographic Heatmap for Spatial Density on anyplot.ai.