The same plot in 14 other libraries — JavaScript: Chart.js, D3.js, Highcharts, MUI X Charts; Python: Altair, Bokeh, lets-plot, Matplotlib, Plotly, plotnine, Pygal, Seaborn; R: ggplot2; Julia: Makie.jl. Compare all 15 side by side: Geographic Heatmap for Spatial Density in Python, R, Julia and JavaScript.
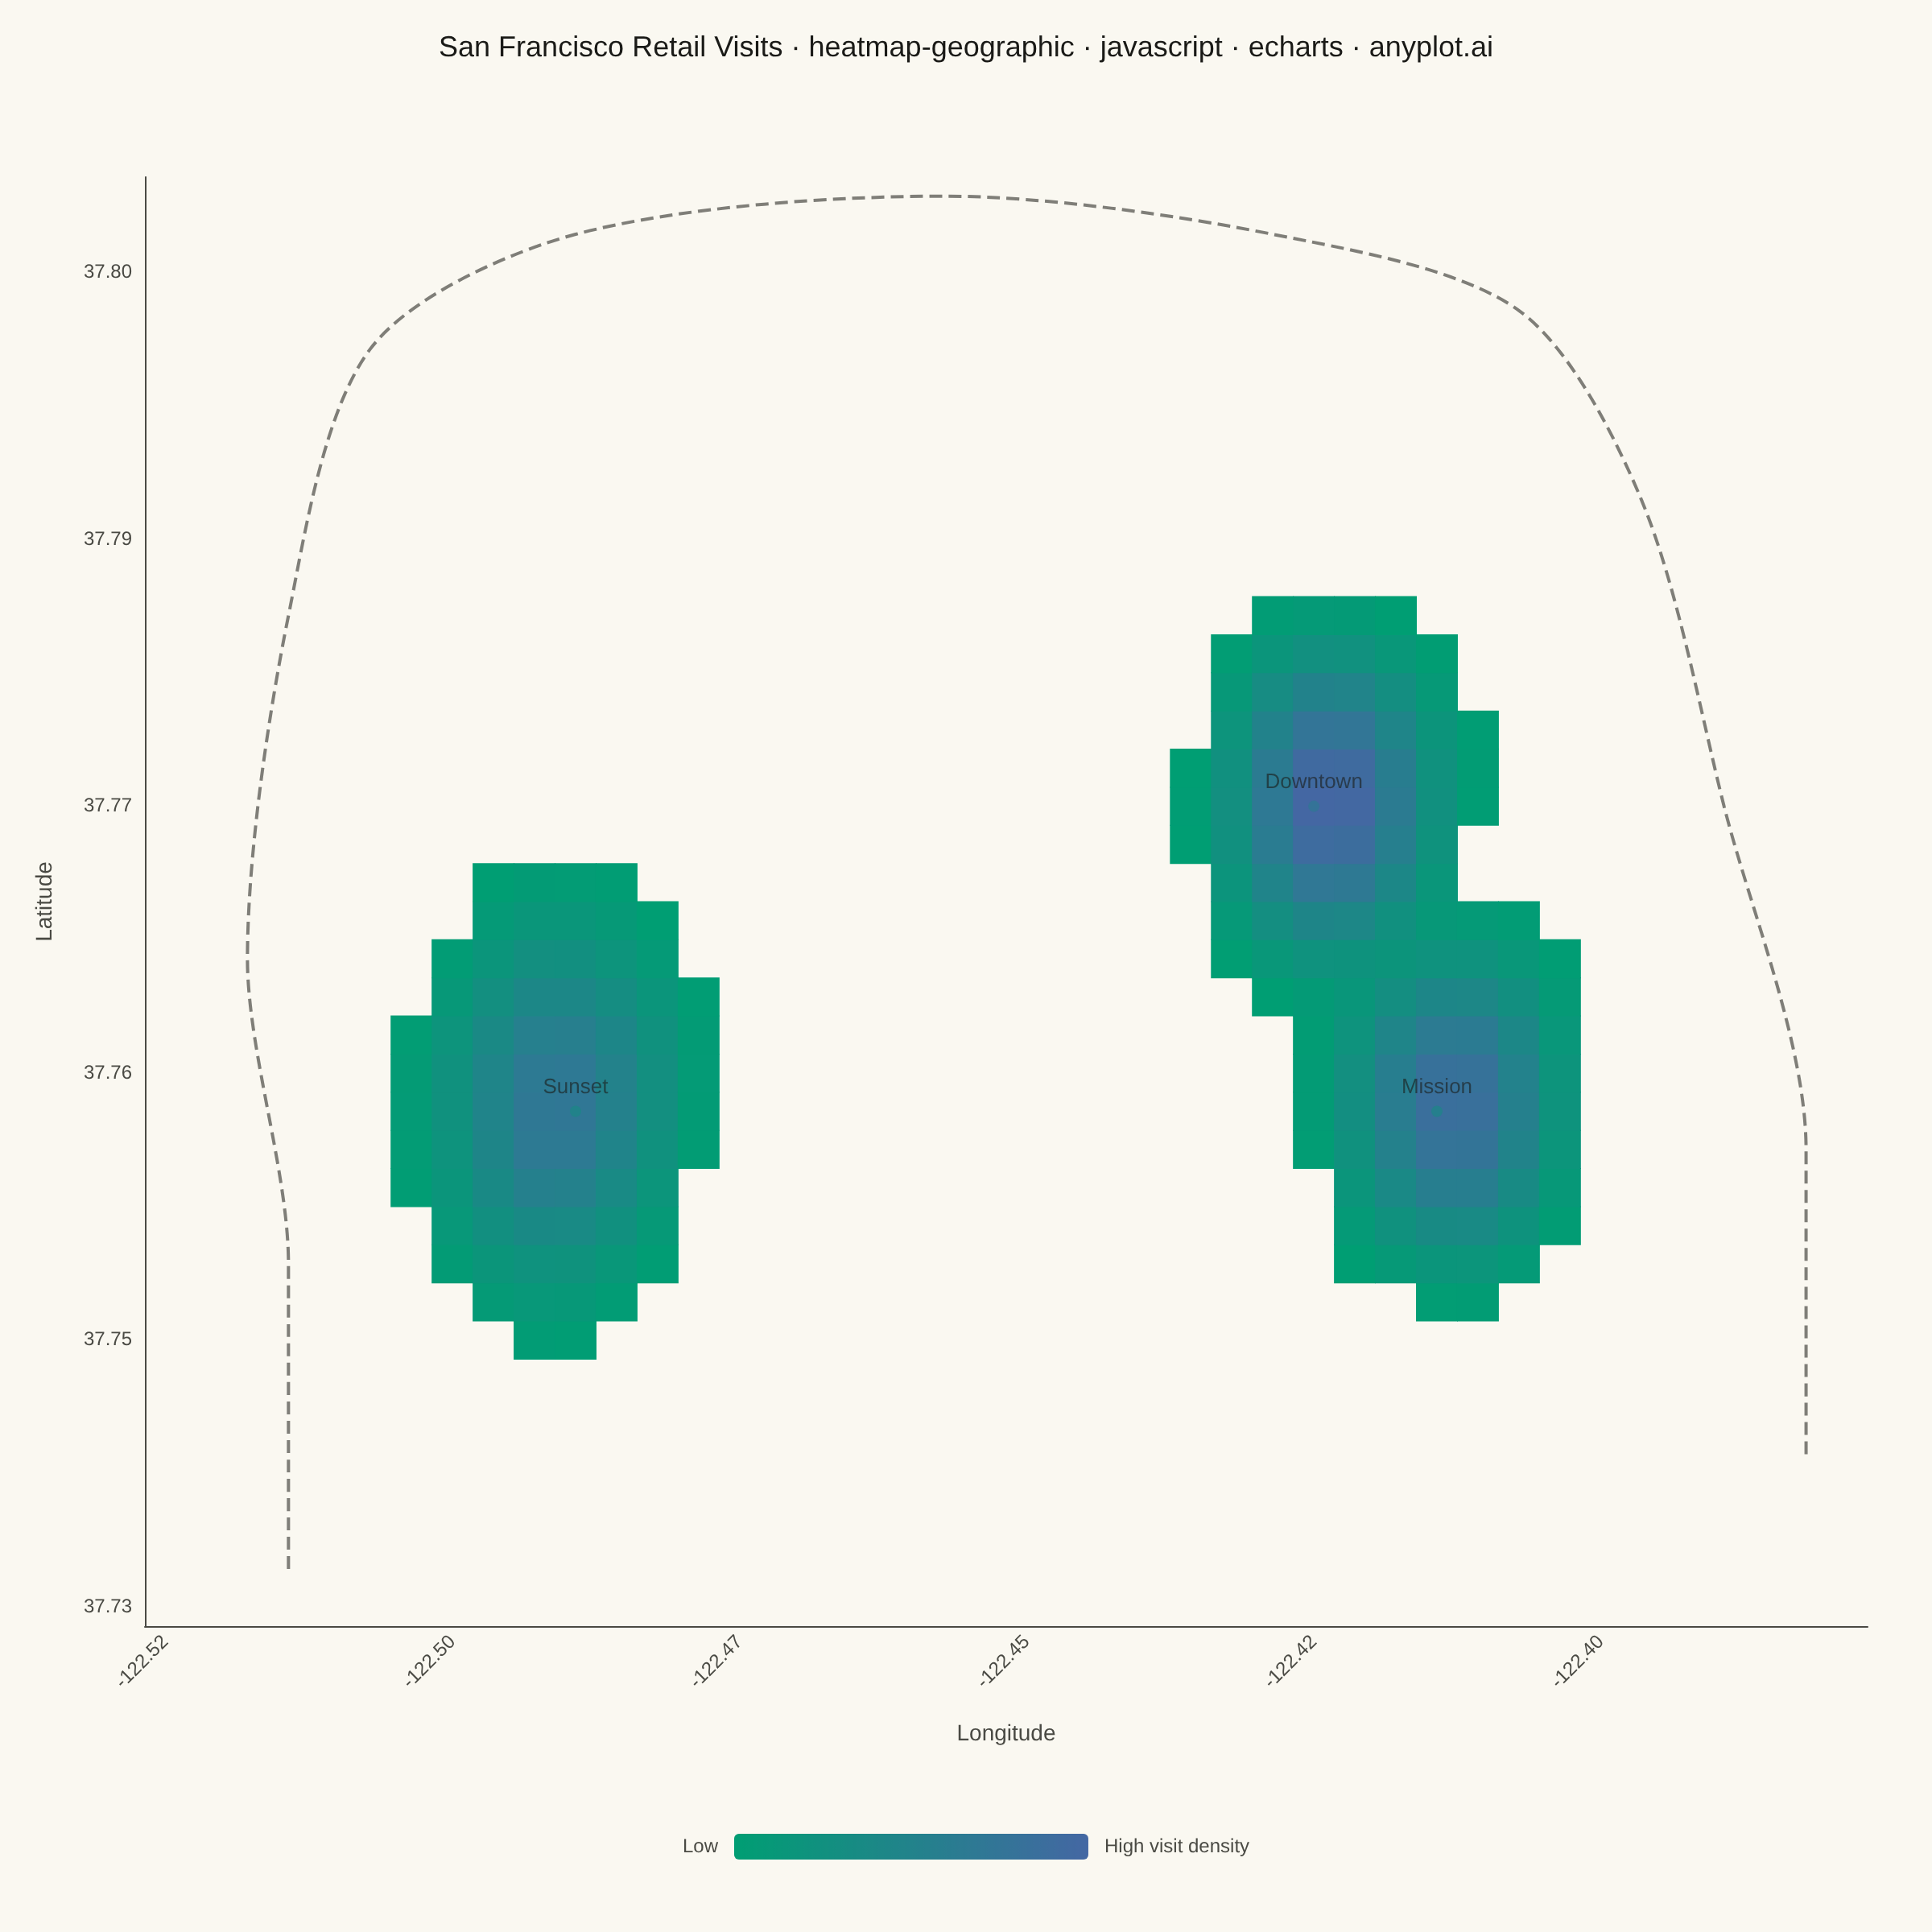
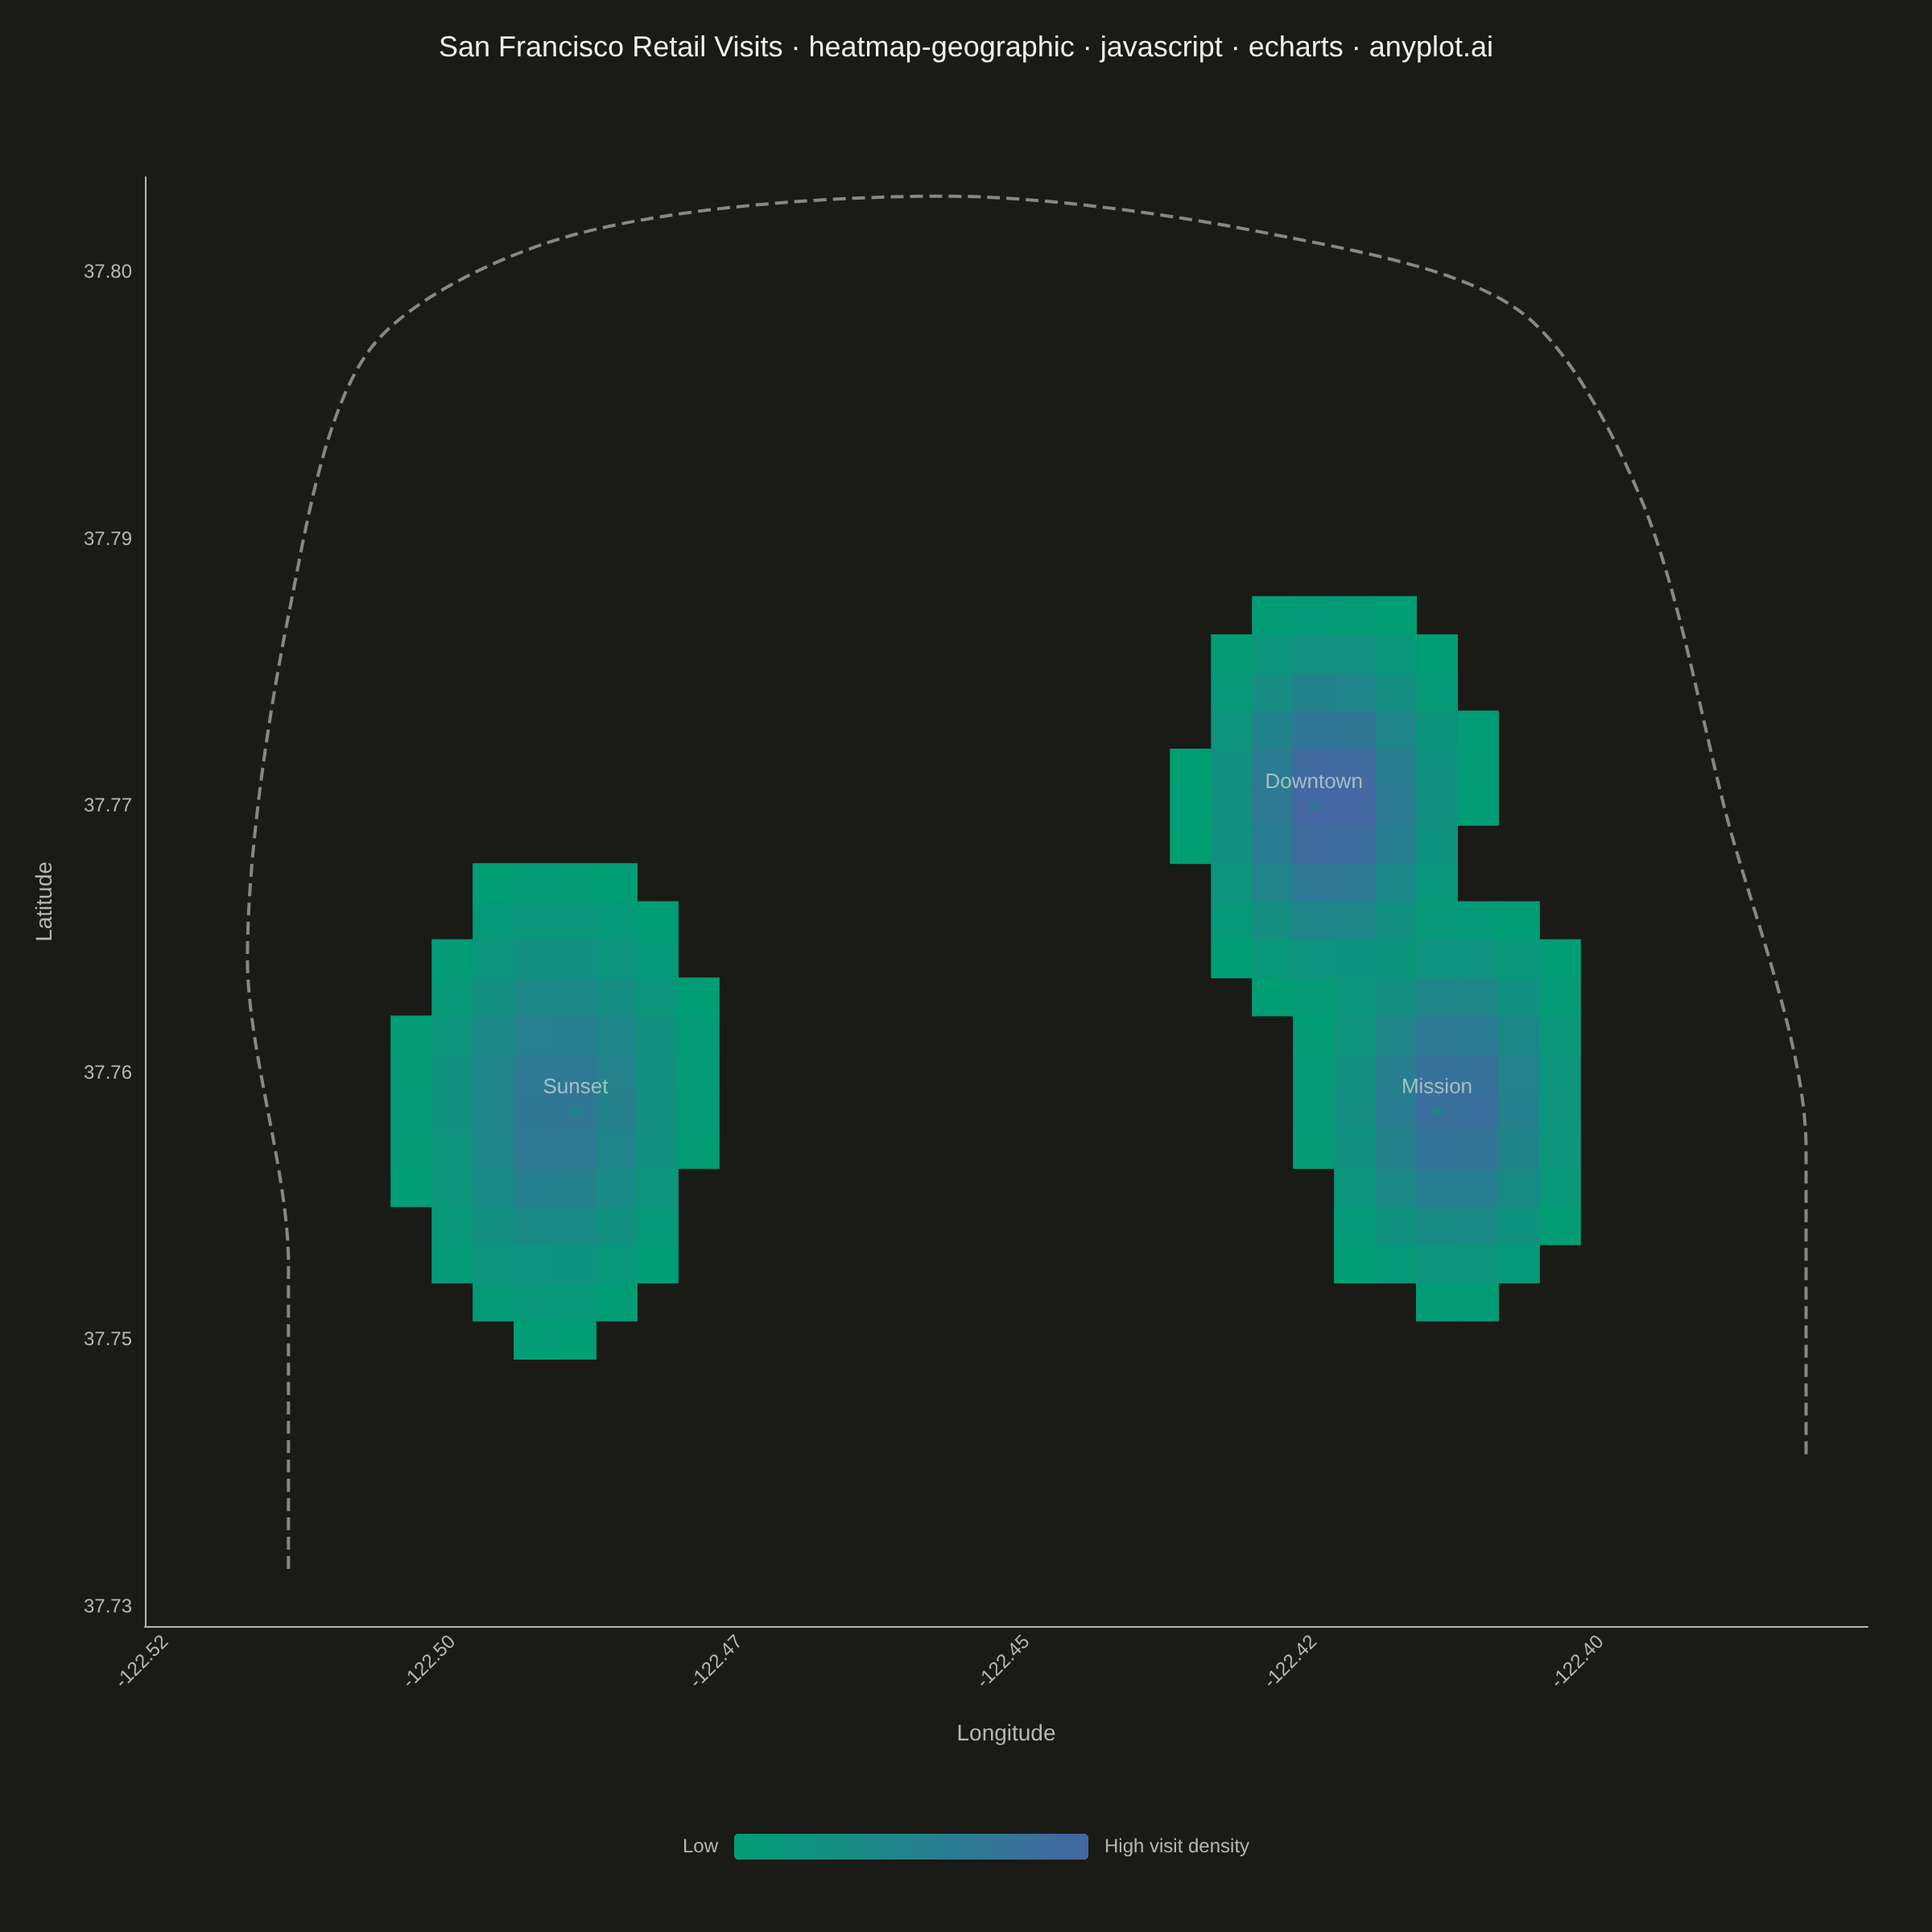
A geographic heatmap visualizes spatial density or intensity values across a map using continuous color gradients. Unlike choropleth maps that color discrete regions, this plot shows smooth density variations computed from point data or gridded values. The color intensity at each location represents the concentration or magnitude of the underlying data, making it ideal for identifying hotspots, clusters, and spatial patterns in geographic data.
// anyplot.ai
// heatmap-geographic: Geographic Heatmap for Spatial Density
// Library: echarts 6.1.0 | JavaScript 22.23.2
// Quality: 85/100 | Created: 2026-09-02

//# anyplot-orientation: square
const t = window.ANYPLOT_TOKENS;

// --- Data: synthetic retail-visit pings across San Francisco ---------------
// Fixed-seed LCG (no seeded Math.random in the browser)
function makeLcg(seed) {
  let state = seed >>> 0;
  return function rng() {
    state = (Math.imul(state, 1664525) + 1013904223) >>> 0;
    return state / 4294967296;
  };
}
const rng = makeLcg(42);

function gaussian(mean, std) {
  const u1 = Math.max(rng(), 1e-9);
  const u2 = rng();
  const z = Math.sqrt(-2 * Math.log(u1)) * Math.cos(2 * Math.PI * u2);
  return mean + z * std;
}

// Neighborhood clusters: center coord, point count, spread, visit-weight range.
// Downtown/Mission lonStd/latStd (~0.22km) are narrow relative to their ~1.9km
// separation, and the KDE bandwidth below is tightened to match, so the two
// peaks stay distinct instead of blurring into a shared plateau. Sunset keeps
// a wider spread (it's a more residential/coastal area) but its weightMean/n
// are close enough to Downtown/Mission's that its peak still clears the
// low-density baseline once the density is color-mapped (see the `scaled`
// power-law compression below) - verified against the rendered PNG, not just
// asserted here.
const neighborhoods = [
  { name: "Downtown", lon: -122.4194, lat: 37.7749, n: 700, lonStd: 0.0025, latStd: 0.0021, weightMean: 62, weightStd: 20 },
  { name: "Mission", lon: -122.4090, lat: 37.7599, n: 600, lonStd: 0.0025, latStd: 0.0021, weightMean: 50, weightStd: 18 },
  { name: "Sunset", lon: -122.4862, lat: 37.7599, n: 540, lonStd: 0.0032, latStd: 0.0028, weightMean: 45, weightStd: 15 },
];

const points = [];
neighborhoods.forEach((c) => {
  for (let i = 0; i < c.n; i++) {
    points.push({
      lon: gaussian(c.lon, c.lonStd),
      lat: gaussian(c.lat, c.latStd),
      weight: Math.max(5, gaussian(c.weightMean, c.weightStd)),
    });
  }
});

// --- Kernel density estimation onto a lon/lat grid --------------------------
const lonMin = -122.52, lonMax = -122.375;
const latMin = 37.735, latMax = 37.805;
const nx = 42, ny = 38;
const bandwidthLon = 0.0025, bandwidthLat = 0.0021;

const cellLon = (i) => lonMin + ((lonMax - lonMin) * i) / (nx - 1);
const cellLat = (j) => latMin + ((latMax - latMin) * j) / (ny - 1);
const lonIndexF = (lon) => ((lon - lonMin) / (lonMax - lonMin)) * (nx - 1);
const latIndexF = (lat) => ((lat - latMin) / (latMax - latMin)) * (ny - 1);

const rawGrid = [];
let maxDensity = 0;
for (let i = 0; i < nx; i++) {
  const lon = cellLon(i);
  for (let j = 0; j < ny; j++) {
    const lat = cellLat(j);
    let density = 0;
    for (const p of points) {
      const dLon = (lon - p.lon) / bandwidthLon;
      const dLat = (lat - p.lat) / bandwidthLat;
      density += p.weight * Math.exp(-0.5 * (dLon * dLon + dLat * dLat));
    }
    // Power-law (exponent 0.35, stronger than sqrt) compression: pulls the
    // Downtown peak down relatively more than the Sunset peak, so all three
    // named hotspots land in visibly distinct bands of the color scale
    // instead of Sunset washing out near the zero-density baseline.
    const scaled = Math.pow(density, 0.35);
    rawGrid.push([i, j, scaled]);
    if (scaled > maxDensity) maxDensity = scaled;
  }
}

// Mask out the near-zero-density baseline (the vast majority of the grid)
// instead of rendering it opaque, so the coastline basemap beneath actually
// shows through per the spec's transparency requirement. Per-cell
// itemStyle.opacity was tried first but produces visible seams between
// adjacent translucent cells (a canvas anti-aliasing artifact); omitting
// low-density cells entirely avoids that and reads as an honest density
// floor besides.
const minDensity = 0.1 * maxDensity;
const grid = rawGrid.filter(([, , scaled]) => scaled >= minDensity);

const lonIndex = (lon) => Math.round(((lon - lonMin) / (lonMax - lonMin)) * (nx - 1));
const latIndex = (lat) => Math.round(((lat - latMin) / (latMax - latMin)) * (ny - 1));
const markers = neighborhoods.map((c) => ({
  value: [lonIndex(c.lon), latIndex(c.lat)],
  name: c.name,
}));

const lonLabels = Array.from({ length: nx }, (_, i) => cellLon(i).toFixed(2));
const latLabels = Array.from({ length: ny }, (_, j) => cellLat(j).toFixed(2));

// Simplified San Francisco shoreline (Ocean Beach -> Golden Gate -> northern
// waterfront -> Bay side), hand-picked lon/lat vertices anchoring the density
// grid to real geography.
const coastlinePoints = [
  [-122.5090, 37.736],
  [-122.5110, 37.752],
  [-122.5115, 37.768],
  [-122.5095, 37.784],
  [-122.5010, 37.797],
  [-122.4830, 37.804],
  [-122.4520, 37.805],
  [-122.4250, 37.804],
  [-122.4040, 37.799],
  [-122.3910, 37.789],
  [-122.3855, 37.774],
  [-122.3800, 37.758],
  [-122.3770, 37.742],
].map(([lon, lat]) => [lonIndexF(lon), latIndexF(lat)]);

// --- Title (fontsize scales down for the descriptive prefix) ---------------
const title = "San Francisco Retail Visits · heatmap-geographic · javascript · echarts · anyplot.ai";
const titleFontSize = Math.max(14, Math.round(22 * Math.min(1, 67 / title.length)));

// --- Init ---------------------------------------------------------------
const chart = echarts.init(document.getElementById("container"));

// --- Option ---------------------------------------------------------------
chart.setOption({
  animation: false,
  backgroundColor: "transparent",
  title: {
    text: title,
    left: "center",
    top: 16,
    textStyle: { color: t.ink, fontSize: titleFontSize, fontWeight: 500 },
  },
  grid: { left: 90, right: 40, top: 110, bottom: 190 },
  xAxis: {
    type: "category",
    data: lonLabels,
    name: "Longitude",
    nameLocation: "middle",
    nameGap: 60,
    nameTextStyle: { color: t.inkSoft, fontSize: 14 },
    axisLabel: { color: t.inkSoft, fontSize: 12, interval: 6, rotate: 45 },
    axisLine: { lineStyle: { color: t.inkSoft } },
    axisTick: { show: false },
    splitArea: { show: false },
  },
  yAxis: {
    type: "category",
    data: latLabels,
    name: "Latitude",
    nameLocation: "middle",
    nameGap: 55,
    nameTextStyle: { color: t.inkSoft, fontSize: 14 },
    axisLabel: { color: t.inkSoft, fontSize: 12, interval: 6 },
    axisLine: { lineStyle: { color: t.inkSoft } },
    axisTick: { show: false },
    splitArea: { show: false },
  },
  visualMap: {
    type: "continuous",
    min: minDensity,
    max: maxDensity,
    calculable: false,
    orient: "horizontal",
    left: "center",
    bottom: 30,
    itemWidth: 16,
    itemHeight: 220,
    text: ["High visit density", "Low"],
    textStyle: { color: t.inkSoft, fontSize: 12 },
    inRange: { color: t.seq },
  },
  dataZoom: [
    { type: "inside", xAxisIndex: 0 },
    { type: "inside", yAxisIndex: 0 },
  ],
  series: [
    {
      // Drawn first (below the heatmap in z-order) as the basemap layer -
      // visible wherever the masked density grid above leaves a gap.
      name: "Coastline",
      type: "line",
      coordinateSystem: "cartesian2d",
      data: coastlinePoints,
      showSymbol: false,
      smooth: 0.3,
      lineStyle: { color: t.inkSoft, width: 2, type: "dashed", opacity: 0.7 },
      z: 1,
      silent: true,
      tooltip: { show: false },
    },
    {
      name: "Visit density",
      type: "heatmap",
      coordinateSystem: "cartesian2d",
      data: grid,
      progressive: 0,
      itemStyle: { borderWidth: 0 },
      z: 2,
    },
    {
      name: "Neighborhood",
      type: "scatter",
      data: markers,
      symbolSize: 7,
      itemStyle: { color: t.ink, opacity: 0.6 },
      label: {
        show: true,
        formatter: "{b}",
        position: "top",
        color: t.ink,
        fontSize: 13,
        fontWeight: 500,
      },
      z: 10,
      tooltip: { show: false },
    },
  ],
});
Runnable source as JSON, for any HTTP client: https://api.anyplot.ai/specs/heatmap-geographic/echarts/code. Any spec id and library id listed in llms-full.txt fit the same URL shape; every URL below is complete and callable.
{
  "spec_id": "heatmap-geographic",
  "language": "javascript",
  "library": "echarts",
  "page": "https://anyplot.ai/heatmap-geographic/javascript/echarts",
  "hub": "https://anyplot.ai/heatmap-geographic",
  "code_json": "https://api.anyplot.ai/specs/heatmap-geographic/echarts/code",
  "spec_json": "https://api.anyplot.ai/specs/heatmap-geographic",
  "render_light_png": "https://storage.googleapis.com/anyplot-images/plots/heatmap-geographic/javascript/echarts/plot-light.png",
  "render_dark_png": "https://storage.googleapis.com/anyplot-images/plots/heatmap-geographic/javascript/echarts/plot-dark.png",
  "interactive_light_html": "https://storage.googleapis.com/anyplot-images/plots/heatmap-geographic/javascript/echarts/plot-light.html",
  "interactive_dark_html": "https://storage.googleapis.com/anyplot-images/plots/heatmap-geographic/javascript/echarts/plot-dark.html",
  "quality_score": 85.0,
  "license": "MIT",
  "guide": "https://anyplot.ai/llms.txt"
}
Part of Geographic Heatmap for Spatial Density on anyplot.ai.