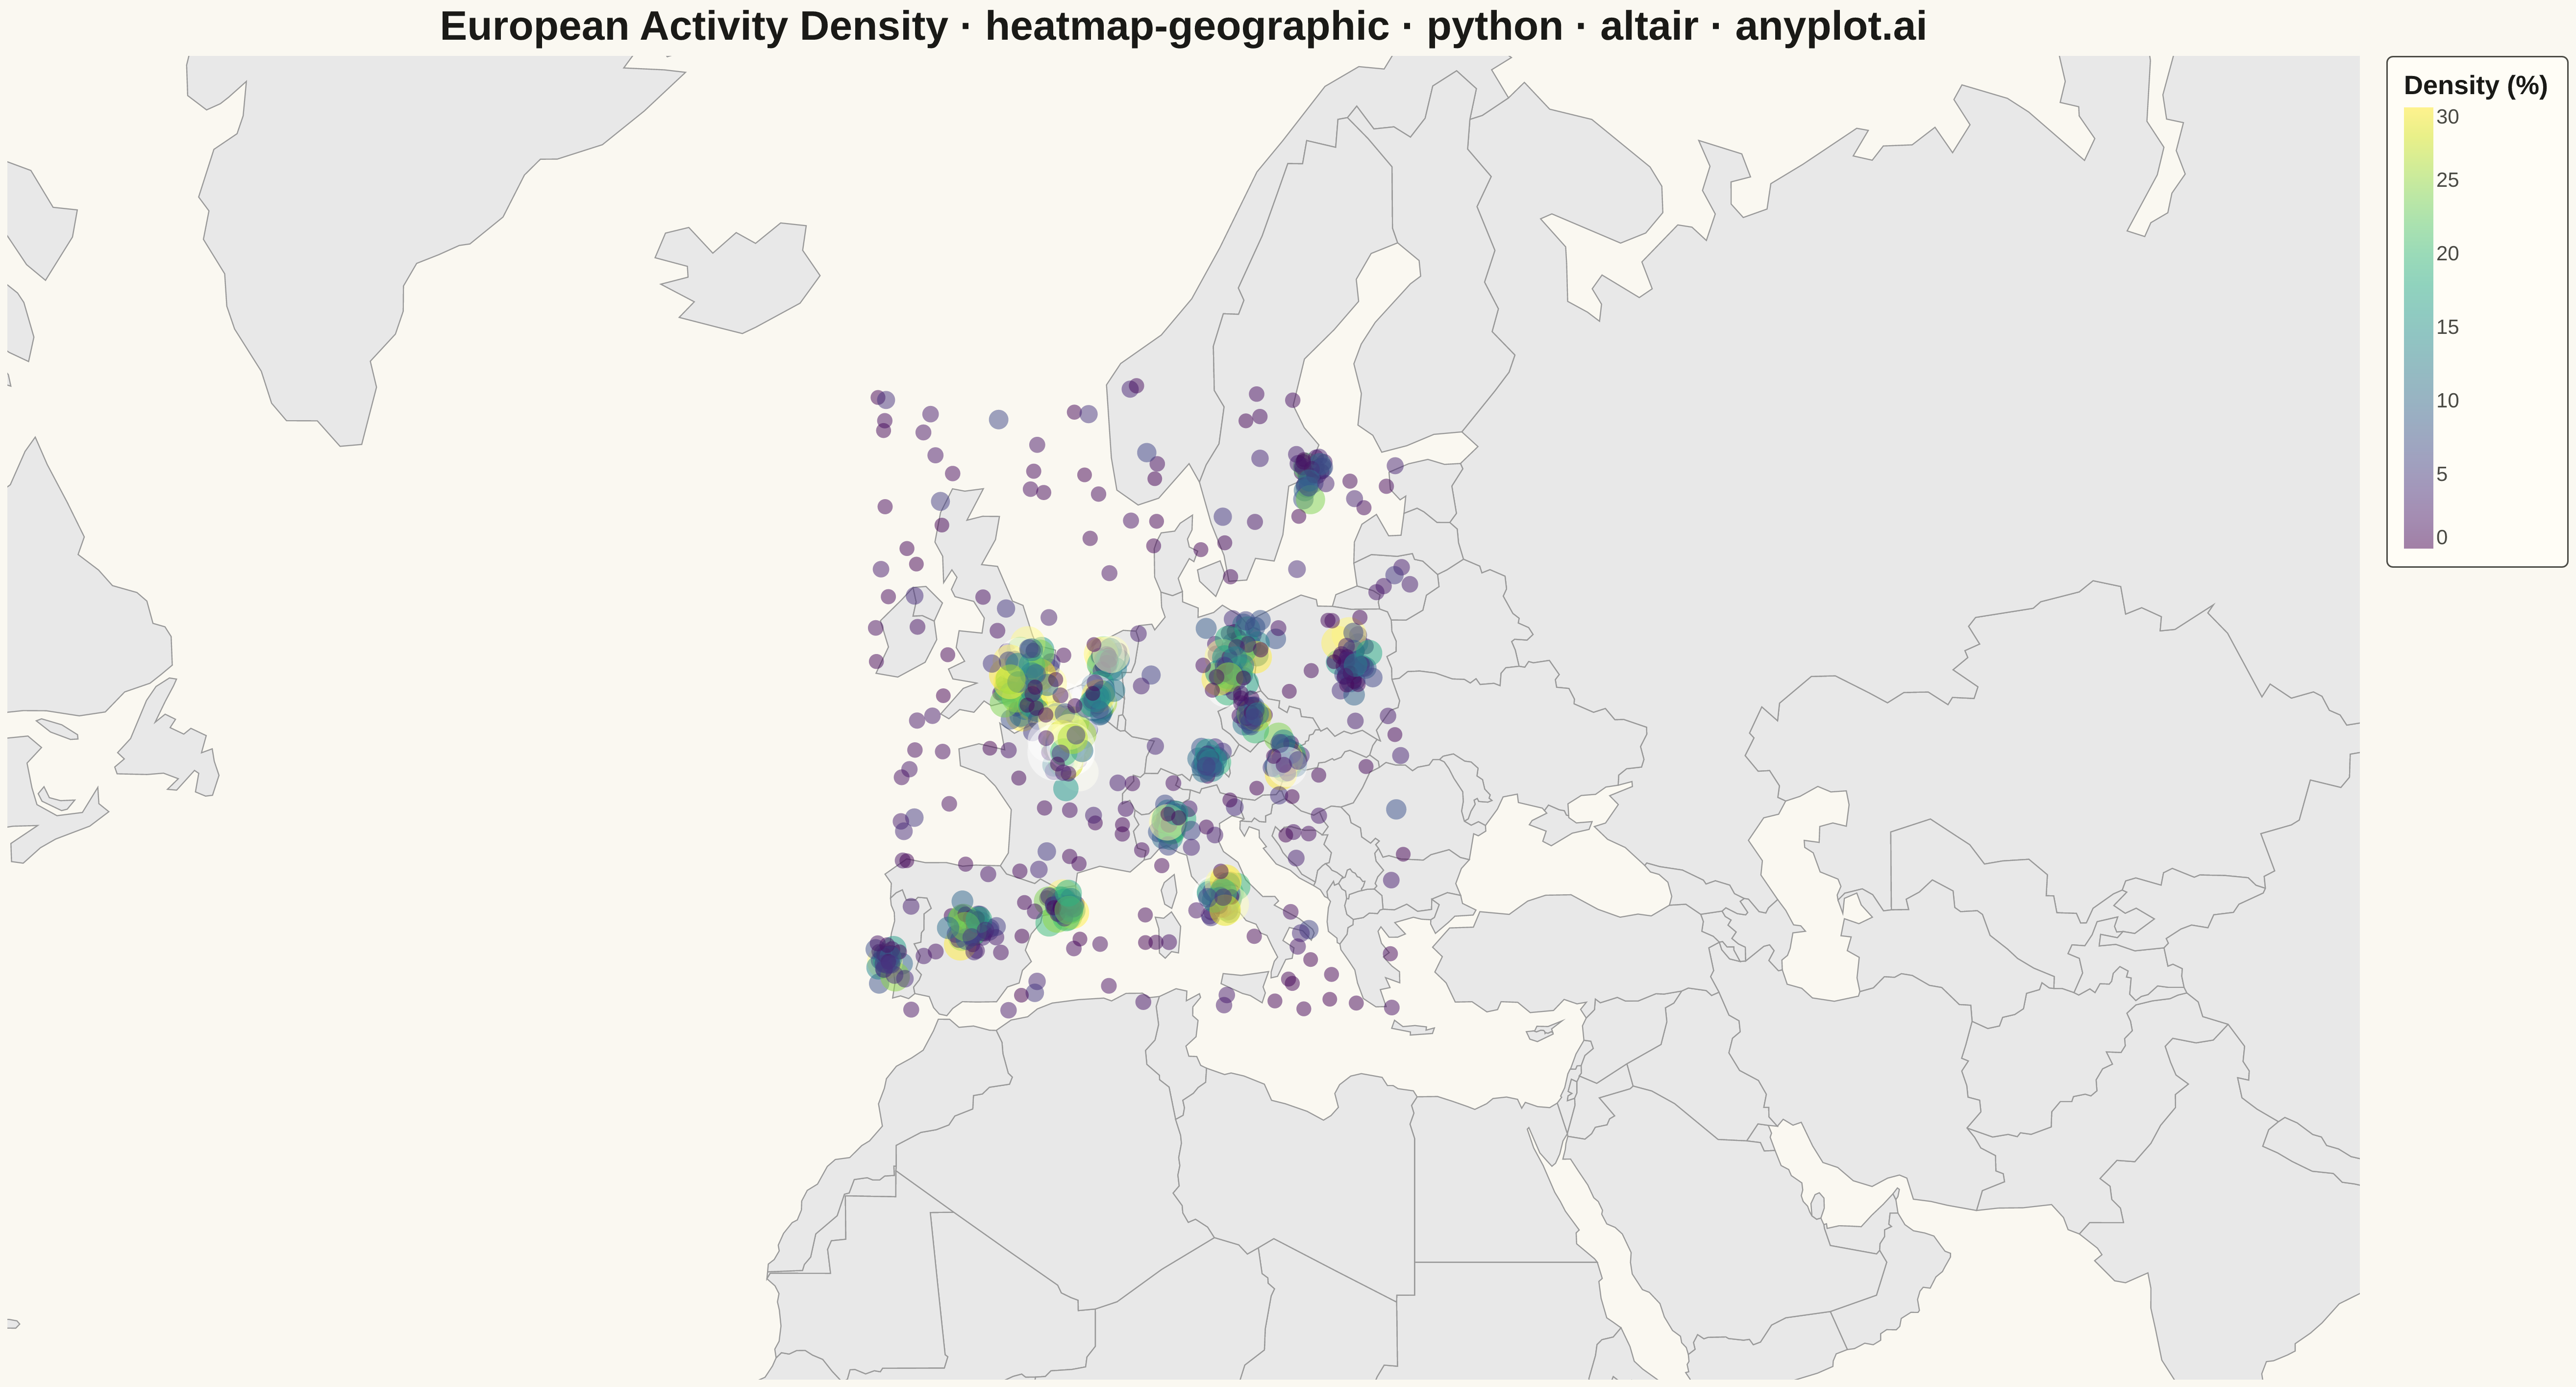
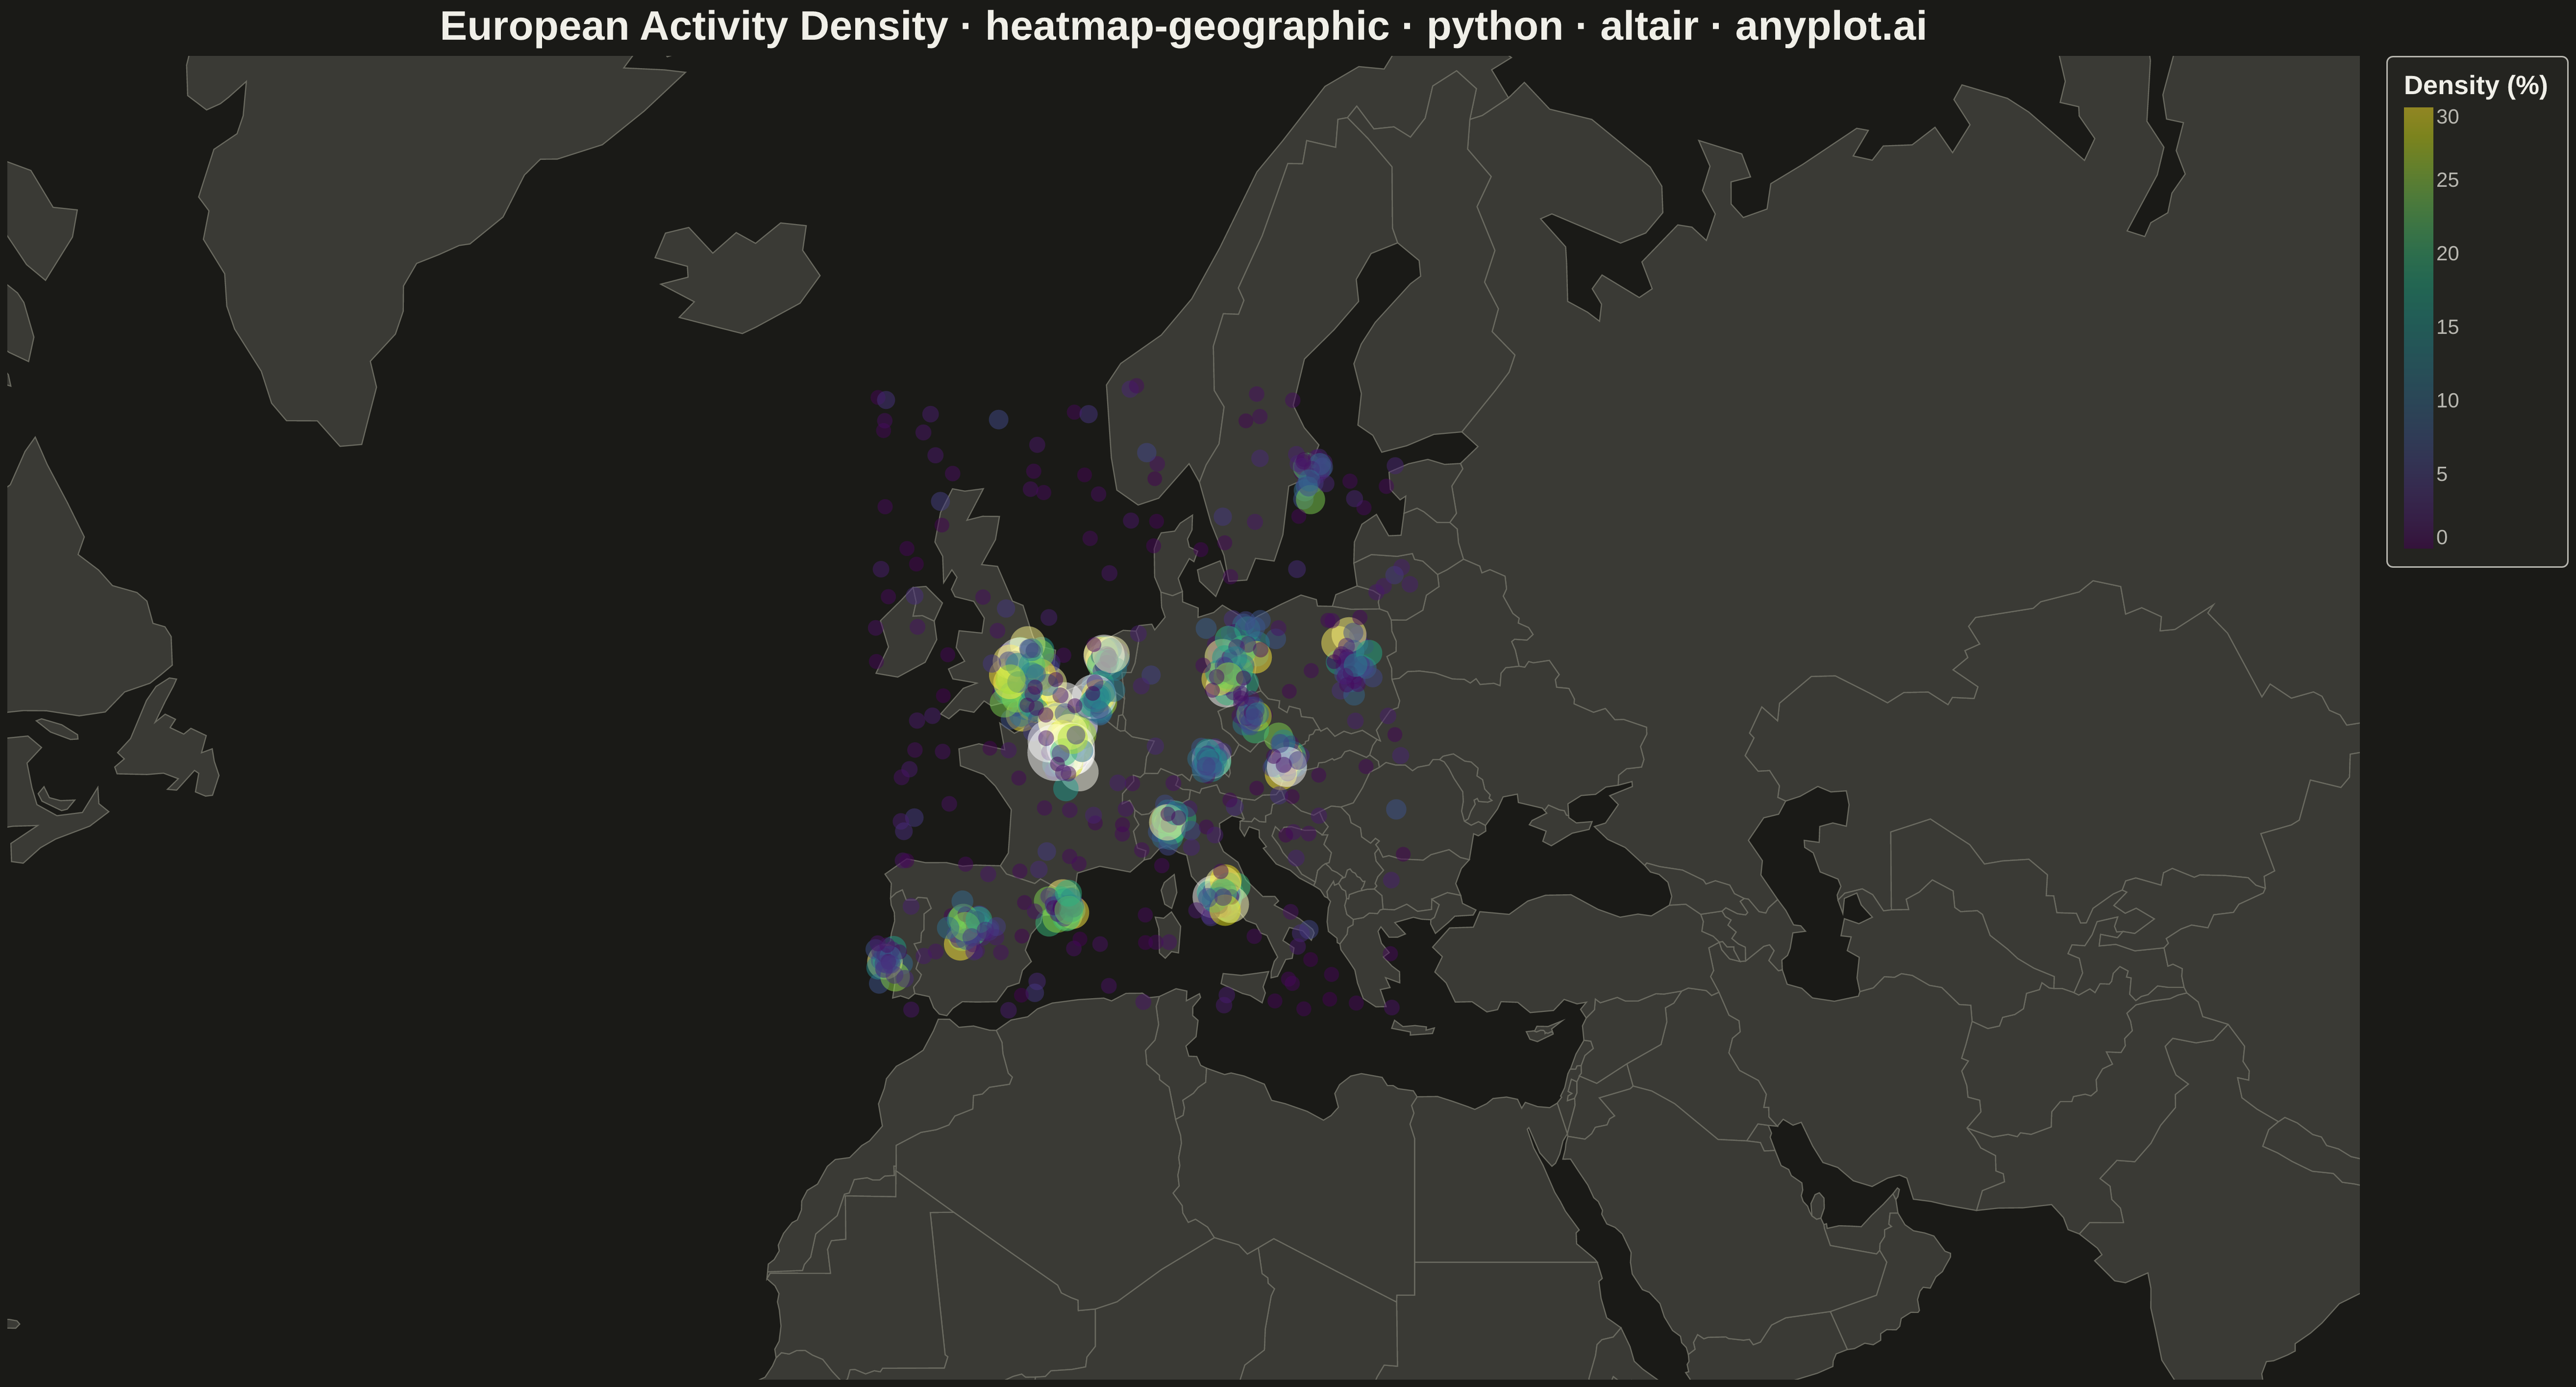
A geographic heatmap visualizes spatial density or intensity values across a map using continuous color gradients. Unlike choropleth maps that color discrete regions, this plot shows smooth density variations computed from point data or gridded values. The color intensity at each location represents the concentration or magnitude of the underlying data, making it ideal for identifying hotspots, clusters, and spatial patterns in geographic data.
""" anyplot.ai
heatmap-geographic: Geographic Heatmap for Spatial Density
Library: altair 6.1.0 | Python 3.13.13
Quality: 81/100 | Updated: 2026-05-19
"""

import os

import altair as alt
import numpy as np
import pandas as pd


# Theme tokens
THEME = os.getenv("ANYPLOT_THEME", "light")
PAGE_BG = "#FAF8F1" if THEME == "light" else "#1A1A17"
ELEVATED_BG = "#FFFDF6" if THEME == "light" else "#242420"
INK = "#1A1A17" if THEME == "light" else "#F0EFE8"
INK_SOFT = "#4A4A44" if THEME == "light" else "#B8B7B0"
LAND_FILL = "#e8e8e8" if THEME == "light" else "#3A3A35"
LAND_STROKE = "#999999" if THEME == "light" else "#6A6A60"

# Data - European cities with population-like density values
np.random.seed(42)

cities = [
    # (name, lat, lon, spread, n_points, weight_base)
    ("London", 51.5, -0.1, 0.8, 80, 1.5),
    ("Paris", 48.9, 2.3, 0.6, 70, 1.4),
    ("Berlin", 52.5, 13.4, 0.7, 55, 1.2),
    ("Madrid", 40.4, -3.7, 0.5, 50, 1.1),
    ("Rome", 41.9, 12.5, 0.4, 45, 1.0),
    ("Vienna", 48.2, 16.4, 0.4, 35, 0.9),
    ("Amsterdam", 52.4, 4.9, 0.3, 40, 1.0),
    ("Brussels", 50.8, 4.4, 0.3, 35, 0.9),
    ("Warsaw", 52.2, 21.0, 0.5, 40, 0.8),
    ("Prague", 50.1, 14.4, 0.3, 30, 0.8),
    ("Stockholm", 59.3, 18.1, 0.4, 30, 0.7),
    ("Munich", 48.1, 11.6, 0.3, 35, 0.9),
    ("Milan", 45.5, 9.2, 0.4, 40, 1.0),
    ("Barcelona", 41.4, 2.2, 0.4, 45, 1.0),
    ("Lisbon", 38.7, -9.1, 0.4, 30, 0.8),
]

data_rows = []
for _name, lat, lon, spread, n, weight in cities:
    lats = np.random.normal(lat, spread, n)
    lons = np.random.normal(lon, spread * 1.2, n)
    values = np.random.exponential(weight, n) * 10
    for i in range(n):
        data_rows.append({"latitude": lats[i], "longitude": lons[i], "value": values[i]})

# Add scattered rural points
n_rural = 200
rural_lats = np.random.uniform(36, 62, n_rural)
rural_lons = np.random.uniform(-10, 25, n_rural)
rural_values = np.random.exponential(0.3, n_rural) * 5
for i in range(n_rural):
    data_rows.append({"latitude": rural_lats[i], "longitude": rural_lons[i], "value": rural_values[i]})

df = pd.DataFrame(data_rows)

# Load world countries from natural earth (Vega datasets URL)
countries_url = "https://cdn.jsdelivr.net/npm/world-atlas@2/countries-110m.json"
countries = alt.topo_feature(countries_url, "countries")

# Basemap layer - theme-adaptive country fills
basemap = (
    alt.Chart(countries)
    .mark_geoshape(fill=LAND_FILL, stroke=LAND_STROKE, strokeWidth=0.8)
    .project(type="mercator", scale=600, center=[10, 50])
)

# Heatmap layer - overlapping circles with viridis colormap
heatmap_points = (
    alt.Chart(df)
    .mark_circle(opacity=0.5)
    .encode(
        longitude="longitude:Q",
        latitude="latitude:Q",
        size=alt.Size("value:Q", scale=alt.Scale(range=[100, 1500]), legend=None),
        color=alt.Color(
            "value:Q",
            scale=alt.Scale(scheme="viridis", domain=[0, 30]),
            legend=alt.Legend(
                title="Density (%)",
                titleFontSize=18,
                labelFontSize=14,
                gradientLength=300,
                gradientThickness=20,
                orient="right",
            ),
        ),
        tooltip=[
            alt.Tooltip("latitude:Q", format=".2f", title="Lat"),
            alt.Tooltip("longitude:Q", format=".2f", title="Lon"),
            alt.Tooltip("value:Q", format=".1f", title="Value"),
        ],
    )
    .project(type="mercator", scale=600, center=[10, 50])
)

# Combine layers with theme-adaptive chrome
chart = (
    alt.layer(basemap, heatmap_points)
    .properties(
        background=PAGE_BG,
        width=1600,
        height=900,
        title=alt.Title(
            "European Activity Density · heatmap-geographic · python · altair · anyplot.ai",
            fontSize=28,
            anchor="middle",
        ),
    )
    .configure_view(fill=PAGE_BG, strokeWidth=0)
    .configure_title(color=INK, fontSize=28)
    .configure_legend(
        fillColor=ELEVATED_BG,
        strokeColor=INK_SOFT,
        titleColor=INK,
        labelColor=INK_SOFT,
        titleFontSize=18,
        labelFontSize=14,
        padding=12,
        cornerRadius=4,
    )
)

# Save outputs
chart.save(f"plot-{THEME}.png", scale_factor=3.0)
chart.save(f"plot-{THEME}.html")
Runnable source as JSON, for any HTTP client: https://api.anyplot.ai/specs/heatmap-geographic/altair/code. Any spec id and library id listed in llms-full.txt fit the same URL shape; every URL below is complete and callable.
{
  "spec_id": "heatmap-geographic",
  "language": "python",
  "library": "altair",
  "page": "https://anyplot.ai/heatmap-geographic/python/altair",
  "hub": "https://anyplot.ai/heatmap-geographic",
  "code_json": "https://api.anyplot.ai/specs/heatmap-geographic/altair/code",
  "spec_json": "https://api.anyplot.ai/specs/heatmap-geographic",
  "render_light_png": "https://storage.googleapis.com/anyplot-images/plots/heatmap-geographic/python/altair/plot-light.png",
  "render_dark_png": "https://storage.googleapis.com/anyplot-images/plots/heatmap-geographic/python/altair/plot-dark.png",
  "interactive_light_html": "https://storage.googleapis.com/anyplot-images/plots/heatmap-geographic/python/altair/plot-light.html",
  "interactive_dark_html": "https://storage.googleapis.com/anyplot-images/plots/heatmap-geographic/python/altair/plot-dark.html",
  "quality_score": 81.0,
  "license": "MIT",
  "guide": "https://anyplot.ai/llms.txt"
}
Part of Geographic Heatmap for Spatial Density on anyplot.ai.