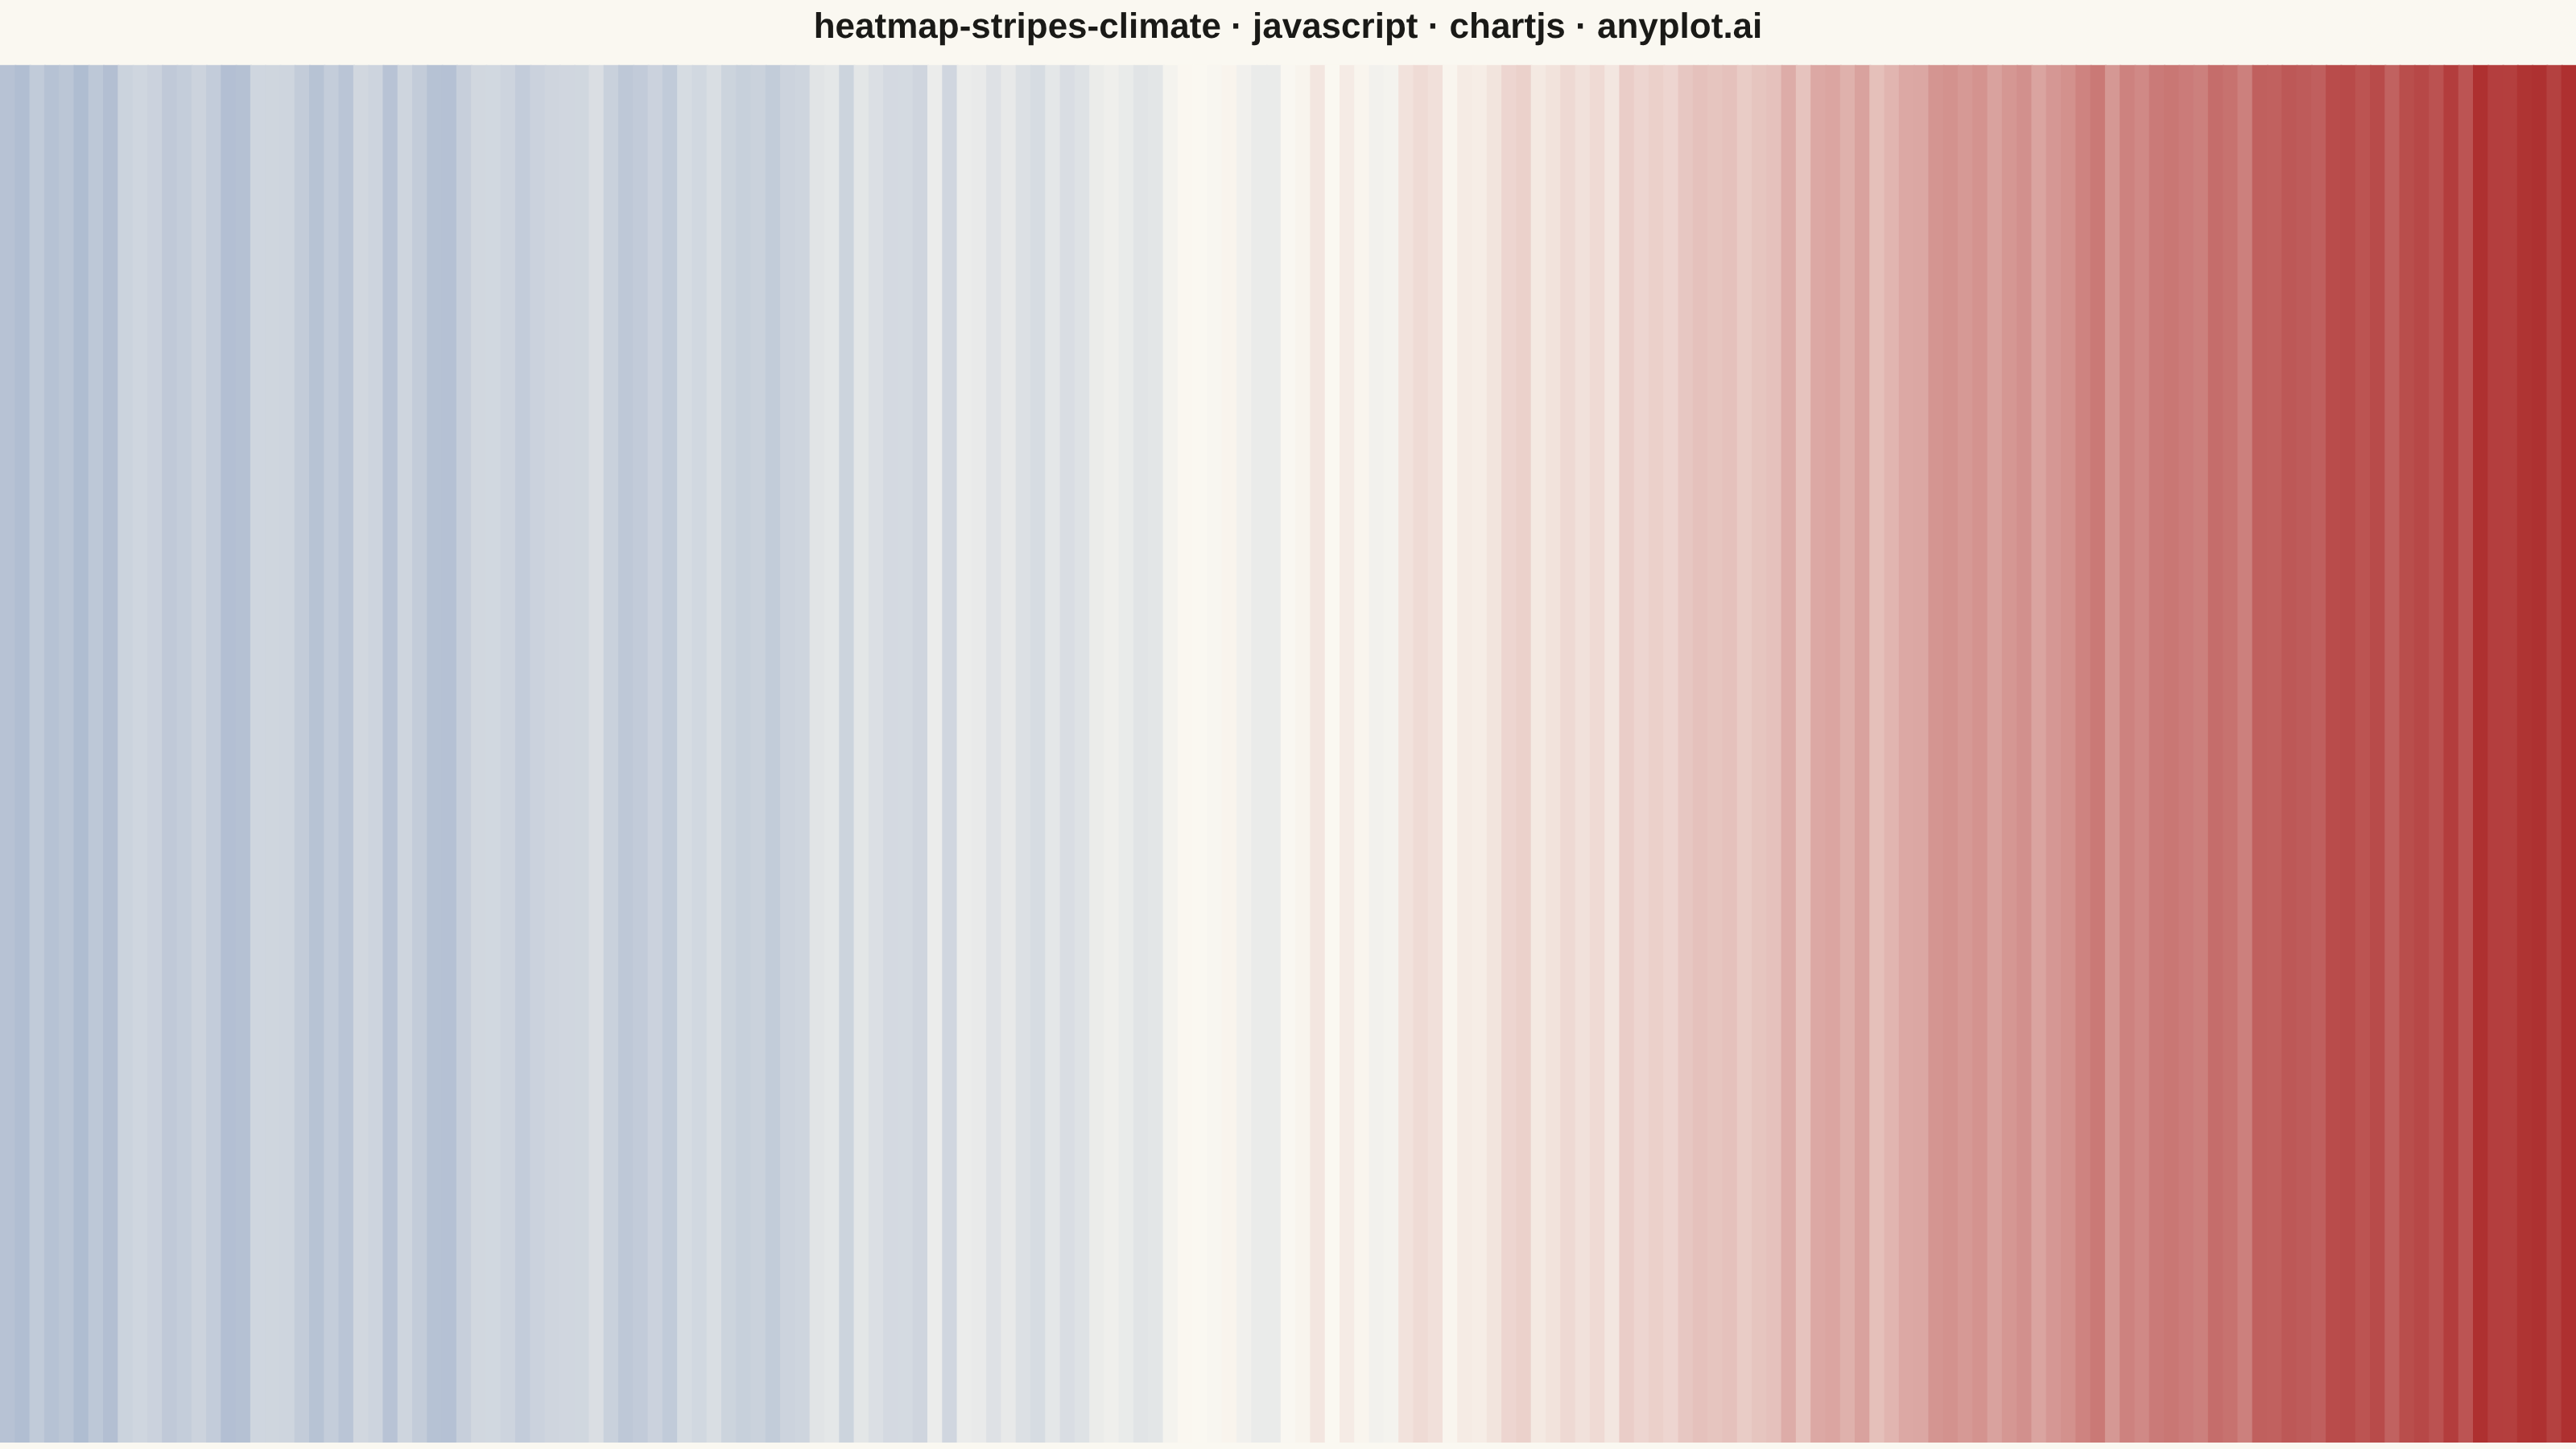
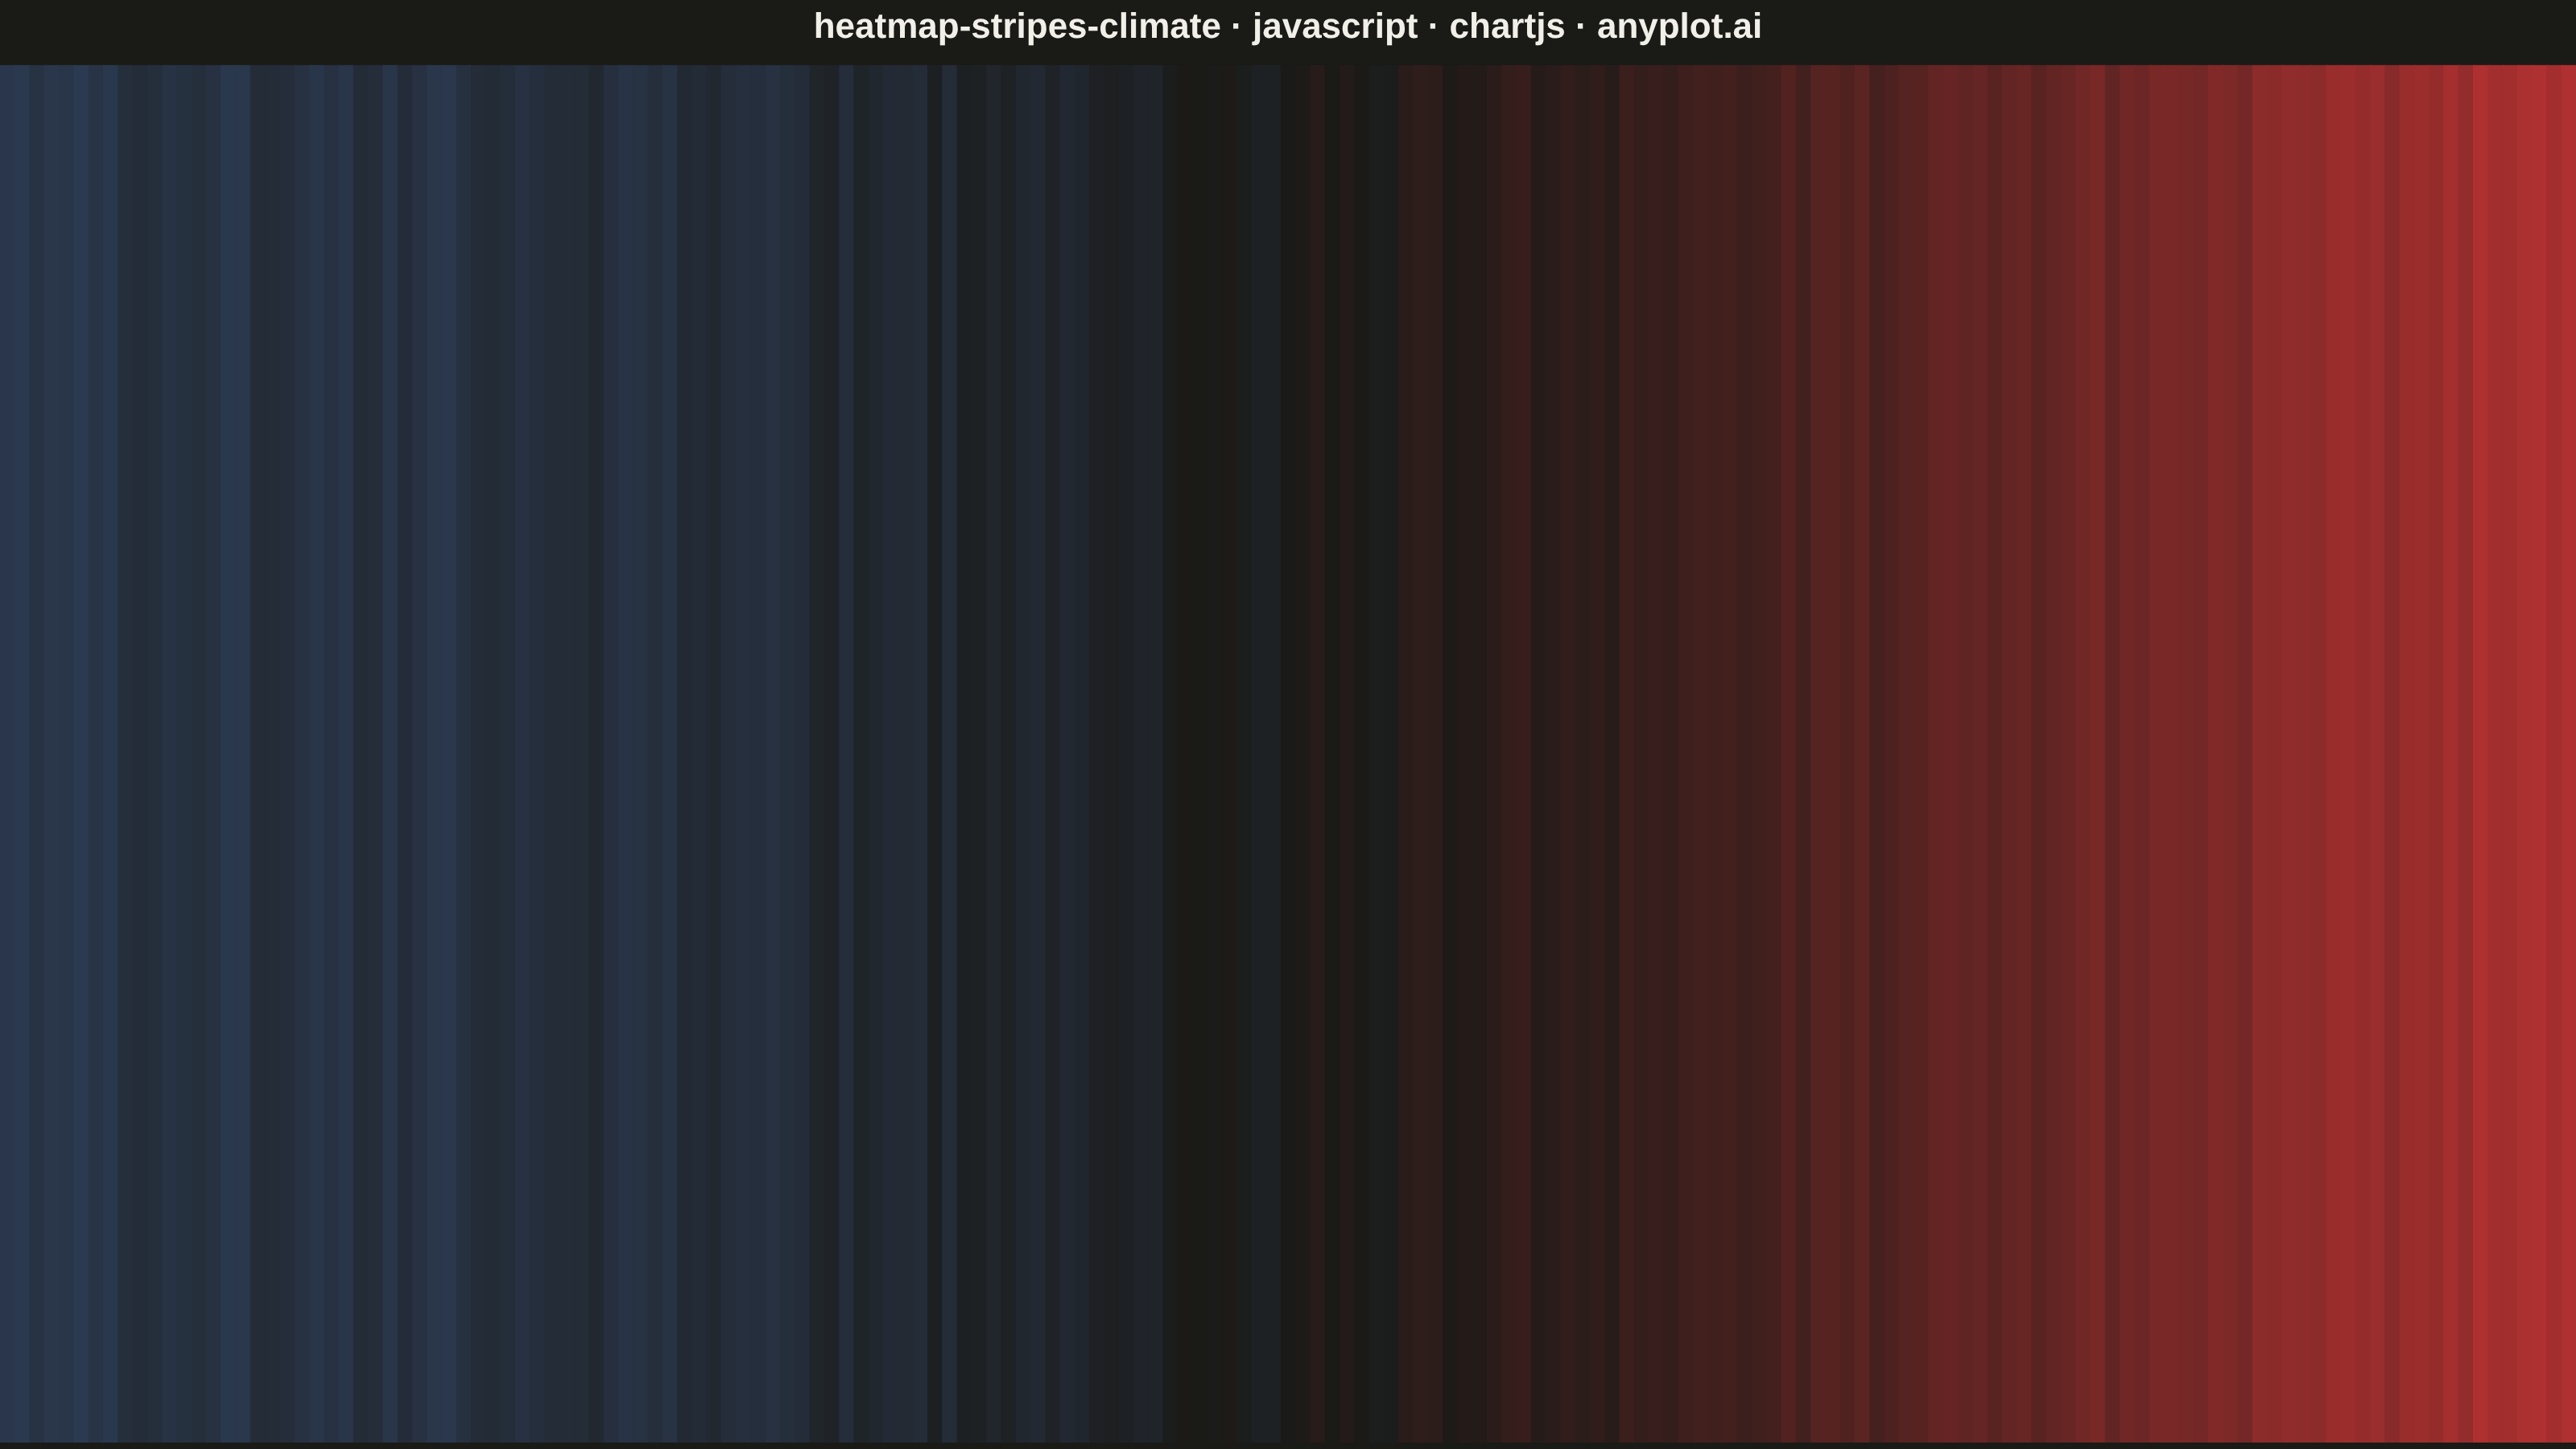
The same plot in 14 other libraries — JavaScript: D3.js, Apache ECharts, Highcharts, MUI X Charts; Python: Altair, Bokeh, lets-plot, Matplotlib, Plotly, plotnine, Pygal, Seaborn; R: ggplot2; Julia: Makie.jl. Compare all 15 side by side: Climate Warming Stripes in Python, R, Julia and JavaScript.
Climate warming stripes (also known as "warming stripes") display temperature anomaly data as a sequence of vertical colored bars, one per year, using a blue-to-red diverging colormap. Created by climate scientist Ed Hawkins, this minimalist visualization strips away axes, labels, and gridlines to communicate long-term warming trends through pure color encoding. The progression from cool blues to warm reds makes temperature change immediately visible at a glance.
// anyplot.ai
// heatmap-stripes-climate: Climate Warming Stripes
// Library: chartjs 4.4.7 | JavaScript 22.23.2
// Quality: 94/100 | Created: 2026-08-25

const t = window.ANYPLOT_TOKENS;

// --- Data (in-memory, deterministic) ----------------------------------------
// Synthetic global-mean temperature anomaly, °C relative to a 1961-1990
// baseline, 1850-2024 (175 years) — accelerating-warming shape matches the
// well-known HadCRUT / NASA GISS instrumental record without reproducing it.
const START_YEAR = 1850;
const END_YEAR = 2024;
const years = [];
for (let year = START_YEAR; year <= END_YEAR; year++) years.push(year);

function lcg(seed) {
  let state = seed >>> 0;
  return function random() {
    state = (state * 1664525 + 1013904223) >>> 0;
    return state / 4294967296;
  };
}
const random = lcg(42);

const anomalies = years.map((year) => {
  const progress = (year - START_YEAR) / (END_YEAR - START_YEAR);
  const trend = -0.4 + 1.65 * Math.pow(progress, 2.1);
  const noise = (random() - 0.5) * 0.22;
  return trend + noise;
});
const maxAbsAnomaly = Math.max(...anomalies.map(Math.abs));

// --- Diverging color scale (imprint_div, symmetric around zero) ------------
function lerpColor(hexA, hexB, fraction) {
  const a = parseInt(hexA.slice(1), 16);
  const b = parseInt(hexB.slice(1), 16);
  const channel = (shift) => {
    const ca = (a >> shift) & 255;
    const cb = (b >> shift) & 255;
    return Math.round(ca + (cb - ca) * fraction);
  };
  return `rgb(${channel(16)}, ${channel(8)}, ${channel(0)})`;
}
const [warmStop, midStop, coolStop] = t.div; // ["#AE3030", pageBg, "#4467A3"]
function anomalyColor(anomaly) {
  const fraction = Math.max(-1, Math.min(1, anomaly / maxAbsAnomaly));
  return fraction >= 0
    ? lerpColor(midStop, warmStop, fraction)
    : lerpColor(midStop, coolStop, -fraction);
}
const stripeColors = anomalies.map(anomalyColor);

// --- Stripes plugin: draws the stripes via a direct chartjs draw hook ------
// Chart.js's plugin system — a registered object with lifecycle hooks (here
// beforeDatasetsDraw) that gets direct 2D-context access to chart.ctx and
// chart.chartArea — is a chartjs-distinctive extensibility mechanism, unlike
// the generic bar-gap-removal trick any bar-capable library can replicate.
const stripesPlugin = {
  id: "stripes",
  beforeDatasetsDraw(chart) {
    const { ctx, chartArea } = chart;
    const { left, right, top, bottom } = chartArea;
    const stripeWidth = (right - left) / stripeColors.length;
    ctx.save();
    stripeColors.forEach((color, i) => {
      ctx.fillStyle = color;
      ctx.fillRect(left + i * stripeWidth, top, stripeWidth + 1, bottom - top);
    });
    ctx.restore();
  },
};
Chart.register(stripesPlugin);

// --- Mount -------------------------------------------------------------------
const canvas = document.createElement("canvas");
document.getElementById("container").appendChild(canvas);

// --- Chart ---------------------------------------------------------------
new Chart(canvas, {
  type: "bar",
  data: {
    labels: years.map(String),
    datasets: [
      {
        data: years.map(() => 1),
        backgroundColor: "rgba(0, 0, 0, 0)",
        borderWidth: 0,
        categoryPercentage: 1.0,
        barPercentage: 1.0,
      },
    ],
  },
  options: {
    responsive: true,
    maintainAspectRatio: false,
    animation: false,
    layout: { padding: { top: 4, bottom: 4, left: 0, right: 0 } },
    plugins: {
      title: {
        display: true,
        text: "heatmap-stripes-climate · javascript · chartjs · anyplot.ai",
        color: t.ink,
        font: { size: 22 },
        padding: { bottom: 10 },
      },
      legend: { display: false },
      tooltip: {
        callbacks: {
          title: (items) => `Year ${years[items[0].dataIndex]}`,
          label: (item) => `Anomaly: ${anomalies[item.dataIndex].toFixed(2)}°C`,
        },
      },
    },
    scales: {
      x: { display: false, grid: { display: false } },
      y: { display: false, grid: { display: false }, min: 0, max: 1 },
    },
  },
});
Runnable source as JSON, for any HTTP client: https://api.anyplot.ai/specs/heatmap-stripes-climate/chartjs/code. Any spec id and library id listed in llms-full.txt fit the same URL shape; every URL below is complete and callable.
{
  "spec_id": "heatmap-stripes-climate",
  "language": "javascript",
  "library": "chartjs",
  "page": "https://anyplot.ai/heatmap-stripes-climate/javascript/chartjs",
  "hub": "https://anyplot.ai/heatmap-stripes-climate",
  "code_json": "https://api.anyplot.ai/specs/heatmap-stripes-climate/chartjs/code",
  "spec_json": "https://api.anyplot.ai/specs/heatmap-stripes-climate",
  "render_light_png": "https://storage.googleapis.com/anyplot-images/plots/heatmap-stripes-climate/javascript/chartjs/plot-light.png",
  "render_dark_png": "https://storage.googleapis.com/anyplot-images/plots/heatmap-stripes-climate/javascript/chartjs/plot-dark.png",
  "interactive_light_html": "https://storage.googleapis.com/anyplot-images/plots/heatmap-stripes-climate/javascript/chartjs/plot-light.html",
  "interactive_dark_html": "https://storage.googleapis.com/anyplot-images/plots/heatmap-stripes-climate/javascript/chartjs/plot-dark.html",
  "quality_score": 94.0,
  "license": "MIT",
  "guide": "https://anyplot.ai/llms.txt"
}
Part of Climate Warming Stripes on anyplot.ai.