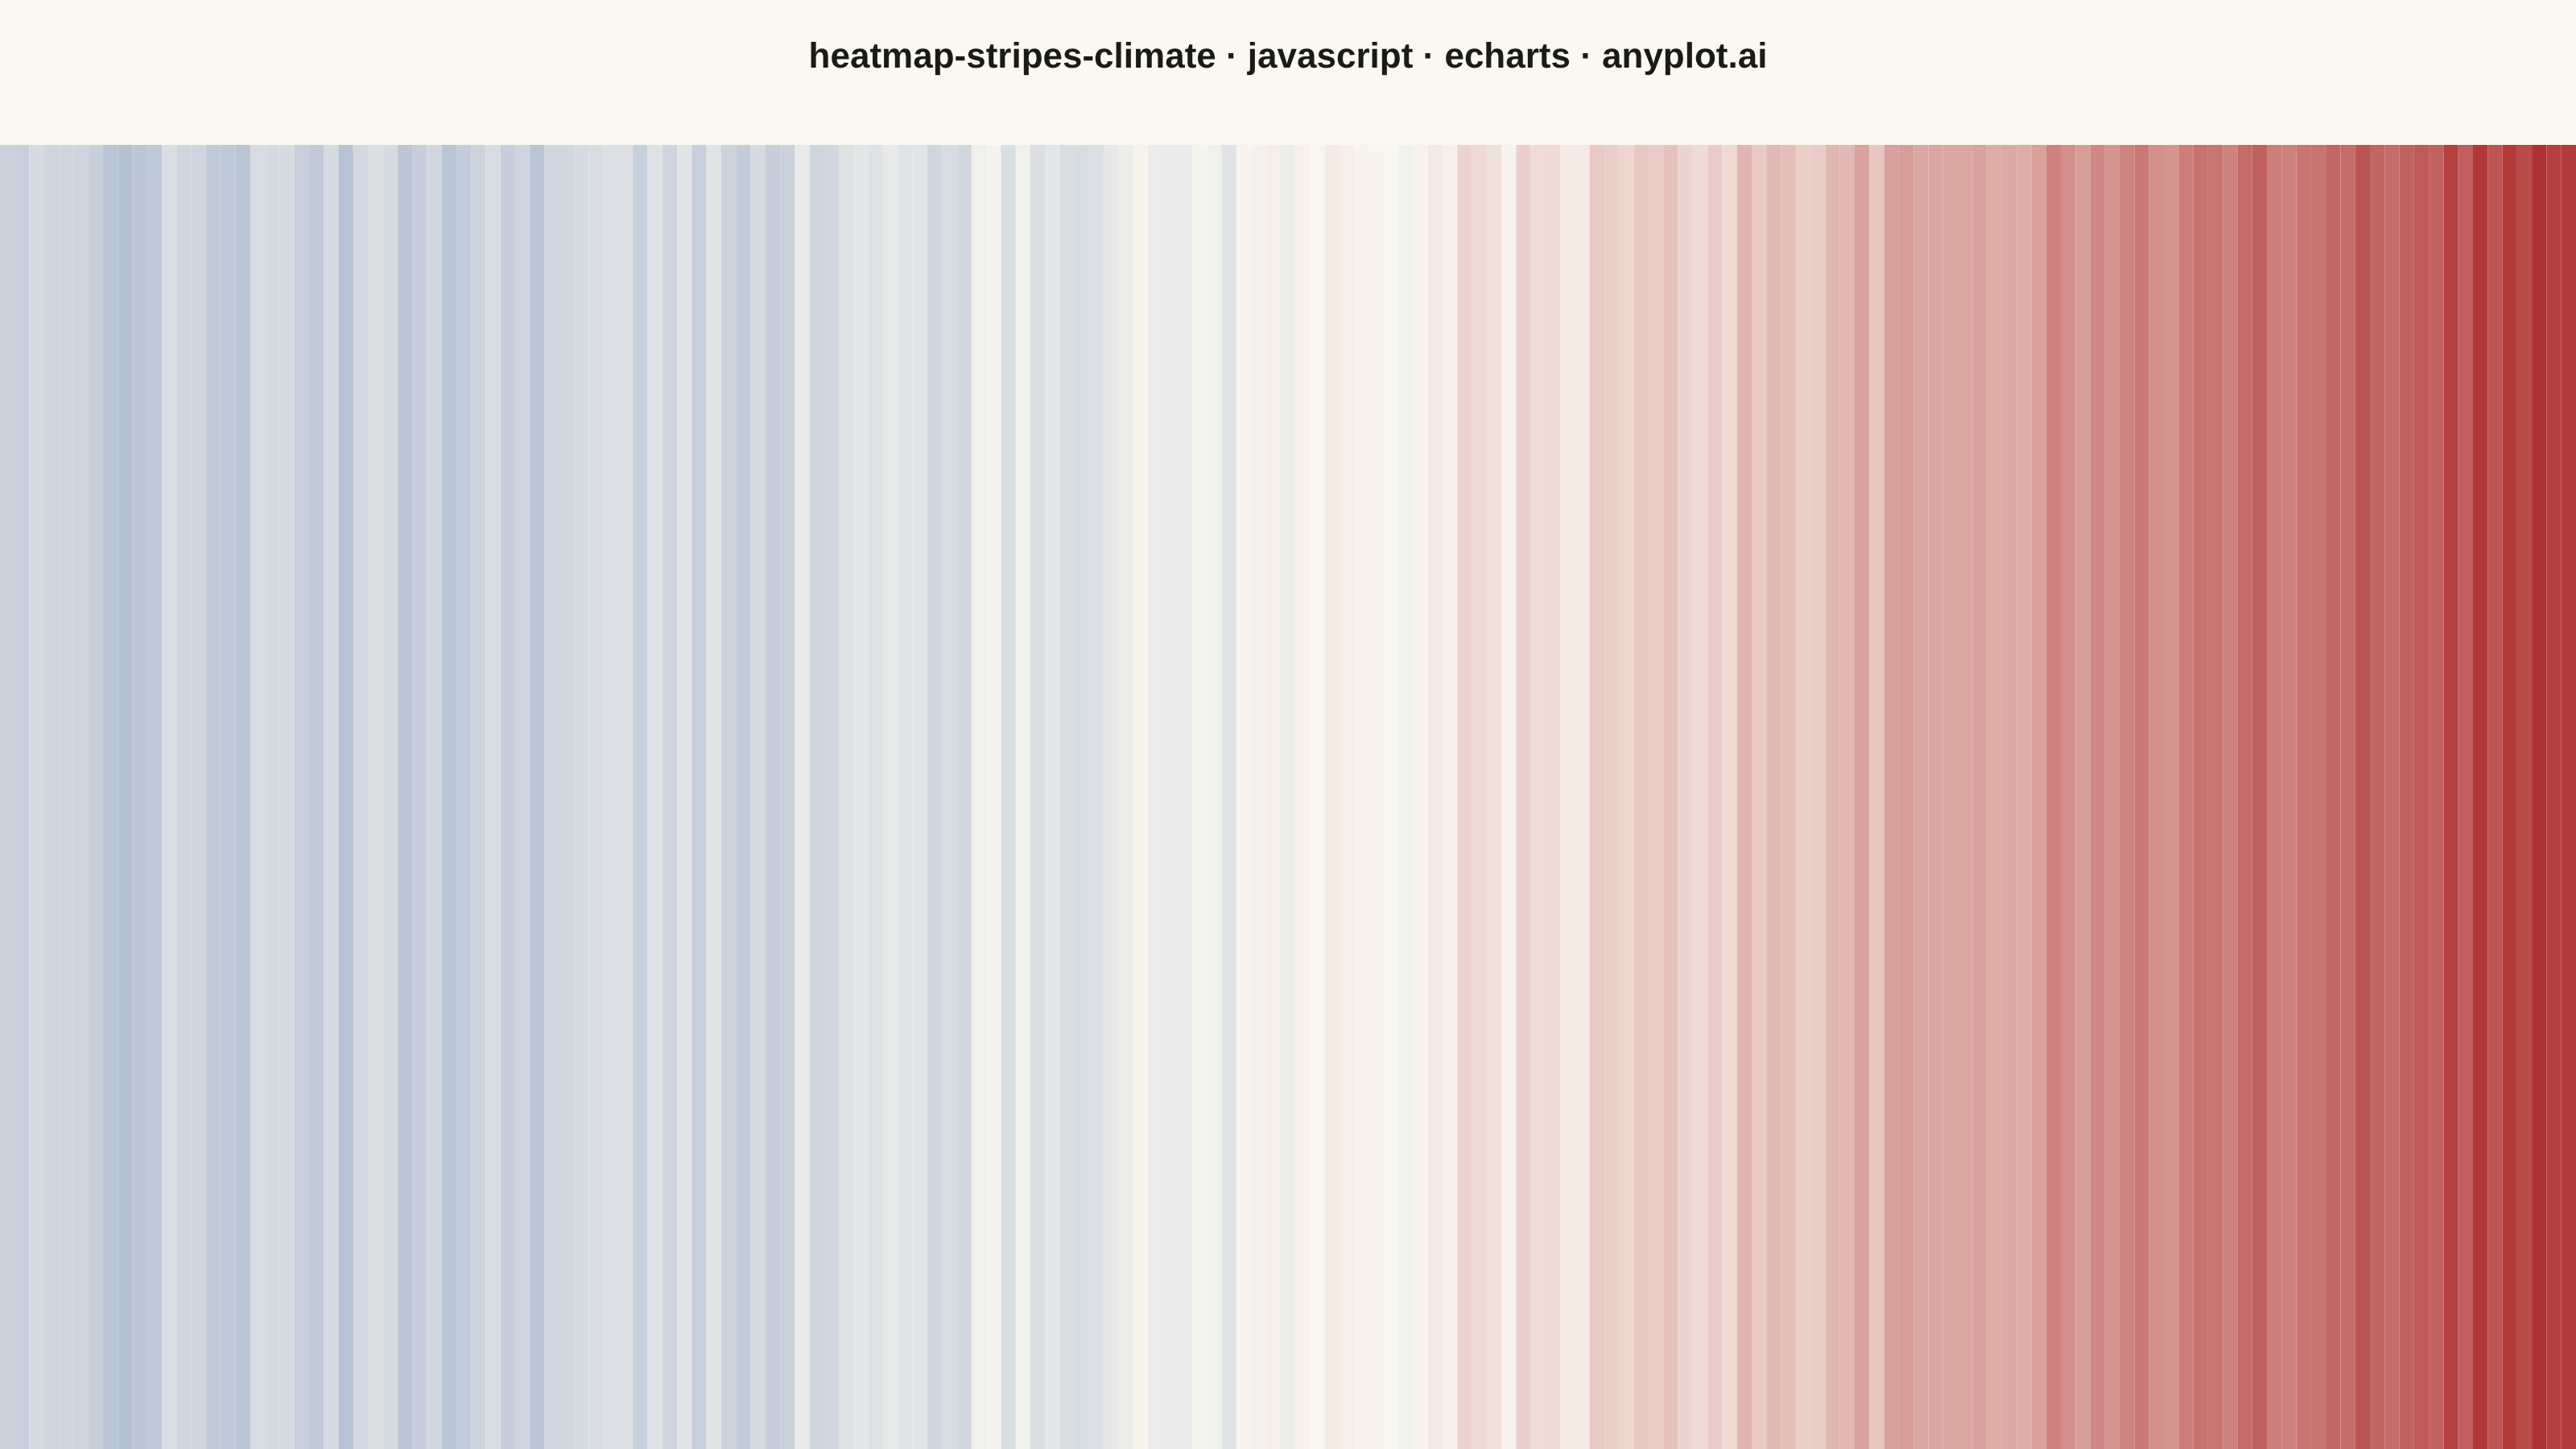
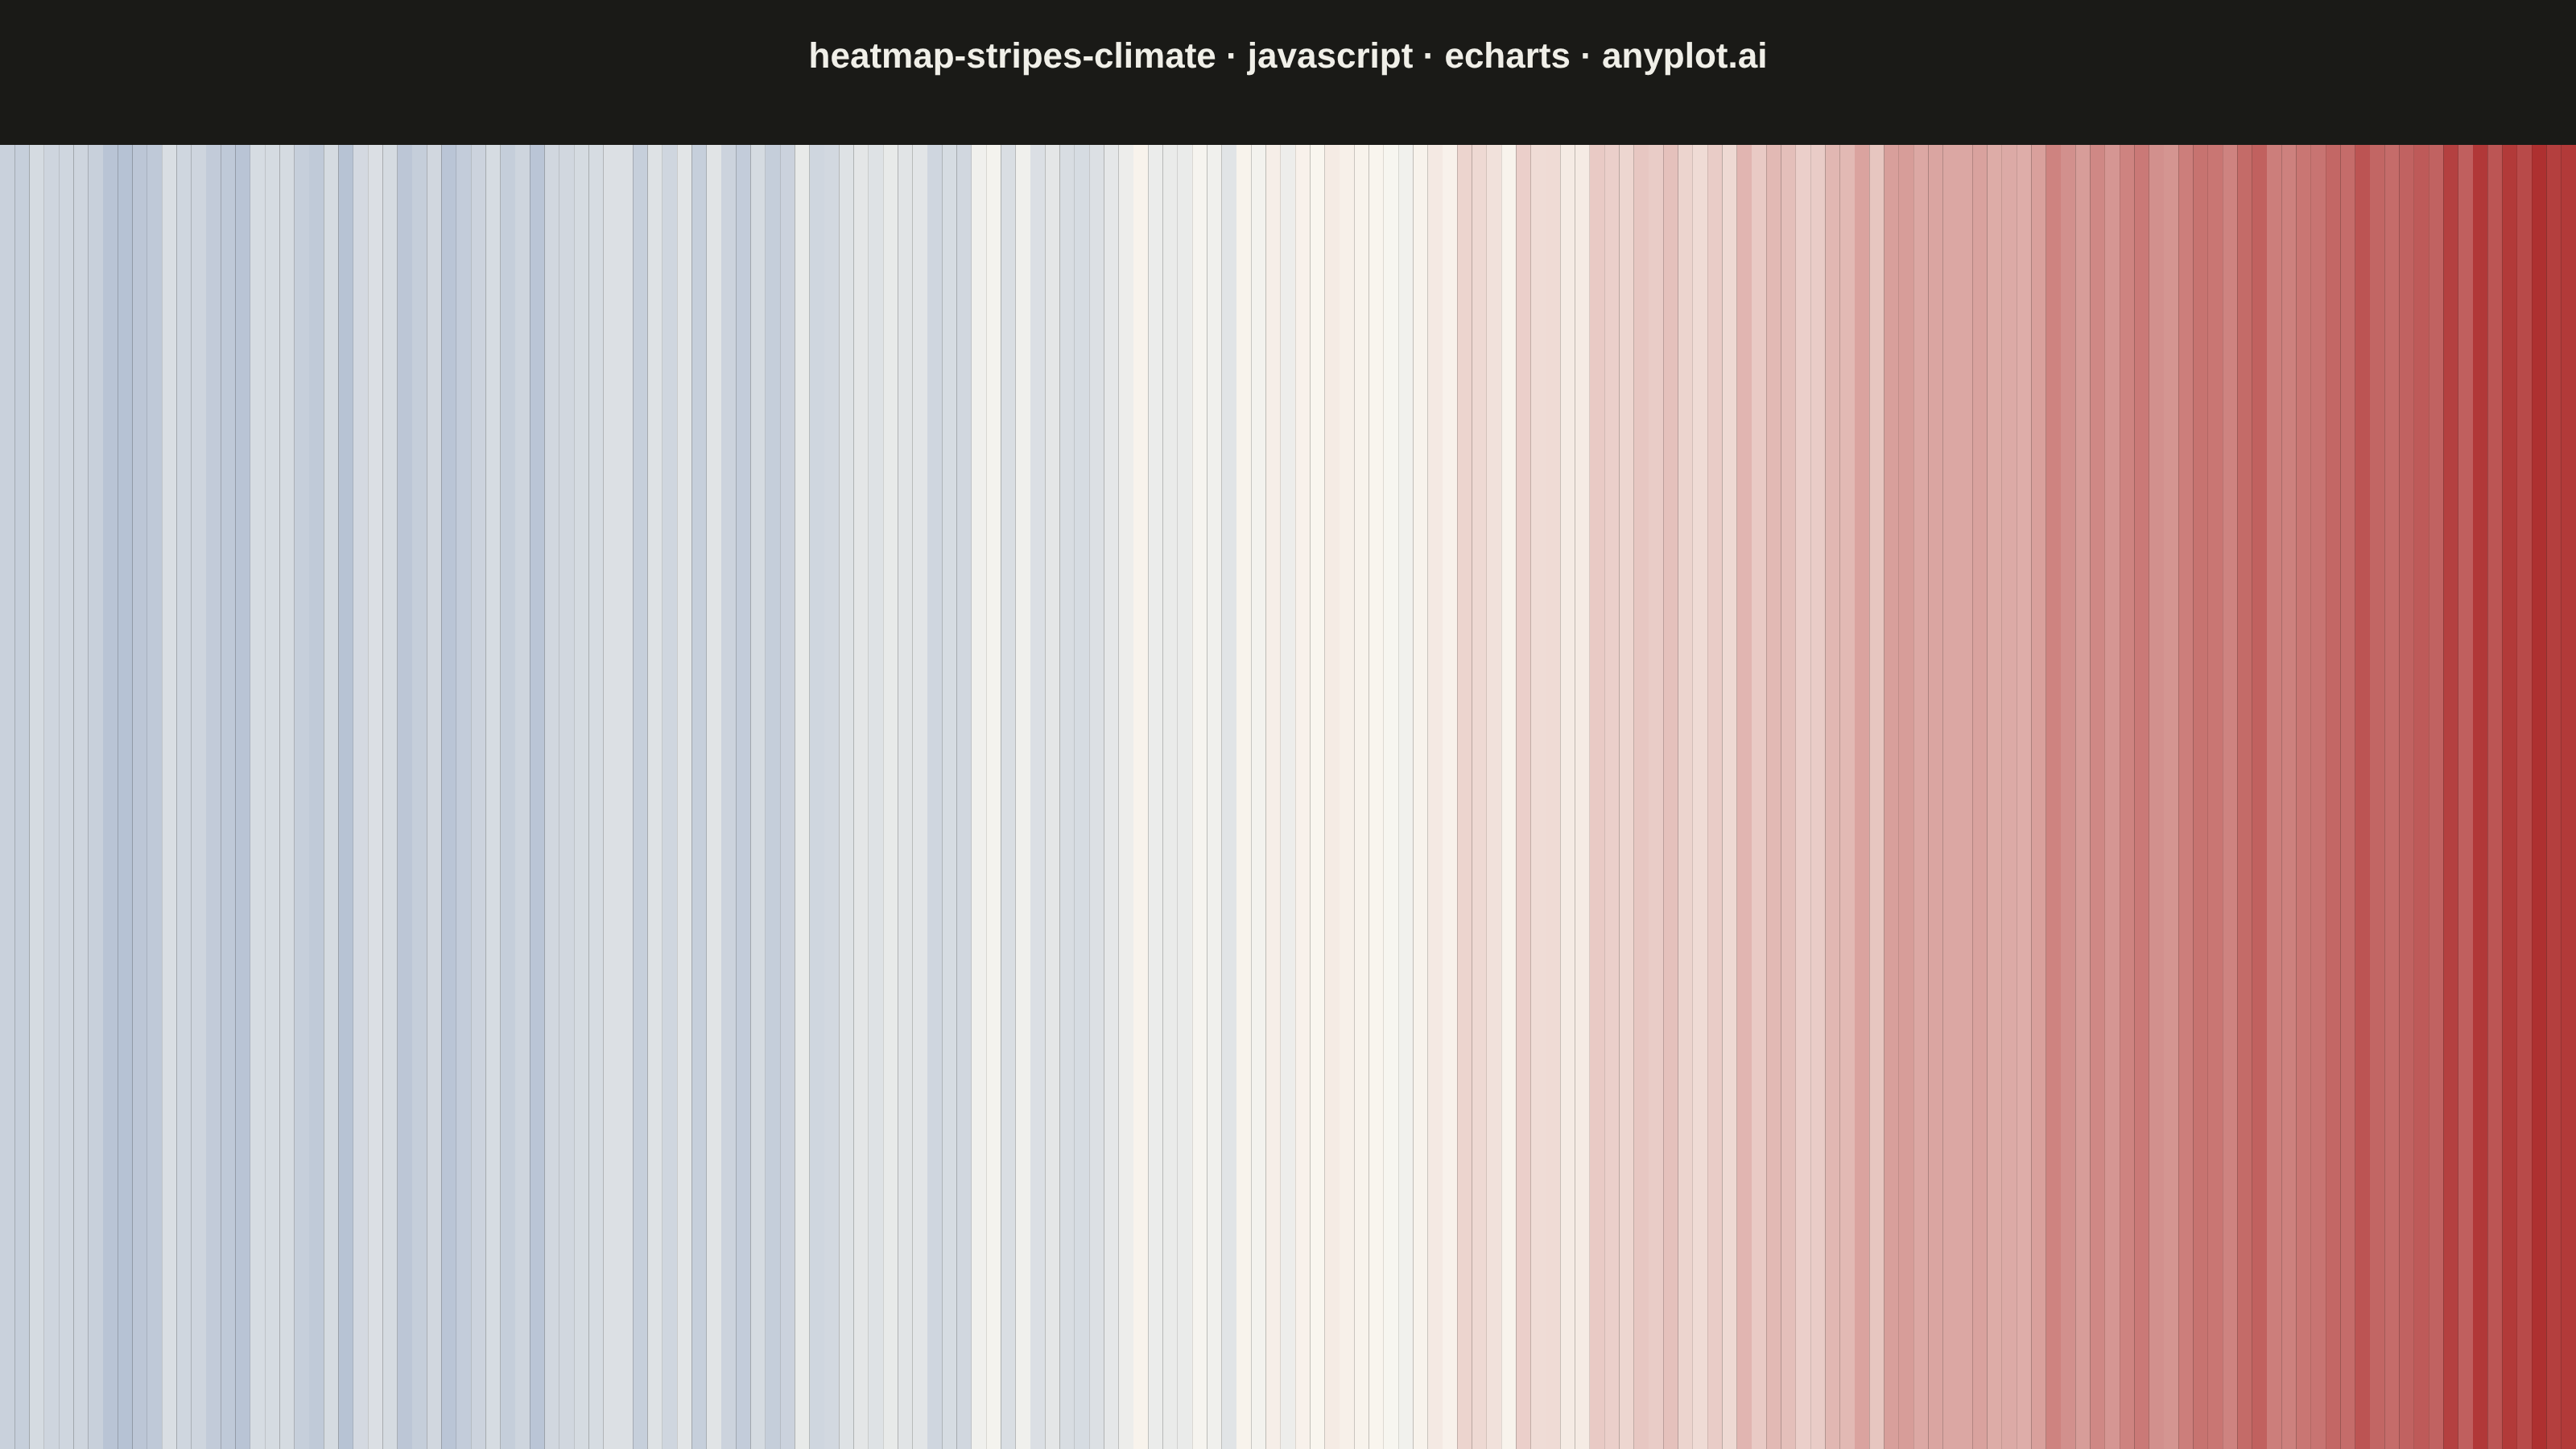
The same plot in 14 other libraries — JavaScript: Chart.js, D3.js, Highcharts, MUI X Charts; Python: Altair, Bokeh, lets-plot, Matplotlib, Plotly, plotnine, Pygal, Seaborn; R: ggplot2; Julia: Makie.jl. Compare all 15 side by side: Climate Warming Stripes in Python, R, Julia and JavaScript.
Climate warming stripes (also known as "warming stripes") display temperature anomaly data as a sequence of vertical colored bars, one per year, using a blue-to-red diverging colormap. Created by climate scientist Ed Hawkins, this minimalist visualization strips away axes, labels, and gridlines to communicate long-term warming trends through pure color encoding. The progression from cool blues to warm reds makes temperature change immediately visible at a glance.
// anyplot.ai
// heatmap-stripes-climate: Climate Warming Stripes
// Library: echarts 6.1.0 | JavaScript 22.23.2
// Quality: 87/100 | Created: 2026-08-25

const t = window.ANYPLOT_TOKENS;

// --- Data (in-memory, deterministic) ----------------------------------------
// Deterministic LCG so the trend + noise are reproducible without a browser RNG.
function lcg(seed) {
  let state = seed;
  return function () {
    state = (state * 1103515245 + 12345) & 0x7fffffff;
    return state / 0x7fffffff;
  };
}
const rand = lcg(42);

const startYear = 1850;
const endYear = 2024;
const years = [];
const anomalies = [];
for (let year = startYear; year <= endYear; year++) {
  const progress = (year - startYear) / (endYear - startYear);
  // Cool, flat pre-industrial baseline that accelerates into a modern warm tail.
  const trend = -0.35 + 1.55 * Math.pow(progress, 2.2);
  const noise = (rand() - 0.5) * 0.25;
  years.push(year);
  anomalies.push(Math.round((trend + noise) * 100) / 100);
}

// Symmetric domain around zero so equal +/- anomalies get equal color intensity.
const maxAbsAnomaly = Math.max(...anomalies.map((a) => Math.abs(a)));

// --- Diverging color ramp (Imprint imprint_div, cold -> mid -> warm) --------
function hexToRgb(hex) {
  const n = parseInt(hex.slice(1), 16);
  return [(n >> 16) & 255, (n >> 8) & 255, n & 255];
}
function rgbToHex(rgb) {
  return (
    "#" +
    rgb
      .map((v) => Math.max(0, Math.min(255, Math.round(v))).toString(16).padStart(2, "0"))
      .join("")
  );
}
function lerpColor(hexA, hexB, ratio) {
  const a = hexToRgb(hexA);
  const b = hexToRgb(hexB);
  return rgbToHex([
    a[0] + (b[0] - a[0]) * ratio,
    a[1] + (b[1] - a[1]) * ratio,
    a[2] + (b[2] - a[2]) * ratio,
  ]);
}

// t.div = [matte-red, midpoint, blue] (imprint_div); reorder cold -> warm for temperature.
const coldColor = t.div[2];
const warmColor = t.div[0];
// Fixed pale-neutral midpoint (not t.div[1]): the bars fill the entire canvas
// with no gaps, so a theme-adaptive midpoint would match the dark background
// exactly and vanish. A constant off-white keeps the near-zero band visible
// in both themes while staying identical across renders.
const midColor = "#FAF8F1";

function colorForAnomaly(anomaly) {
  const norm = Math.max(-1, Math.min(1, anomaly / maxAbsAnomaly));
  return norm < 0 ? lerpColor(midColor, coldColor, -norm) : lerpColor(midColor, warmColor, norm);
}

const stripeData = years.map((year, i) => ({
  value: 1,
  itemStyle: { color: colorForAnomaly(anomalies[i]) },
  year,
  anomaly: anomalies[i],
}));

// --- Init --------------------------------------------------------------------
const chart = echarts.init(document.getElementById("container"));

// --- Option -------------------------------------------------------------------
chart.setOption({
  animation: false,
  backgroundColor: "transparent",
  title: {
    text: "heatmap-stripes-climate · javascript · echarts · anyplot.ai",
    left: "center",
    top: 20,
    textStyle: { color: t.ink, fontSize: 22 },
  },
  grid: { left: 0, right: 0, top: 90, bottom: 0 },
  xAxis: {
    type: "category",
    data: years.map(String),
    show: false,
  },
  yAxis: {
    type: "value",
    min: 0,
    max: 1,
    show: false,
  },
  tooltip: {
    trigger: "item",
    backgroundColor: t.elevatedBg,
    borderColor: t.grid,
    textStyle: { color: t.ink },
    formatter: (params) => {
      const anomaly = params.data.anomaly;
      const sign = anomaly >= 0 ? "+" : "";
      return `${params.data.year}: ${sign}${anomaly.toFixed(2)}°C`;
    },
  },
  series: [
    {
      type: "bar",
      data: stripeData,
      barCategoryGap: "0%",
      barWidth: "100%",
    },
  ],
});
Runnable source as JSON, for any HTTP client: https://api.anyplot.ai/specs/heatmap-stripes-climate/echarts/code. Any spec id and library id listed in llms-full.txt fit the same URL shape; every URL below is complete and callable.
{
  "spec_id": "heatmap-stripes-climate",
  "language": "javascript",
  "library": "echarts",
  "page": "https://anyplot.ai/heatmap-stripes-climate/javascript/echarts",
  "hub": "https://anyplot.ai/heatmap-stripes-climate",
  "code_json": "https://api.anyplot.ai/specs/heatmap-stripes-climate/echarts/code",
  "spec_json": "https://api.anyplot.ai/specs/heatmap-stripes-climate",
  "render_light_png": "https://storage.googleapis.com/anyplot-images/plots/heatmap-stripes-climate/javascript/echarts/plot-light.png",
  "render_dark_png": "https://storage.googleapis.com/anyplot-images/plots/heatmap-stripes-climate/javascript/echarts/plot-dark.png",
  "interactive_light_html": "https://storage.googleapis.com/anyplot-images/plots/heatmap-stripes-climate/javascript/echarts/plot-light.html",
  "interactive_dark_html": "https://storage.googleapis.com/anyplot-images/plots/heatmap-stripes-climate/javascript/echarts/plot-dark.html",
  "quality_score": 87.0,
  "license": "MIT",
  "guide": "https://anyplot.ai/llms.txt"
}
Part of Climate Warming Stripes on anyplot.ai.