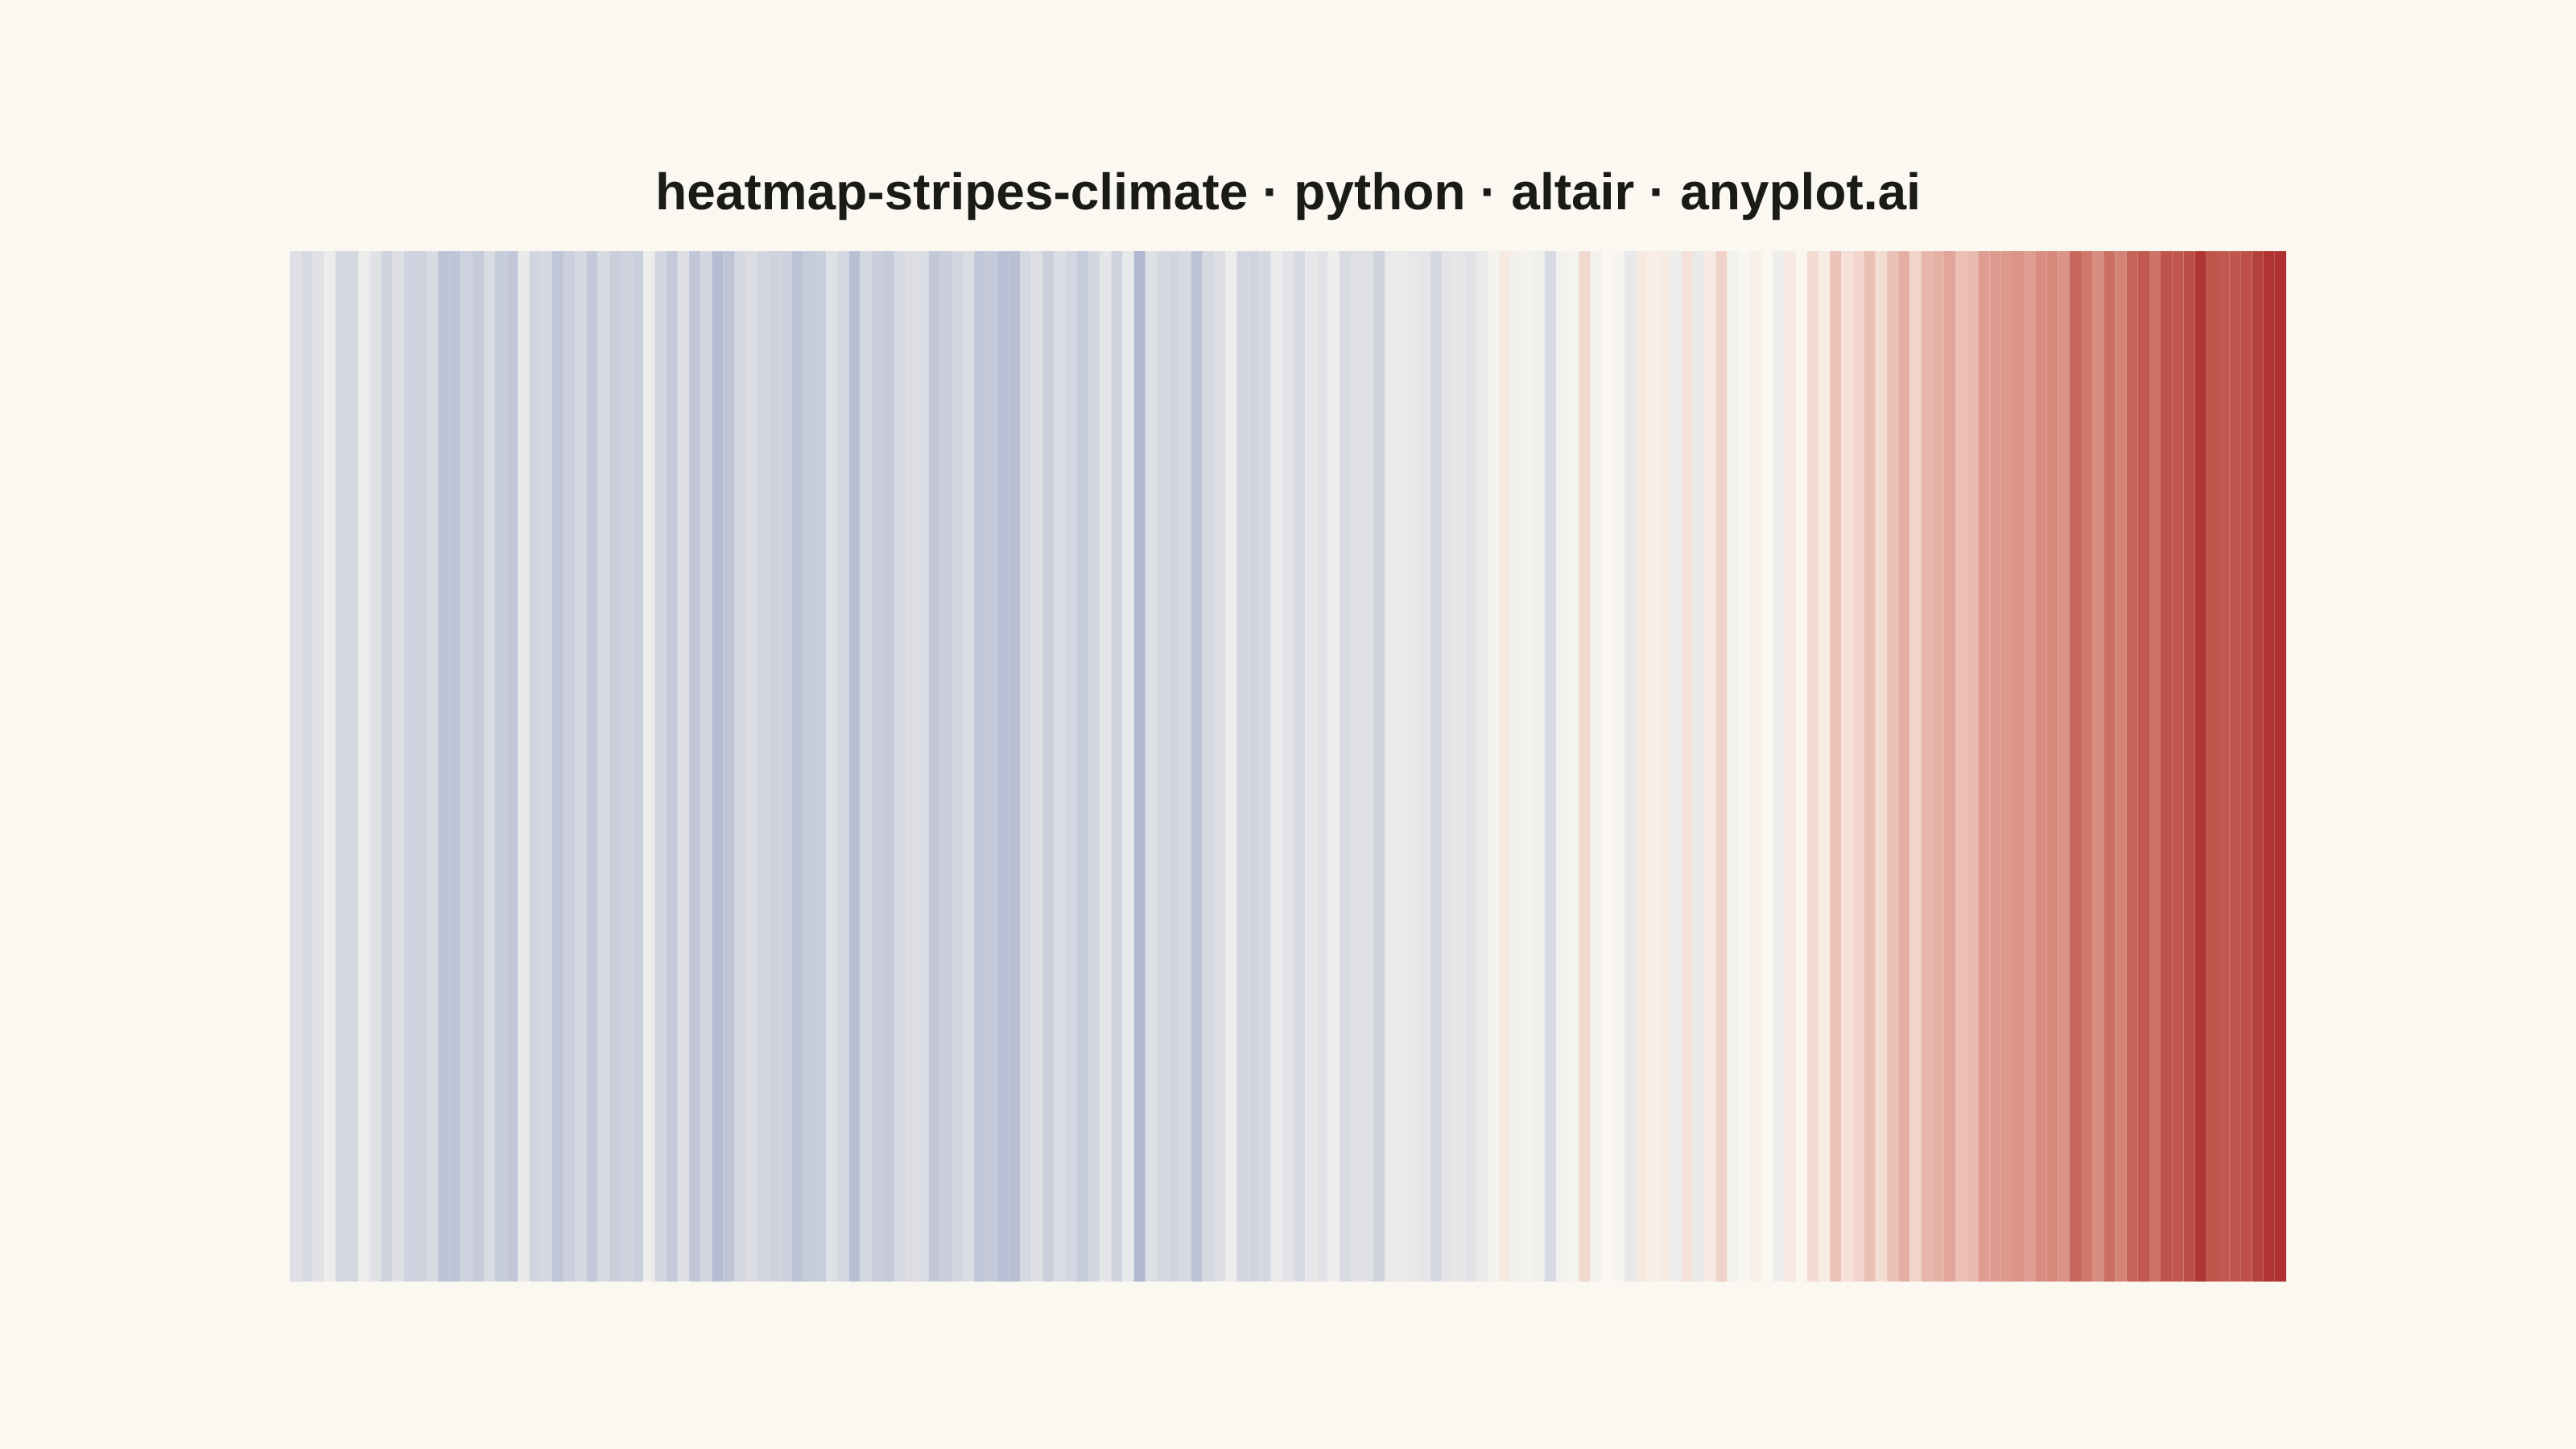
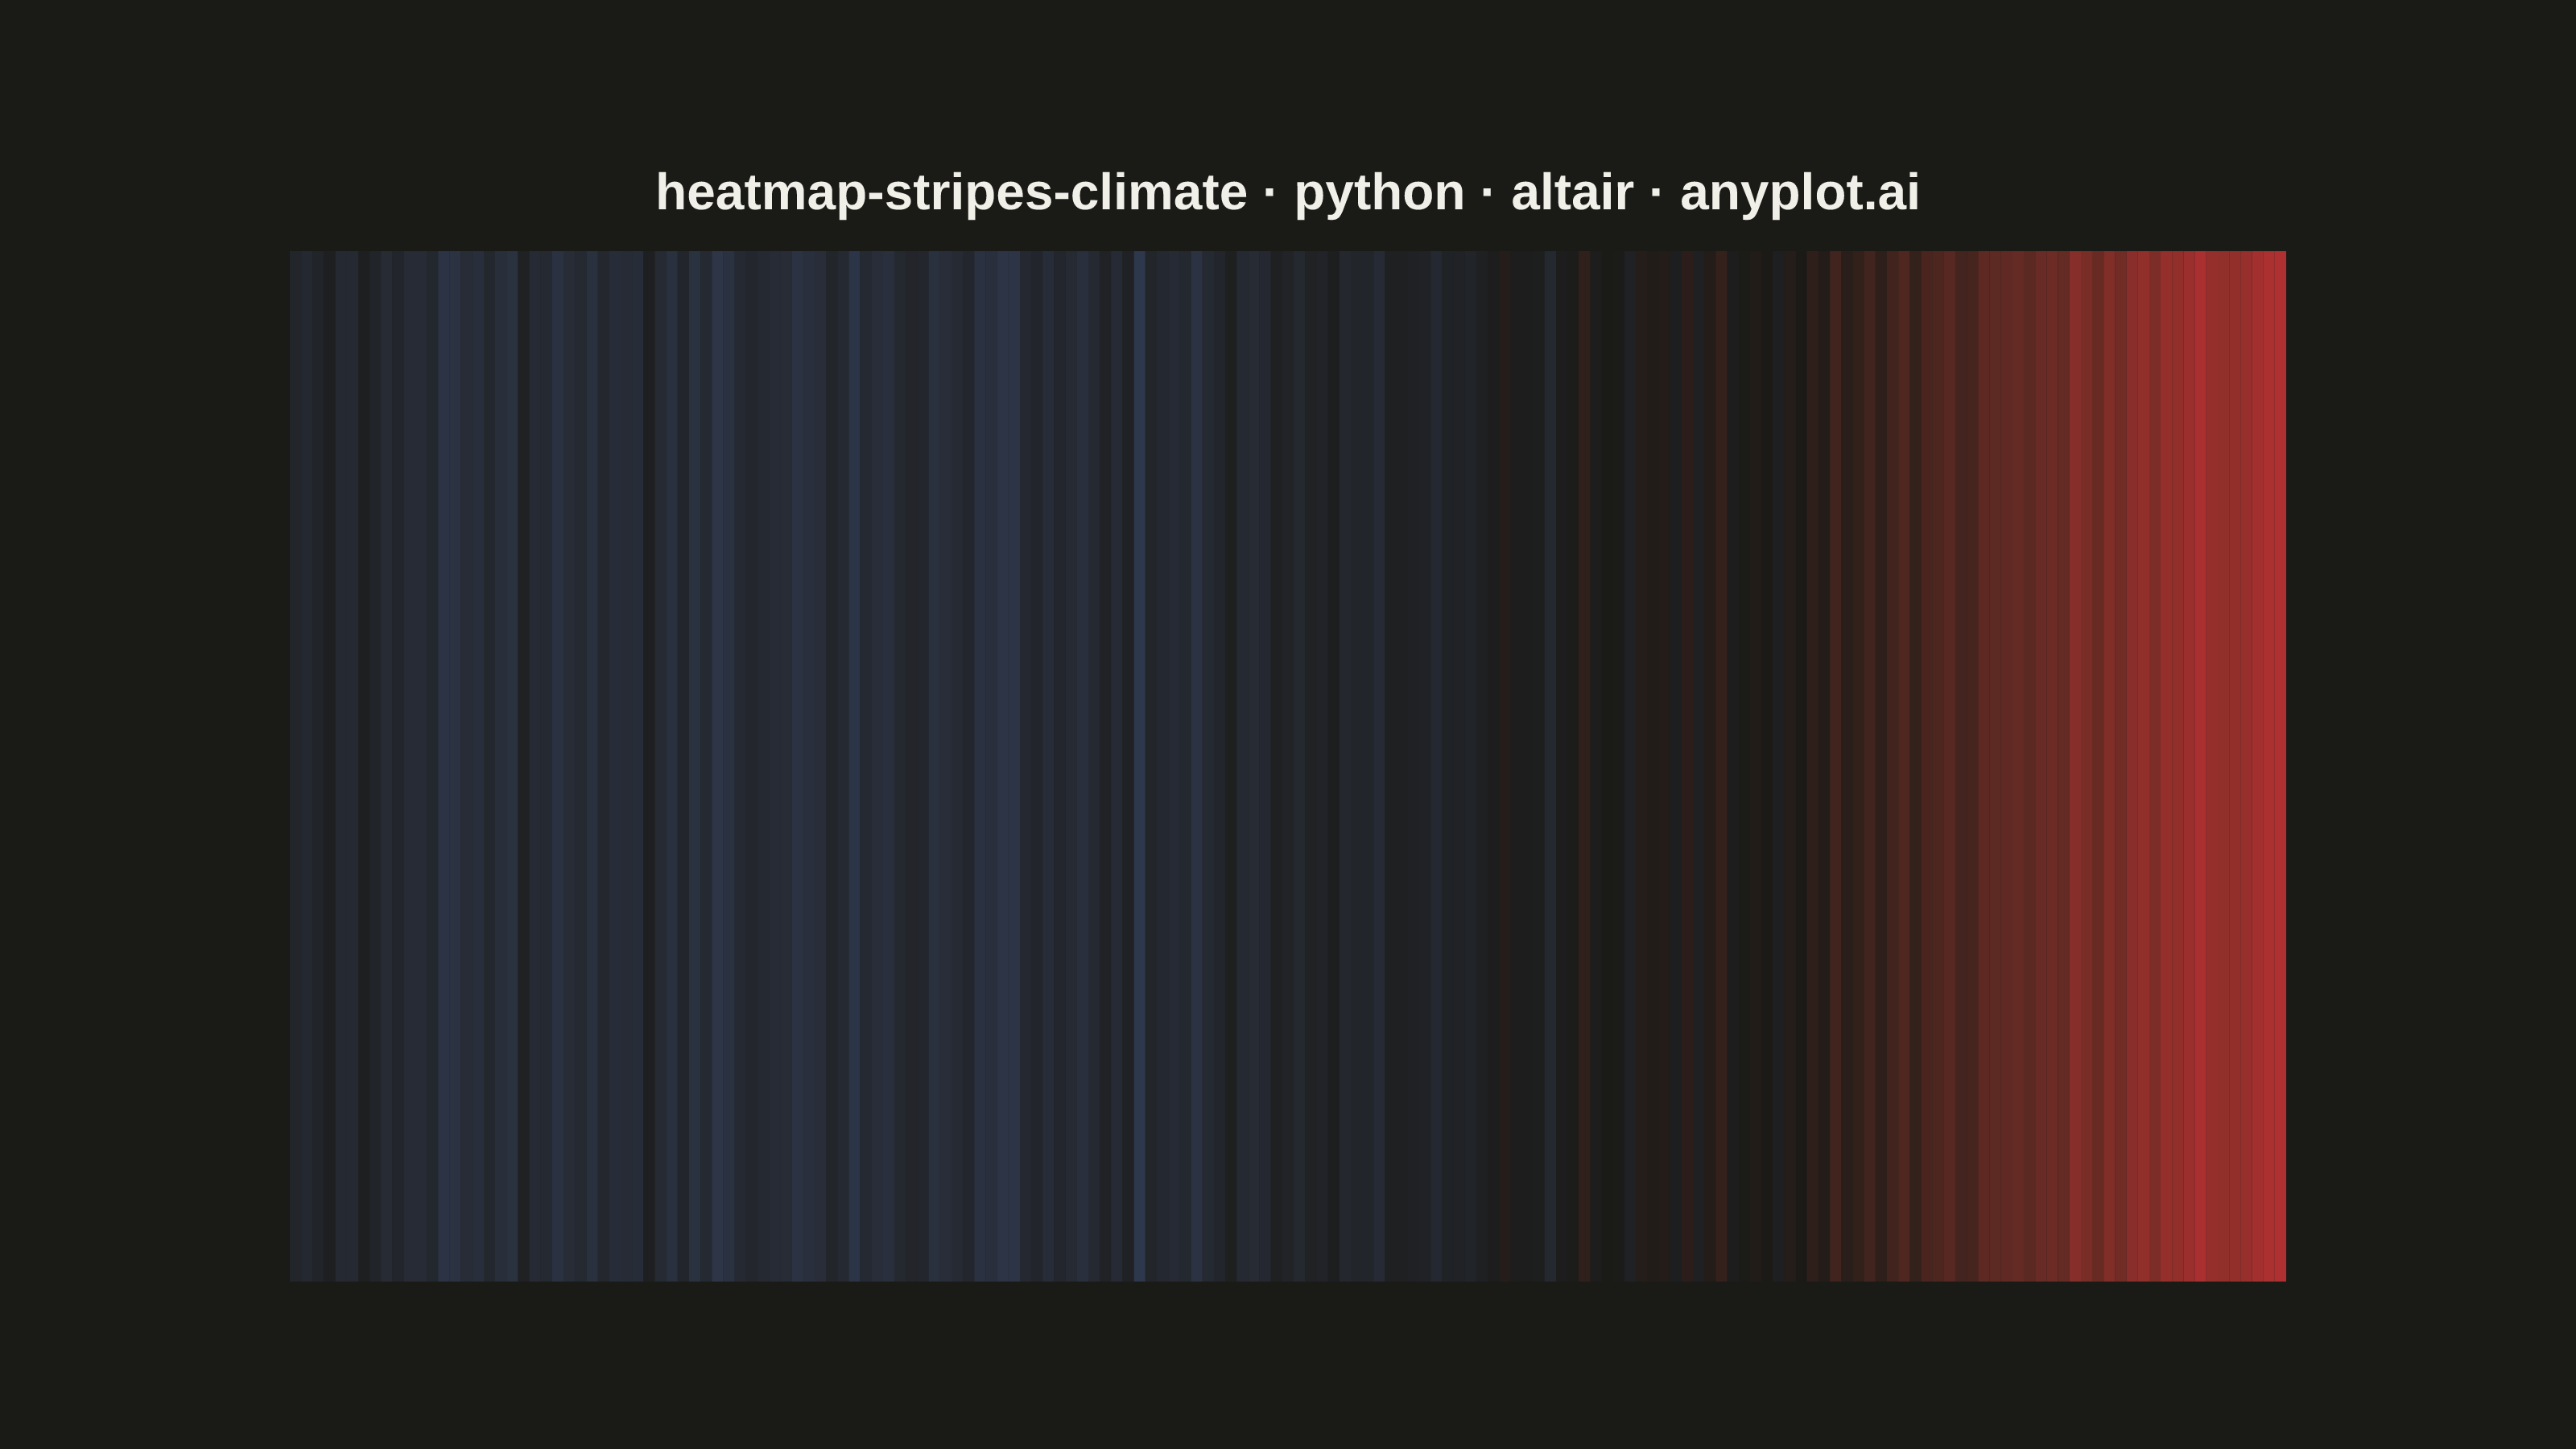
Climate warming stripes (also known as "warming stripes") display temperature anomaly data as a sequence of vertical colored bars, one per year, using a blue-to-red diverging colormap. Created by climate scientist Ed Hawkins, this minimalist visualization strips away axes, labels, and gridlines to communicate long-term warming trends through pure color encoding. The progression from cool blues to warm reds makes temperature change immediately visible at a glance.
""" anyplot.ai
heatmap-stripes-climate: Climate Warming Stripes
Library: altair 6.1.0 | Python 3.13.13
Quality: 91/100 | Updated: 2026-06-02
"""

import os as _os
import sys as _sys


# The script is named altair.py; prevent it from shadowing the installed library
# when Python's sys.path[0] points at this file's own directory.
_p = _os.path.abspath(_sys.path[0]) if _sys.path else ""
if _p and _os.path.exists(_os.path.join(_p, "altair.py")):
    _sys.path = _sys.path[1:]
del _sys, _os, _p

import os

import altair as alt
import numpy as np
import pandas as pd
from PIL import Image


# Theme tokens — Imprint palette
THEME = os.getenv("ANYPLOT_THEME", "light")
PAGE_BG = "#FAF8F1" if THEME == "light" else "#1A1A17"
INK = "#1A1A17" if THEME == "light" else "#F0EFE8"

# Data — synthetic global temperature anomalies (1850–2024) mimicking HadCRUT pattern
np.random.seed(42)
years = np.arange(1850, 2025)
n = len(years)

baseline_trend = np.piecewise(
    years.astype(float),
    [years < 1910, (years >= 1910) & (years < 1980), years >= 1980],
    [lambda y: -0.2 + (y - 1850) * (-0.001), lambda y: -0.3 + (y - 1910) * 0.005, lambda y: 0.05 + (y - 1980) * 0.022],
)
noise = np.random.normal(0, 0.08, n)
anomaly = baseline_trend + noise
df = pd.DataFrame({"year": years, "anomaly": anomaly})

# Imprint diverging colormap: cold → blue (#4467A3), zero → page bg, warm → red (#AE3030)
max_abs = max(abs(anomaly.min()), abs(anomaly.max()))
color_scale = alt.Scale(
    domain=[-max_abs, 0, max_abs], range=["#4467A3", PAGE_BG, "#AE3030"], type="linear", interpolate="lab"
)

# Warming stripes — no axes, no labels, no tick marks, no gridlines per spec
stripes = (
    alt.Chart(df)
    .mark_rect()
    .encode(
        x=alt.X("year:O", axis=None),
        color=alt.Color("anomaly:Q", scale=color_scale, legend=None),
        tooltip=[alt.Tooltip("year:O", title="Year"), alt.Tooltip("anomaly:Q", title="Anomaly (°C)", format="+.2f")],
    )
)

title_str = "heatmap-stripes-climate · python · altair · anyplot.ai"

chart = (
    stripes.properties(
        width=620,
        height=320,
        background=PAGE_BG,
        title=alt.Title(title_str, fontSize=16, anchor="middle", fontWeight="bold", color=INK, offset=10),
    )
    .configure_view(strokeWidth=0, fill=PAGE_BG)
    .configure_title(color=INK)
)

# Save PNG and pad to canonical 3200×1800
chart.save(f"plot-{THEME}.png", scale_factor=4.0)

TW, TH = 3200, 1800
_img = Image.open(f"plot-{THEME}.png").convert("RGB")
_w, _h = _img.size
if _w > TW or _h > TH:
    raise SystemExit(
        f"altair vl-convert produced {_w}×{_h}, exceeds target {TW}×{TH}. "
        f"Shrink chart .properties(width=, height=) values and re-render."
    )
if _w < TW or _h < TH:
    _canvas = Image.new("RGB", (TW, TH), PAGE_BG)
    _canvas.paste(_img, ((TW - _w) // 2, (TH - _h) // 2))
    _canvas.save(f"plot-{THEME}.png")

chart.save(f"plot-{THEME}.html")
Runnable source as JSON, for any HTTP client: https://api.anyplot.ai/specs/heatmap-stripes-climate/altair/code. Any spec id and library id listed in llms-full.txt fit the same URL shape; every URL below is complete and callable.
{
  "spec_id": "heatmap-stripes-climate",
  "language": "python",
  "library": "altair",
  "page": "https://anyplot.ai/heatmap-stripes-climate/python/altair",
  "hub": "https://anyplot.ai/heatmap-stripes-climate",
  "code_json": "https://api.anyplot.ai/specs/heatmap-stripes-climate/altair/code",
  "spec_json": "https://api.anyplot.ai/specs/heatmap-stripes-climate",
  "render_light_png": "https://storage.googleapis.com/anyplot-images/plots/heatmap-stripes-climate/python/altair/plot-light.png",
  "render_dark_png": "https://storage.googleapis.com/anyplot-images/plots/heatmap-stripes-climate/python/altair/plot-dark.png",
  "interactive_light_html": "https://storage.googleapis.com/anyplot-images/plots/heatmap-stripes-climate/python/altair/plot-light.html",
  "interactive_dark_html": "https://storage.googleapis.com/anyplot-images/plots/heatmap-stripes-climate/python/altair/plot-dark.html",
  "quality_score": 91.0,
  "license": "MIT",
  "guide": "https://anyplot.ai/llms.txt"
}
Part of Climate Warming Stripes on anyplot.ai.