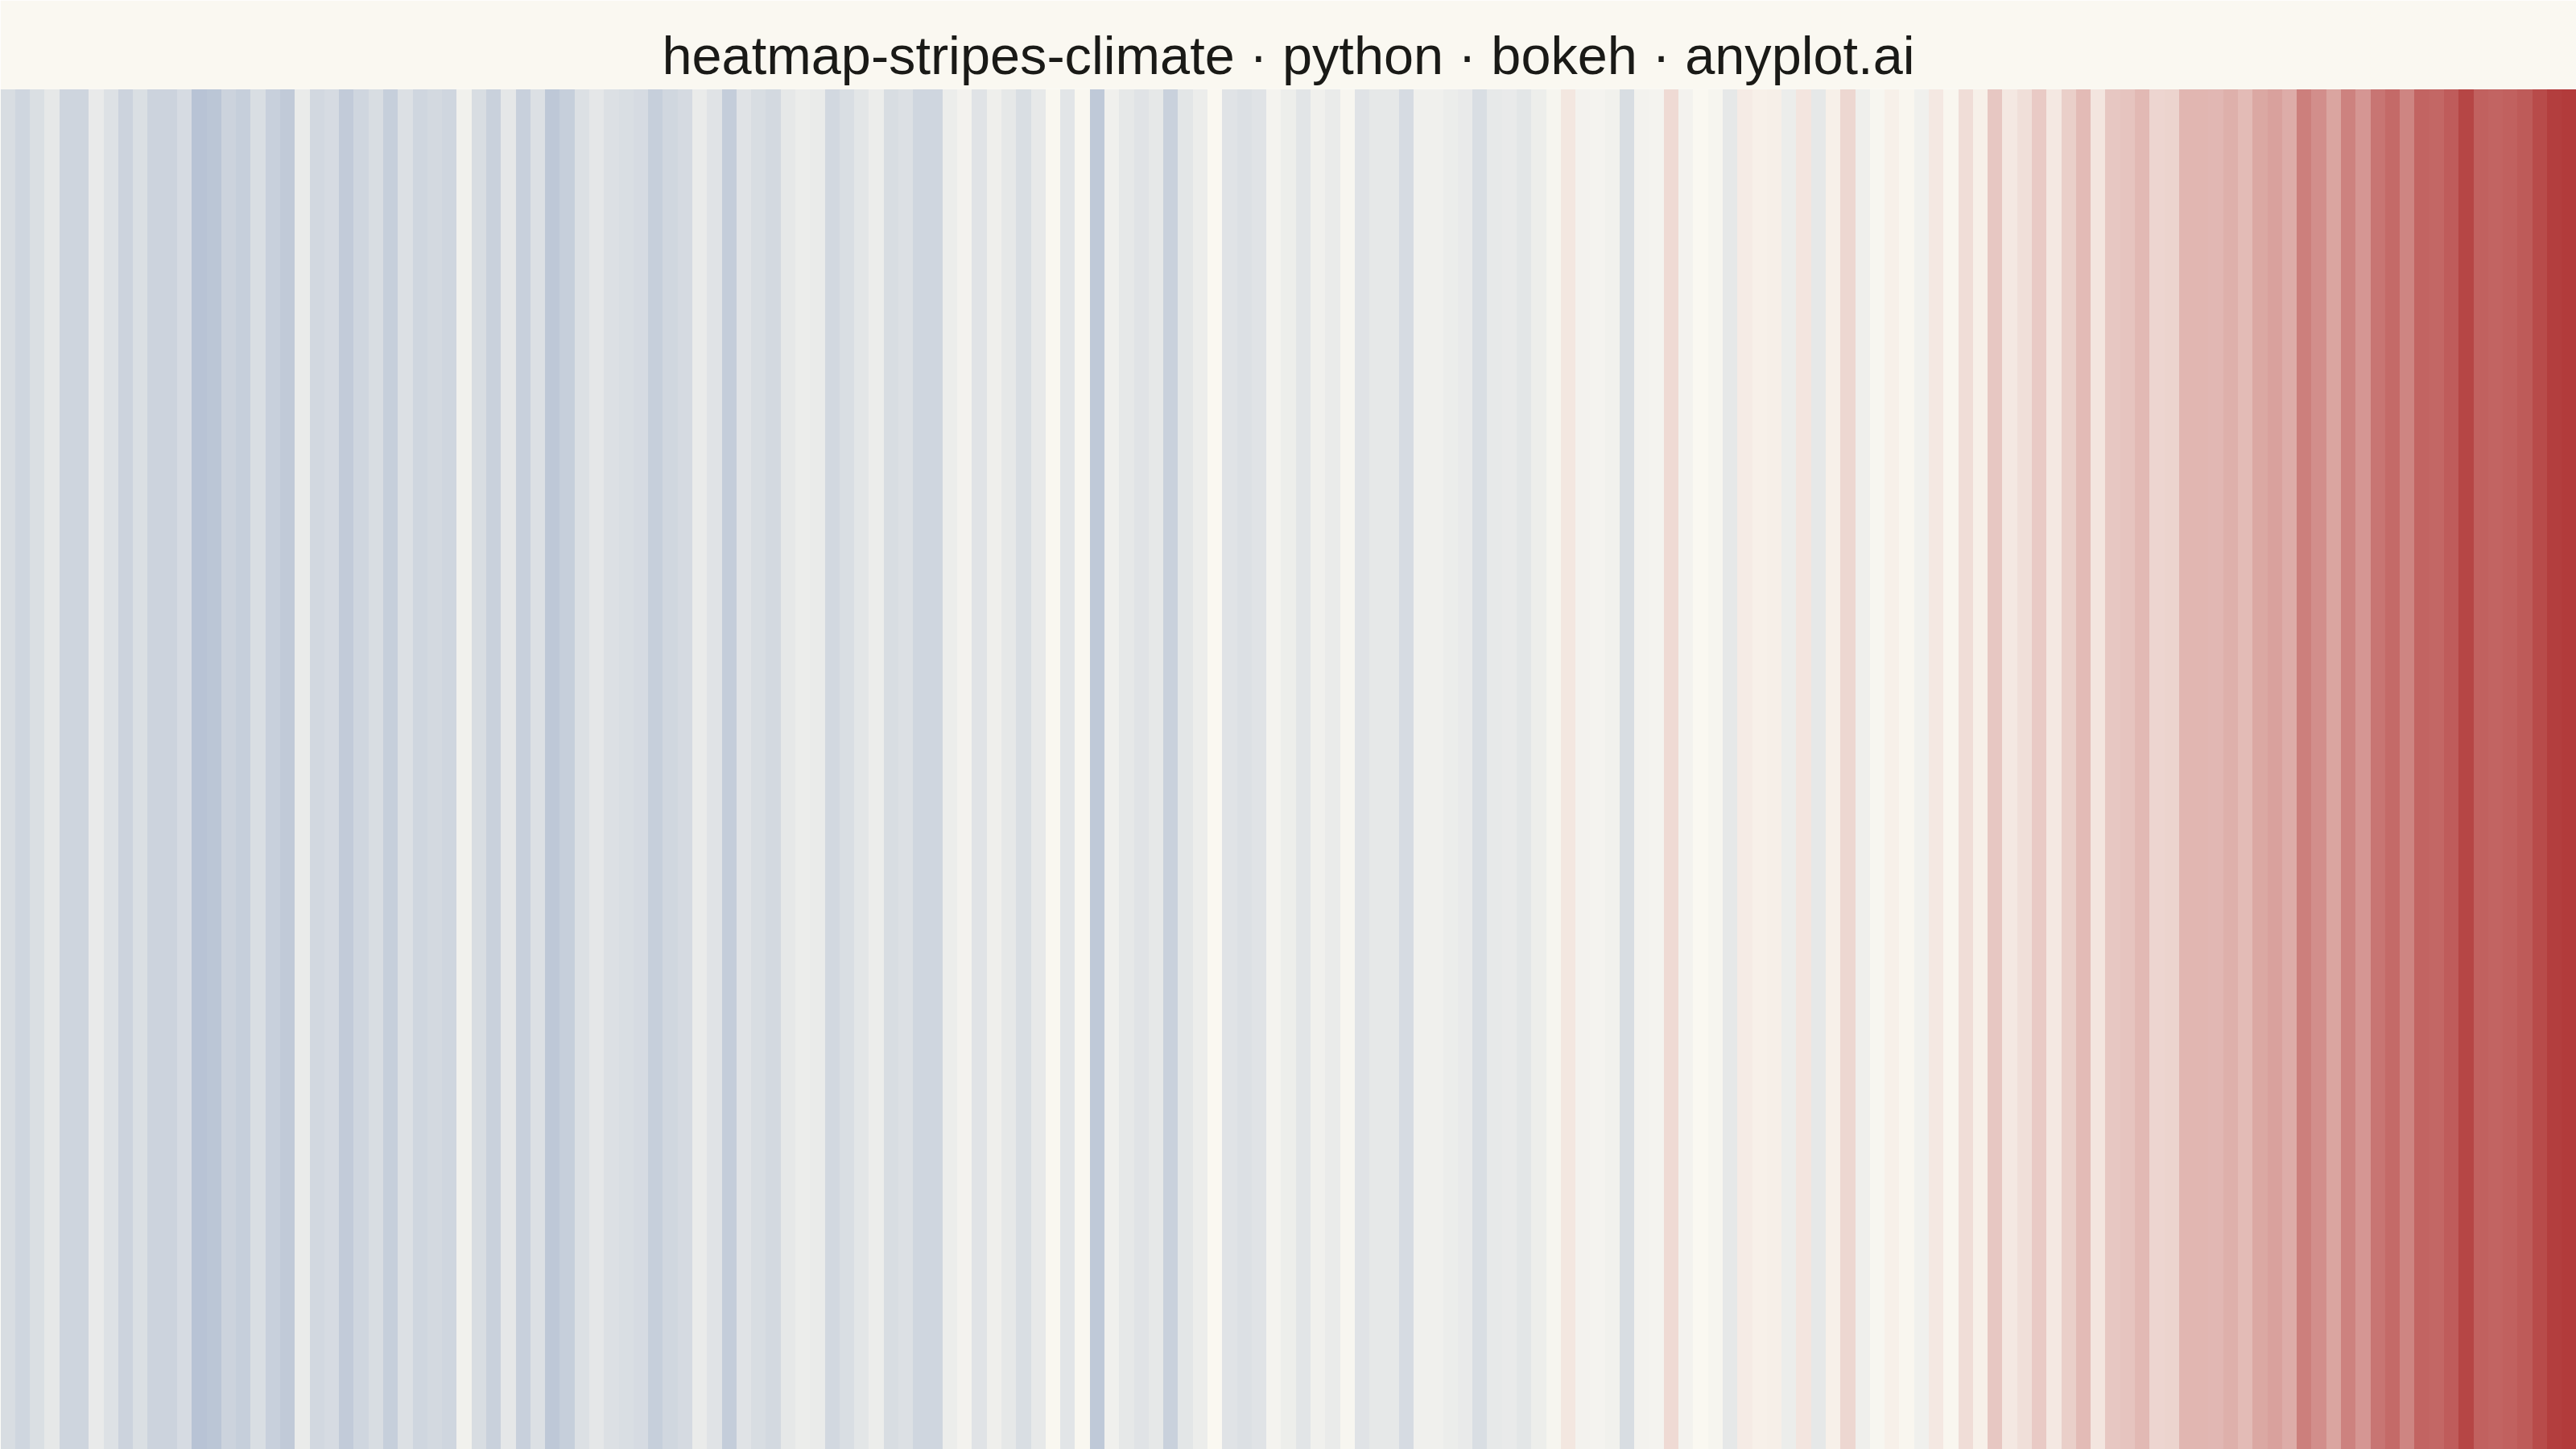
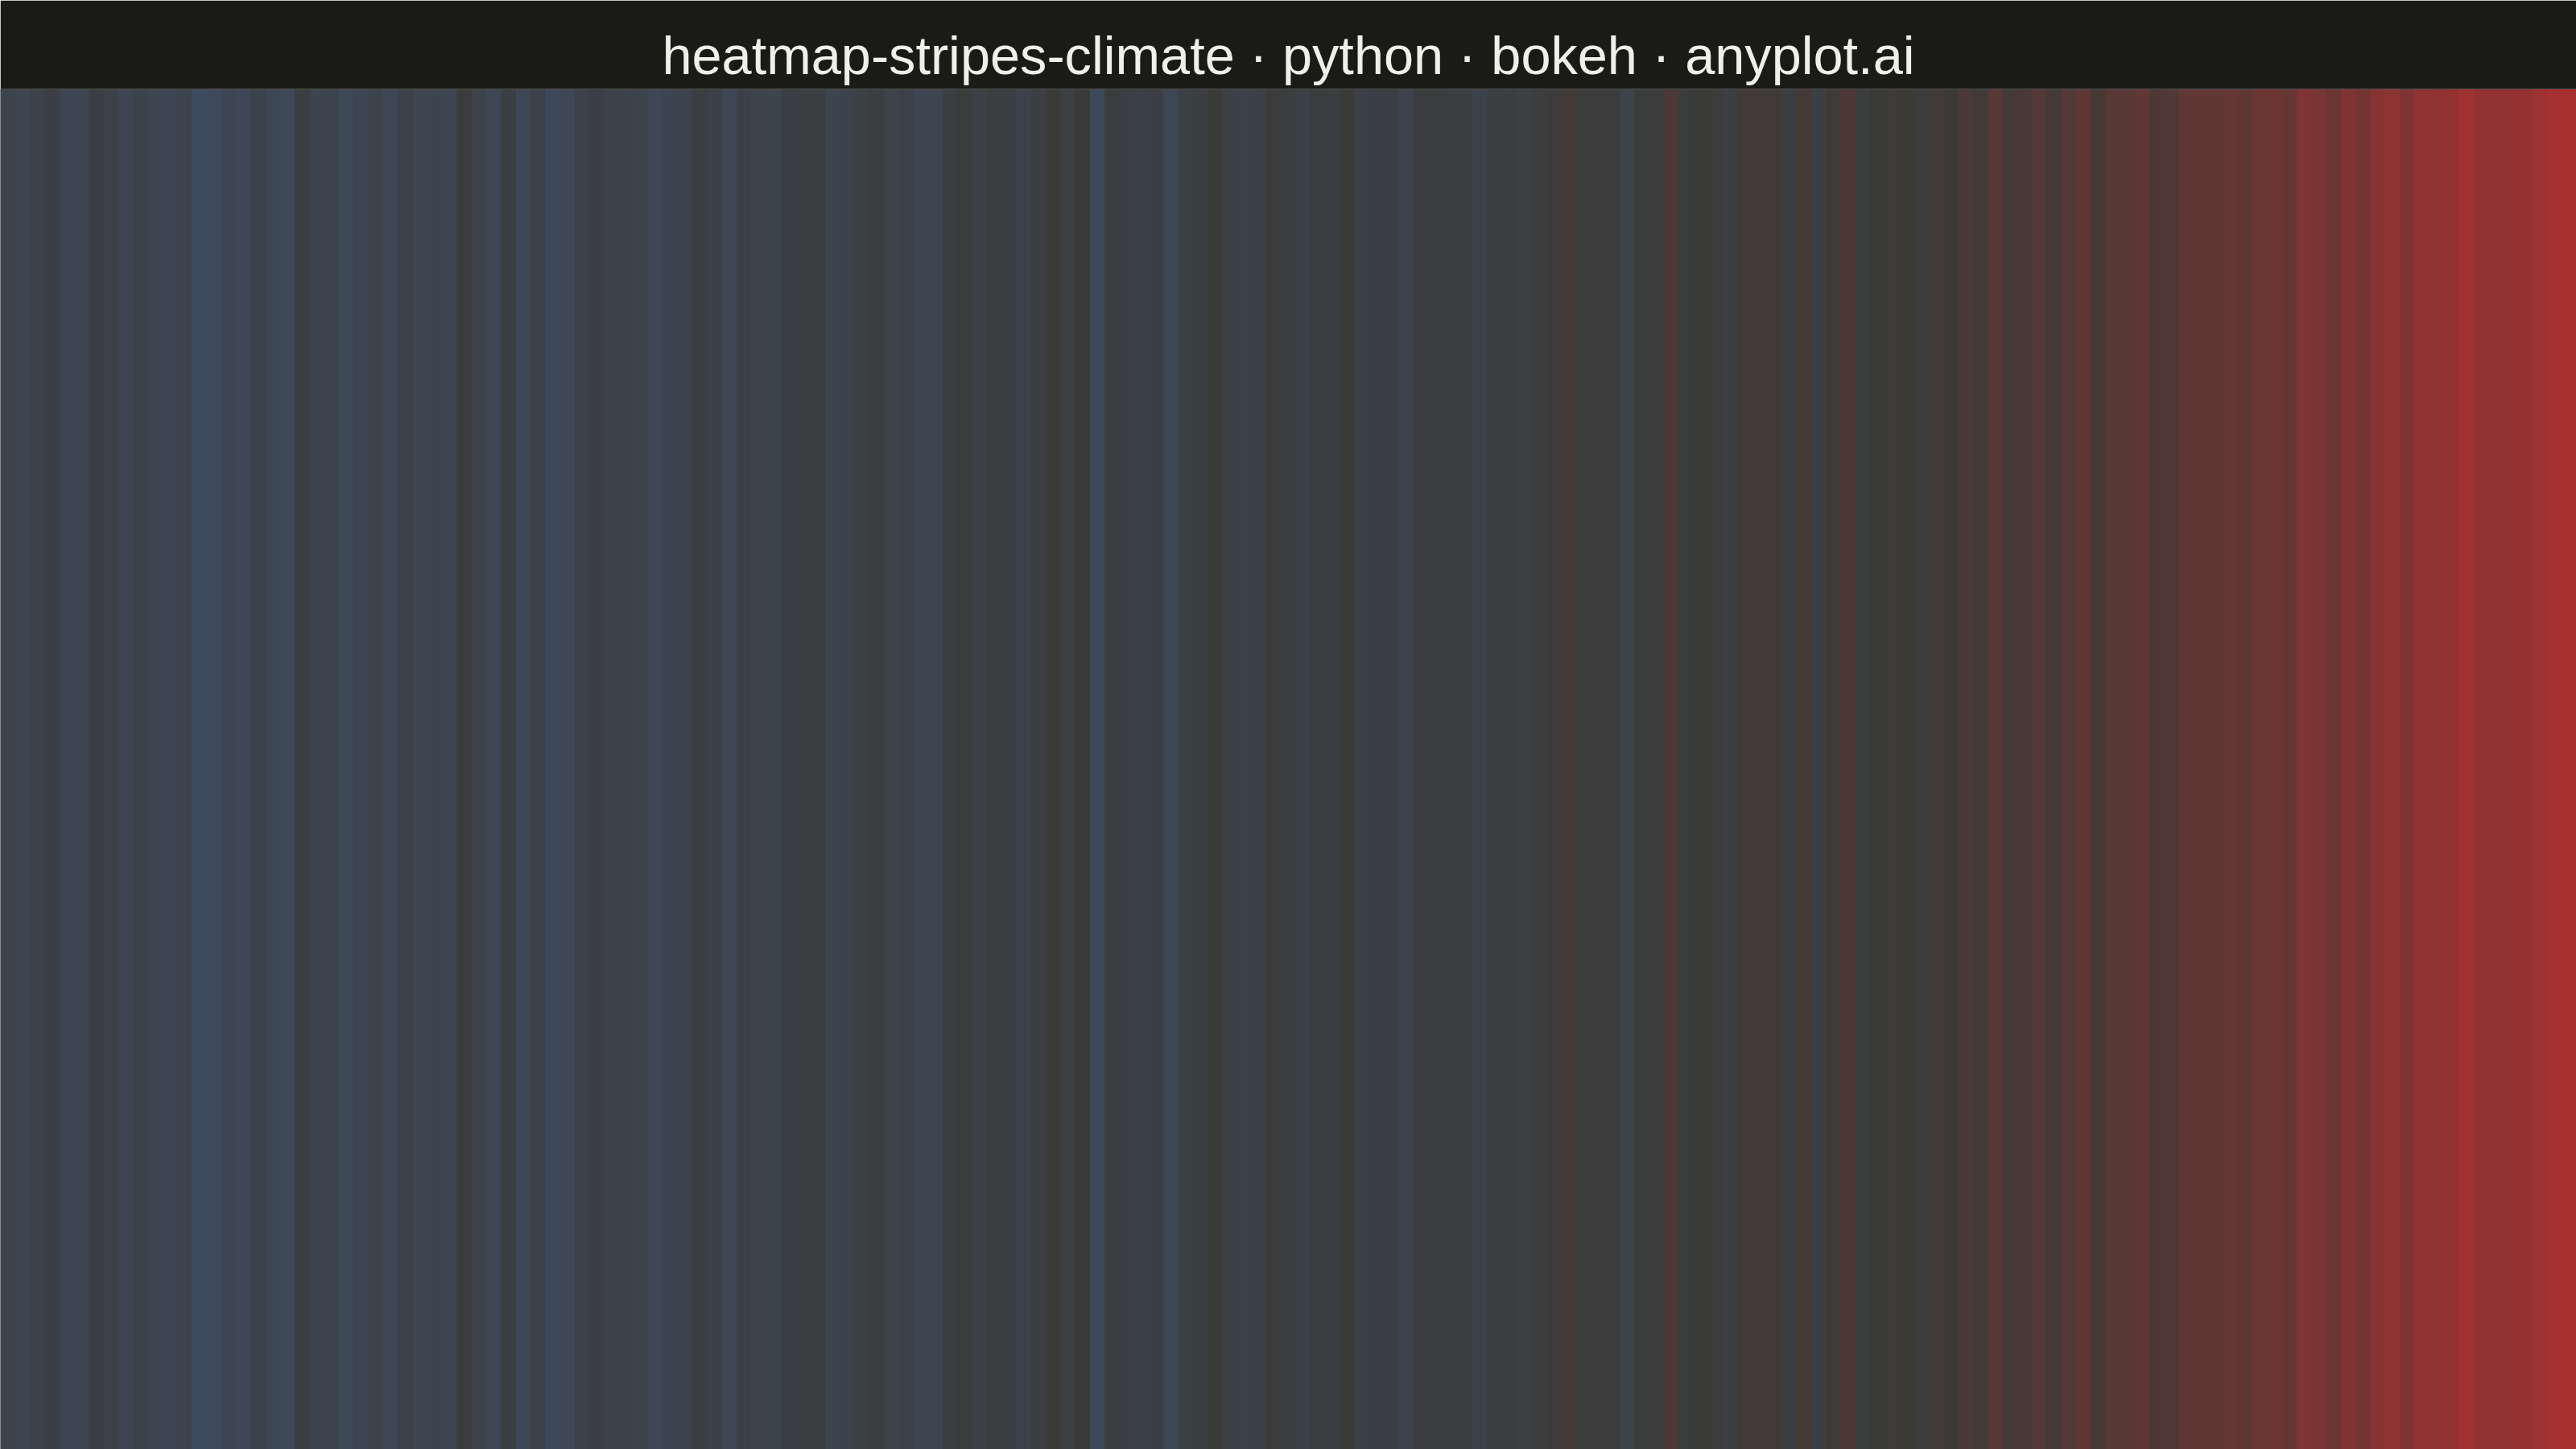
Climate warming stripes (also known as "warming stripes") display temperature anomaly data as a sequence of vertical colored bars, one per year, using a blue-to-red diverging colormap. Created by climate scientist Ed Hawkins, this minimalist visualization strips away axes, labels, and gridlines to communicate long-term warming trends through pure color encoding. The progression from cool blues to warm reds makes temperature change immediately visible at a glance.
""" anyplot.ai
heatmap-stripes-climate: Climate Warming Stripes
Library: bokeh 3.9.0 | Python 3.13.13
Quality: 88/100 | Updated: 2026-06-02
"""

import os
import sys
import time
from pathlib import Path


# Remove script's own directory from sys.path so 'bokeh' resolves to the installed package
_this_dir = os.path.dirname(os.path.abspath(__file__))
if _this_dir in sys.path:
    sys.path.remove(_this_dir)

import numpy as np
from bokeh.io import output_file, save
from bokeh.models import HoverTool, LinearColorMapper, Range1d
from bokeh.plotting import figure
from selenium import webdriver
from selenium.webdriver.chrome.options import Options


THEME = os.getenv("ANYPLOT_THEME", "light")

# Theme-adaptive chrome — Imprint palette
PAGE_BG = "#FAF8F1" if THEME == "light" else "#1A1A17"
INK = "#1A1A17" if THEME == "light" else "#F0EFE8"

# Data: synthetic global temperature anomalies (1850–2024) relative to 1961–1990 baseline
np.random.seed(42)
years = np.arange(1850, 2025)
n_years = len(years)

base_trend = np.concatenate(
    [
        np.linspace(-0.3, -0.2, 60),
        np.linspace(-0.2, -0.1, 40),
        np.linspace(-0.1, 0.0, 25),
        np.linspace(0.0, 0.4, 25),
        np.linspace(0.4, 1.2, 25),
    ]
)
noise = np.random.normal(0, 0.1, n_years)
anomalies = base_trend + noise

# Symmetric color range centered at 0
vmax = np.ceil(max(abs(anomalies.min()), abs(anomalies.max())) * 10) / 10


def _lerp_hex(c0, c1, t):
    r0, g0, b0 = (int(c0[i : i + 2], 16) for i in (1, 3, 5))
    r1, g1, b1 = (int(c1[i : i + 2], 16) for i in (1, 3, 5))
    r = int(round(r0 + (r1 - r0) * t))
    g = int(round(g0 + (g1 - g0) * t))
    b = int(round(b0 + (b1 - b0) * t))
    return f"#{r:02X}{g:02X}{b:02X}"


# Imprint diverging palette: #4467A3 (blue/cold) → neutral midpoint → #AE3030 (red/warm)
# Negative anomalies = cold = blue; positive anomalies = warm = red
# Dark midpoint uses #3A3A37 (not #1A1A17) so near-zero stripes remain visible against dark bg
_midpoint = "#FAF8F1" if THEME == "light" else "#3A3A37"
ANYPLOT_DIV256 = [_lerp_hex("#4467A3", _midpoint, t / 127.0) for t in range(128)] + [
    _lerp_hex(_midpoint, "#AE3030", t / 127.0) for t in range(128)
]

color_mapper = LinearColorMapper(palette=ANYPLOT_DIV256, low=-vmax, high=vmax)

# Reshape anomalies as 2D image (1 row × n_years columns) for seamless stripe rendering
img_data = anomalies.reshape(1, -1)

# Canvas: 3200×1800 px landscape (hard contract — no deviation)
W, H = 3200, 1800

p = figure(
    width=W,
    height=H,
    title="heatmap-stripes-climate · python · bokeh · anyplot.ai",
    tools="",
    toolbar_location=None,
    x_range=Range1d(years[0], years[-1] + 1),
    y_range=Range1d(0, 1),
    min_border_left=0,
    min_border_right=0,
    min_border_top=110,  # room for 50pt title
    min_border_bottom=0,  # no x-axis — extend stripes to bottom edge
)

p.image(image=[img_data], x=years[0], y=0, dw=n_years, dh=1, color_mapper=color_mapper)

# Minimalist style: no axes, no labels, no gridlines, no ticks — pure color encoding
p.title.text_font_size = "50pt"
p.title.text_font_style = "normal"
p.title.align = "center"
p.title.text_color = INK

p.xaxis.visible = False
p.yaxis.visible = False
p.xgrid.grid_line_color = None
p.ygrid.grid_line_color = None
p.outline_line_color = None
p.background_fill_color = PAGE_BG
p.border_fill_color = PAGE_BG

# Interactive hover for HTML version — shows year and anomaly on hover
hover = HoverTool(tooltips=[("Year", "$x{0}"), ("Anomaly", "@image{+0.00}°C")])
p.add_tools(hover)

# Save interactive HTML (required artifact for interactive libraries)
output_file(f"plot-{THEME}.html")
save(p, title="Climate Warming Stripes")

# Screenshot with headless Chrome via Selenium (do NOT use export_png — chromedriver snap issues)
# Use a taller window to accommodate browser overhead, then use CDP to override viewport exactly.
opts = Options()
for arg in (
    "--headless=new",
    "--no-sandbox",
    "--disable-dev-shm-usage",
    "--disable-gpu",
    f"--window-size={W},{H + 200}",
    "--hide-scrollbars",
    "--force-device-scale-factor=1",
):
    opts.add_argument(arg)
driver = webdriver.Chrome(options=opts)
# Override viewport to exactly W×H so the full Bokeh canvas is in-view
driver.execute_cdp_cmd(
    "Emulation.setDeviceMetricsOverride", {"width": W, "height": H, "deviceScaleFactor": 1, "mobile": False}
)
driver.get(f"file://{Path(f'plot-{THEME}.html').resolve()}")
time.sleep(3)  # let Bokeh JS render the canvas
driver.save_screenshot(f"plot-{THEME}.png")
driver.quit()
Runnable source as JSON, for any HTTP client: https://api.anyplot.ai/specs/heatmap-stripes-climate/bokeh/code. Any spec id and library id listed in llms-full.txt fit the same URL shape; every URL below is complete and callable.
{
  "spec_id": "heatmap-stripes-climate",
  "language": "python",
  "library": "bokeh",
  "page": "https://anyplot.ai/heatmap-stripes-climate/python/bokeh",
  "hub": "https://anyplot.ai/heatmap-stripes-climate",
  "code_json": "https://api.anyplot.ai/specs/heatmap-stripes-climate/bokeh/code",
  "spec_json": "https://api.anyplot.ai/specs/heatmap-stripes-climate",
  "render_light_png": "https://storage.googleapis.com/anyplot-images/plots/heatmap-stripes-climate/python/bokeh/plot-light.png",
  "render_dark_png": "https://storage.googleapis.com/anyplot-images/plots/heatmap-stripes-climate/python/bokeh/plot-dark.png",
  "interactive_light_html": "https://storage.googleapis.com/anyplot-images/plots/heatmap-stripes-climate/python/bokeh/plot-light.html",
  "interactive_dark_html": "https://storage.googleapis.com/anyplot-images/plots/heatmap-stripes-climate/python/bokeh/plot-dark.html",
  "quality_score": 88.0,
  "license": "MIT",
  "guide": "https://anyplot.ai/llms.txt"
}
Part of Climate Warming Stripes on anyplot.ai.