The same plot in 14 other libraries — Python: Altair, Bokeh, lets-plot, Matplotlib, Plotly, plotnine, Pygal, Seaborn; R: ggplot2; JavaScript: Chart.js, D3.js, Apache ECharts, Highcharts, MUI X Charts. Compare all 15 side by side: Climate Warming Stripes in Python, R, Julia and JavaScript.
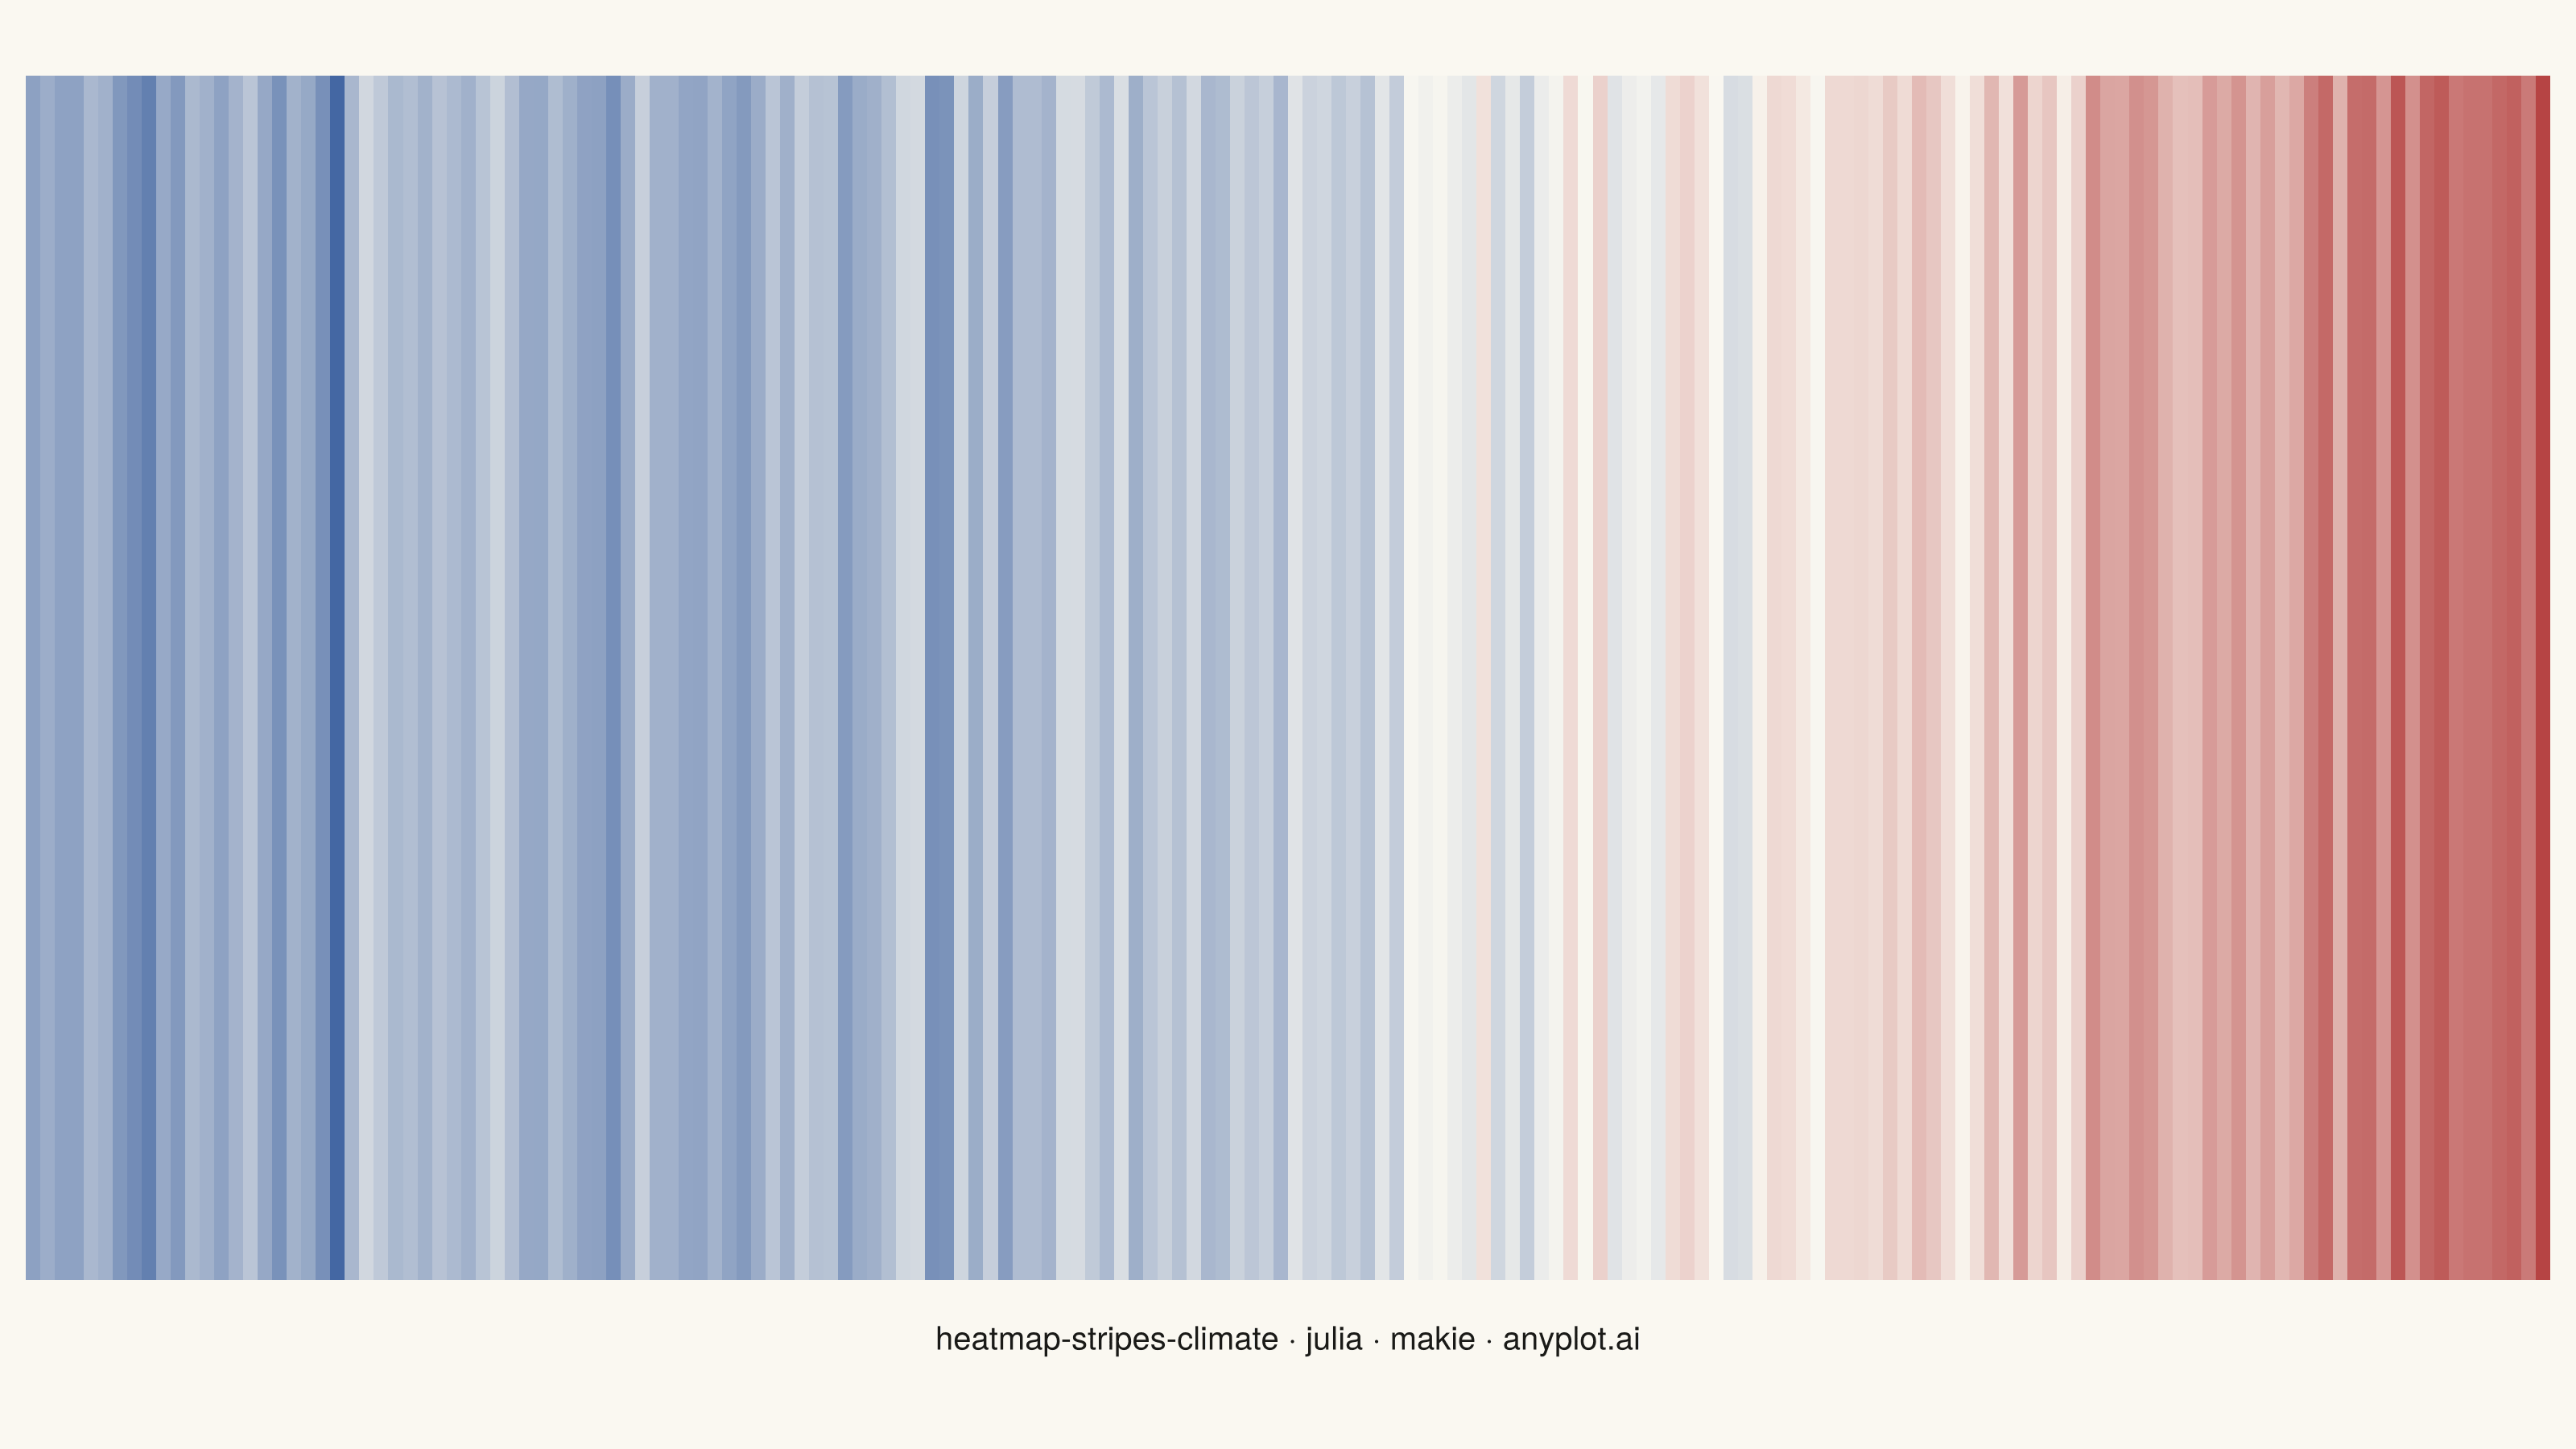
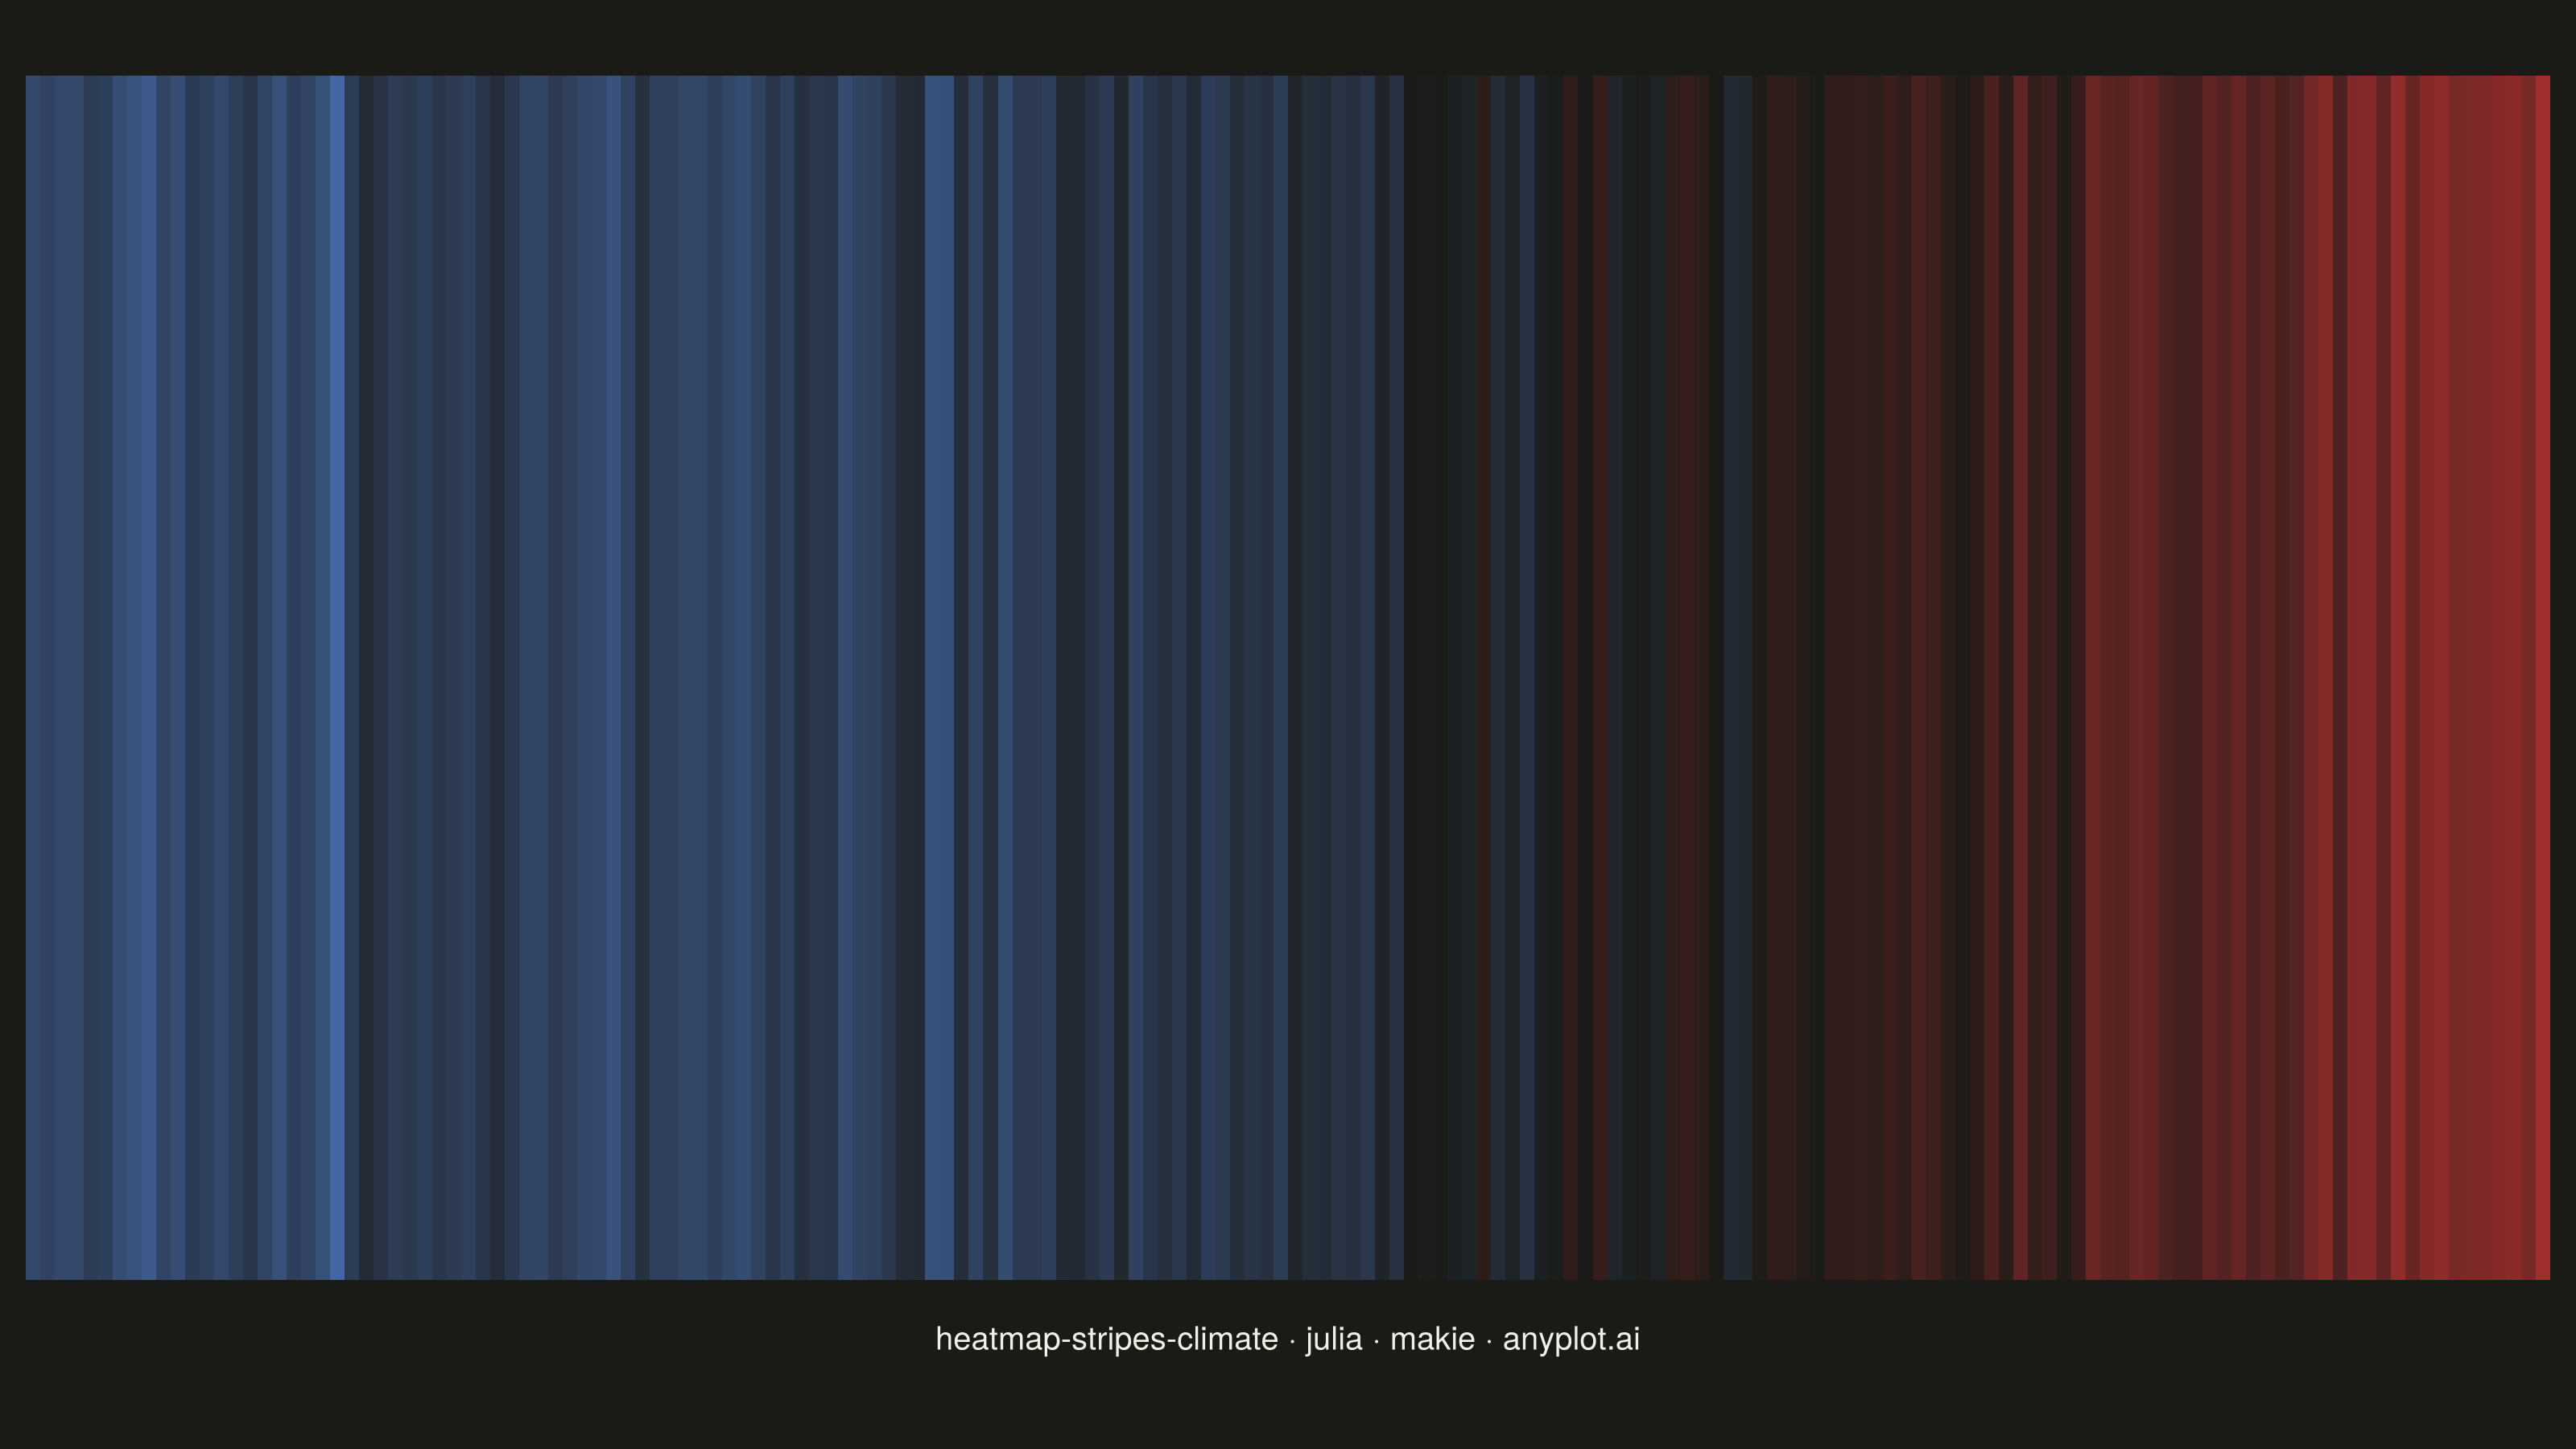
Climate warming stripes (also known as "warming stripes") display temperature anomaly data as a sequence of vertical colored bars, one per year, using a blue-to-red diverging colormap. Created by climate scientist Ed Hawkins, this minimalist visualization strips away axes, labels, and gridlines to communicate long-term warming trends through pure color encoding. The progression from cool blues to warm reds makes temperature change immediately visible at a glance.
# anyplot.ai
# heatmap-stripes-climate: Climate Warming Stripes
# Library: makie 0.22.10 | Julia 1.11.9
# Quality: 90/100 | Created: 2026-06-02

using CairoMakie
using Colors
using Random

Random.seed!(42)

# Theme tokens
const THEME   = get(ENV, "ANYPLOT_THEME", "light")
const PAGE_BG = THEME == "light" ? colorant"#FAF8F1" : colorant"#1A1A17"
const INK     = THEME == "light" ? colorant"#1A1A17" : colorant"#F0EFE8"
const TITLE   = "heatmap-stripes-climate · julia · makie · anyplot.ai"

# Imprint diverging colormap: Imprint blue (cold) → neutral → Imprint red (warm)
# Midpoint must contrast against background so near-zero anomaly stripes are visible
const div_mid     = THEME == "light" ? colorant"#BDBBB4" : colorant"#6B6A63"
const ANYPLOT_DIV = cgrad([colorant"#4467A3", div_mid, colorant"#AE3030"])

# Data: simulated global temperature anomalies 1850–2023
const n_years = 174
t           = range(0.0, 1.0; length=n_years)
trend       = -0.50 .+ 1.20 .* t .^ 2.0
variability = 0.12 .* randn(n_years)
for idx in [22, 41, 63, 91, 141]
    variability[idx] -= 0.25
    idx + 1 <= n_years && (variability[idx + 1] -= 0.08)
end
anomalies = trend .+ variability
max_abs   = max(abs(minimum(anomalies)), abs(maximum(anomalies)))

# Figure: landscape 1600×900 × px_per_unit=2 → 3200×1800 px output
fig = Figure(
    size            = (1600, 900),
    backgroundcolor = PAGE_BG,
)

# Stripes axis — no decorations, no spines
ax = Axis(
    fig[1, 1];
    backgroundcolor = PAGE_BG,
)
hidedecorations!(ax)
hidespines!(ax)

# Warming stripes: one vertical stripe per year (n_years × 1 heatmap)
z = reshape(anomalies, n_years, 1)
heatmap!(ax, 1:n_years, 1:1, z;
    colormap   = ANYPLOT_DIV,
    colorrange = (-max_abs, max_abs),
)
xlims!(ax, 0.5, n_years + 0.5)
ylims!(ax, 0.5, 1.5)

# Mandated anyplot title (52 chars — no font scaling needed)
Label(fig[2, 1], TITLE;
    fontsize  = 26,
    color     = INK,
    tellwidth = false,
    padding   = (0, 0, 10, 6),
)

rowsize!(fig.layout, 1, Relative(0.88))

save("plot-$(THEME).png", fig; px_per_unit = 2)
Runnable source as JSON, for any HTTP client: https://api.anyplot.ai/specs/heatmap-stripes-climate/makie/code. Any spec id and library id listed in llms-full.txt fit the same URL shape; every URL below is complete and callable.
{
  "spec_id": "heatmap-stripes-climate",
  "language": "julia",
  "library": "makie",
  "page": "https://anyplot.ai/heatmap-stripes-climate/julia/makie",
  "hub": "https://anyplot.ai/heatmap-stripes-climate",
  "code_json": "https://api.anyplot.ai/specs/heatmap-stripes-climate/makie/code",
  "spec_json": "https://api.anyplot.ai/specs/heatmap-stripes-climate",
  "render_light_png": "https://storage.googleapis.com/anyplot-images/plots/heatmap-stripes-climate/julia/makie/plot-light.png",
  "render_dark_png": "https://storage.googleapis.com/anyplot-images/plots/heatmap-stripes-climate/julia/makie/plot-dark.png",
  "quality_score": 90.0,
  "license": "MIT",
  "guide": "https://anyplot.ai/llms.txt"
}
Part of Climate Warming Stripes on anyplot.ai.