The same plot in 14 other libraries — JavaScript: Chart.js, Apache ECharts, Highcharts, MUI X Charts; Python: Altair, Bokeh, lets-plot, Matplotlib, Plotly, plotnine, Pygal, Seaborn; R: ggplot2; Julia: Makie.jl. Compare all 15 side by side: Climate Warming Stripes in Python, R, Julia and JavaScript.
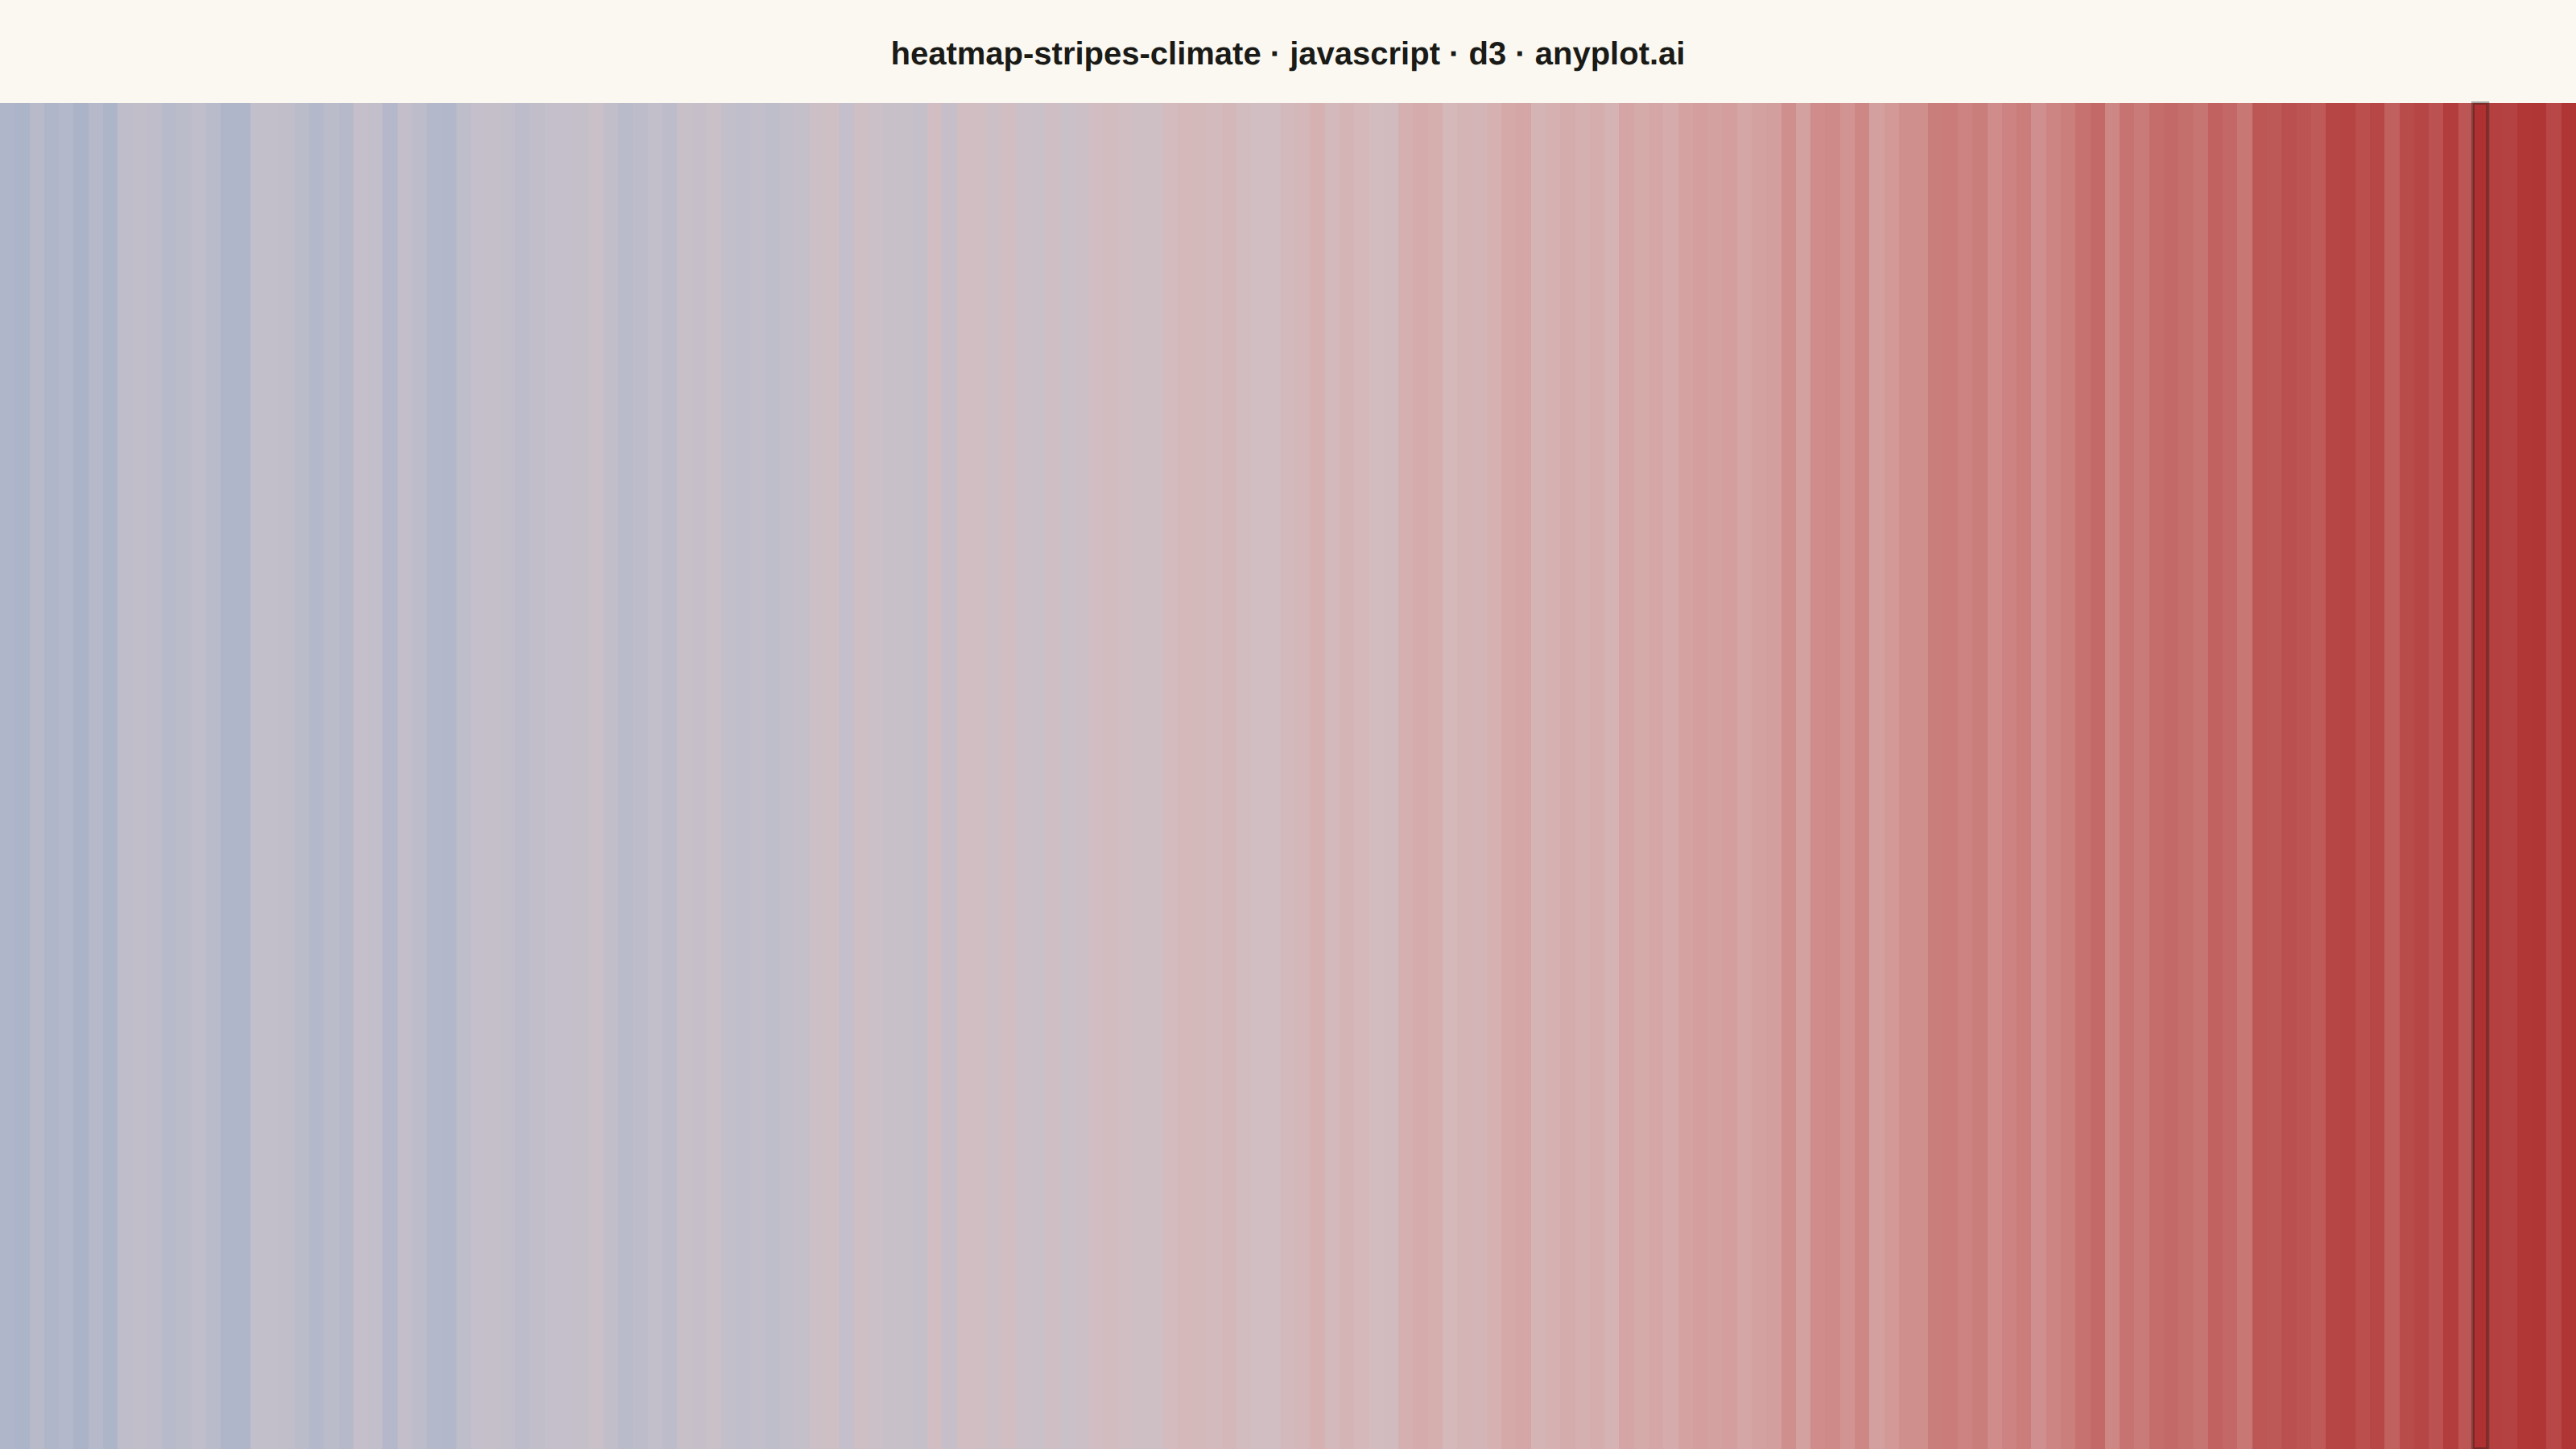
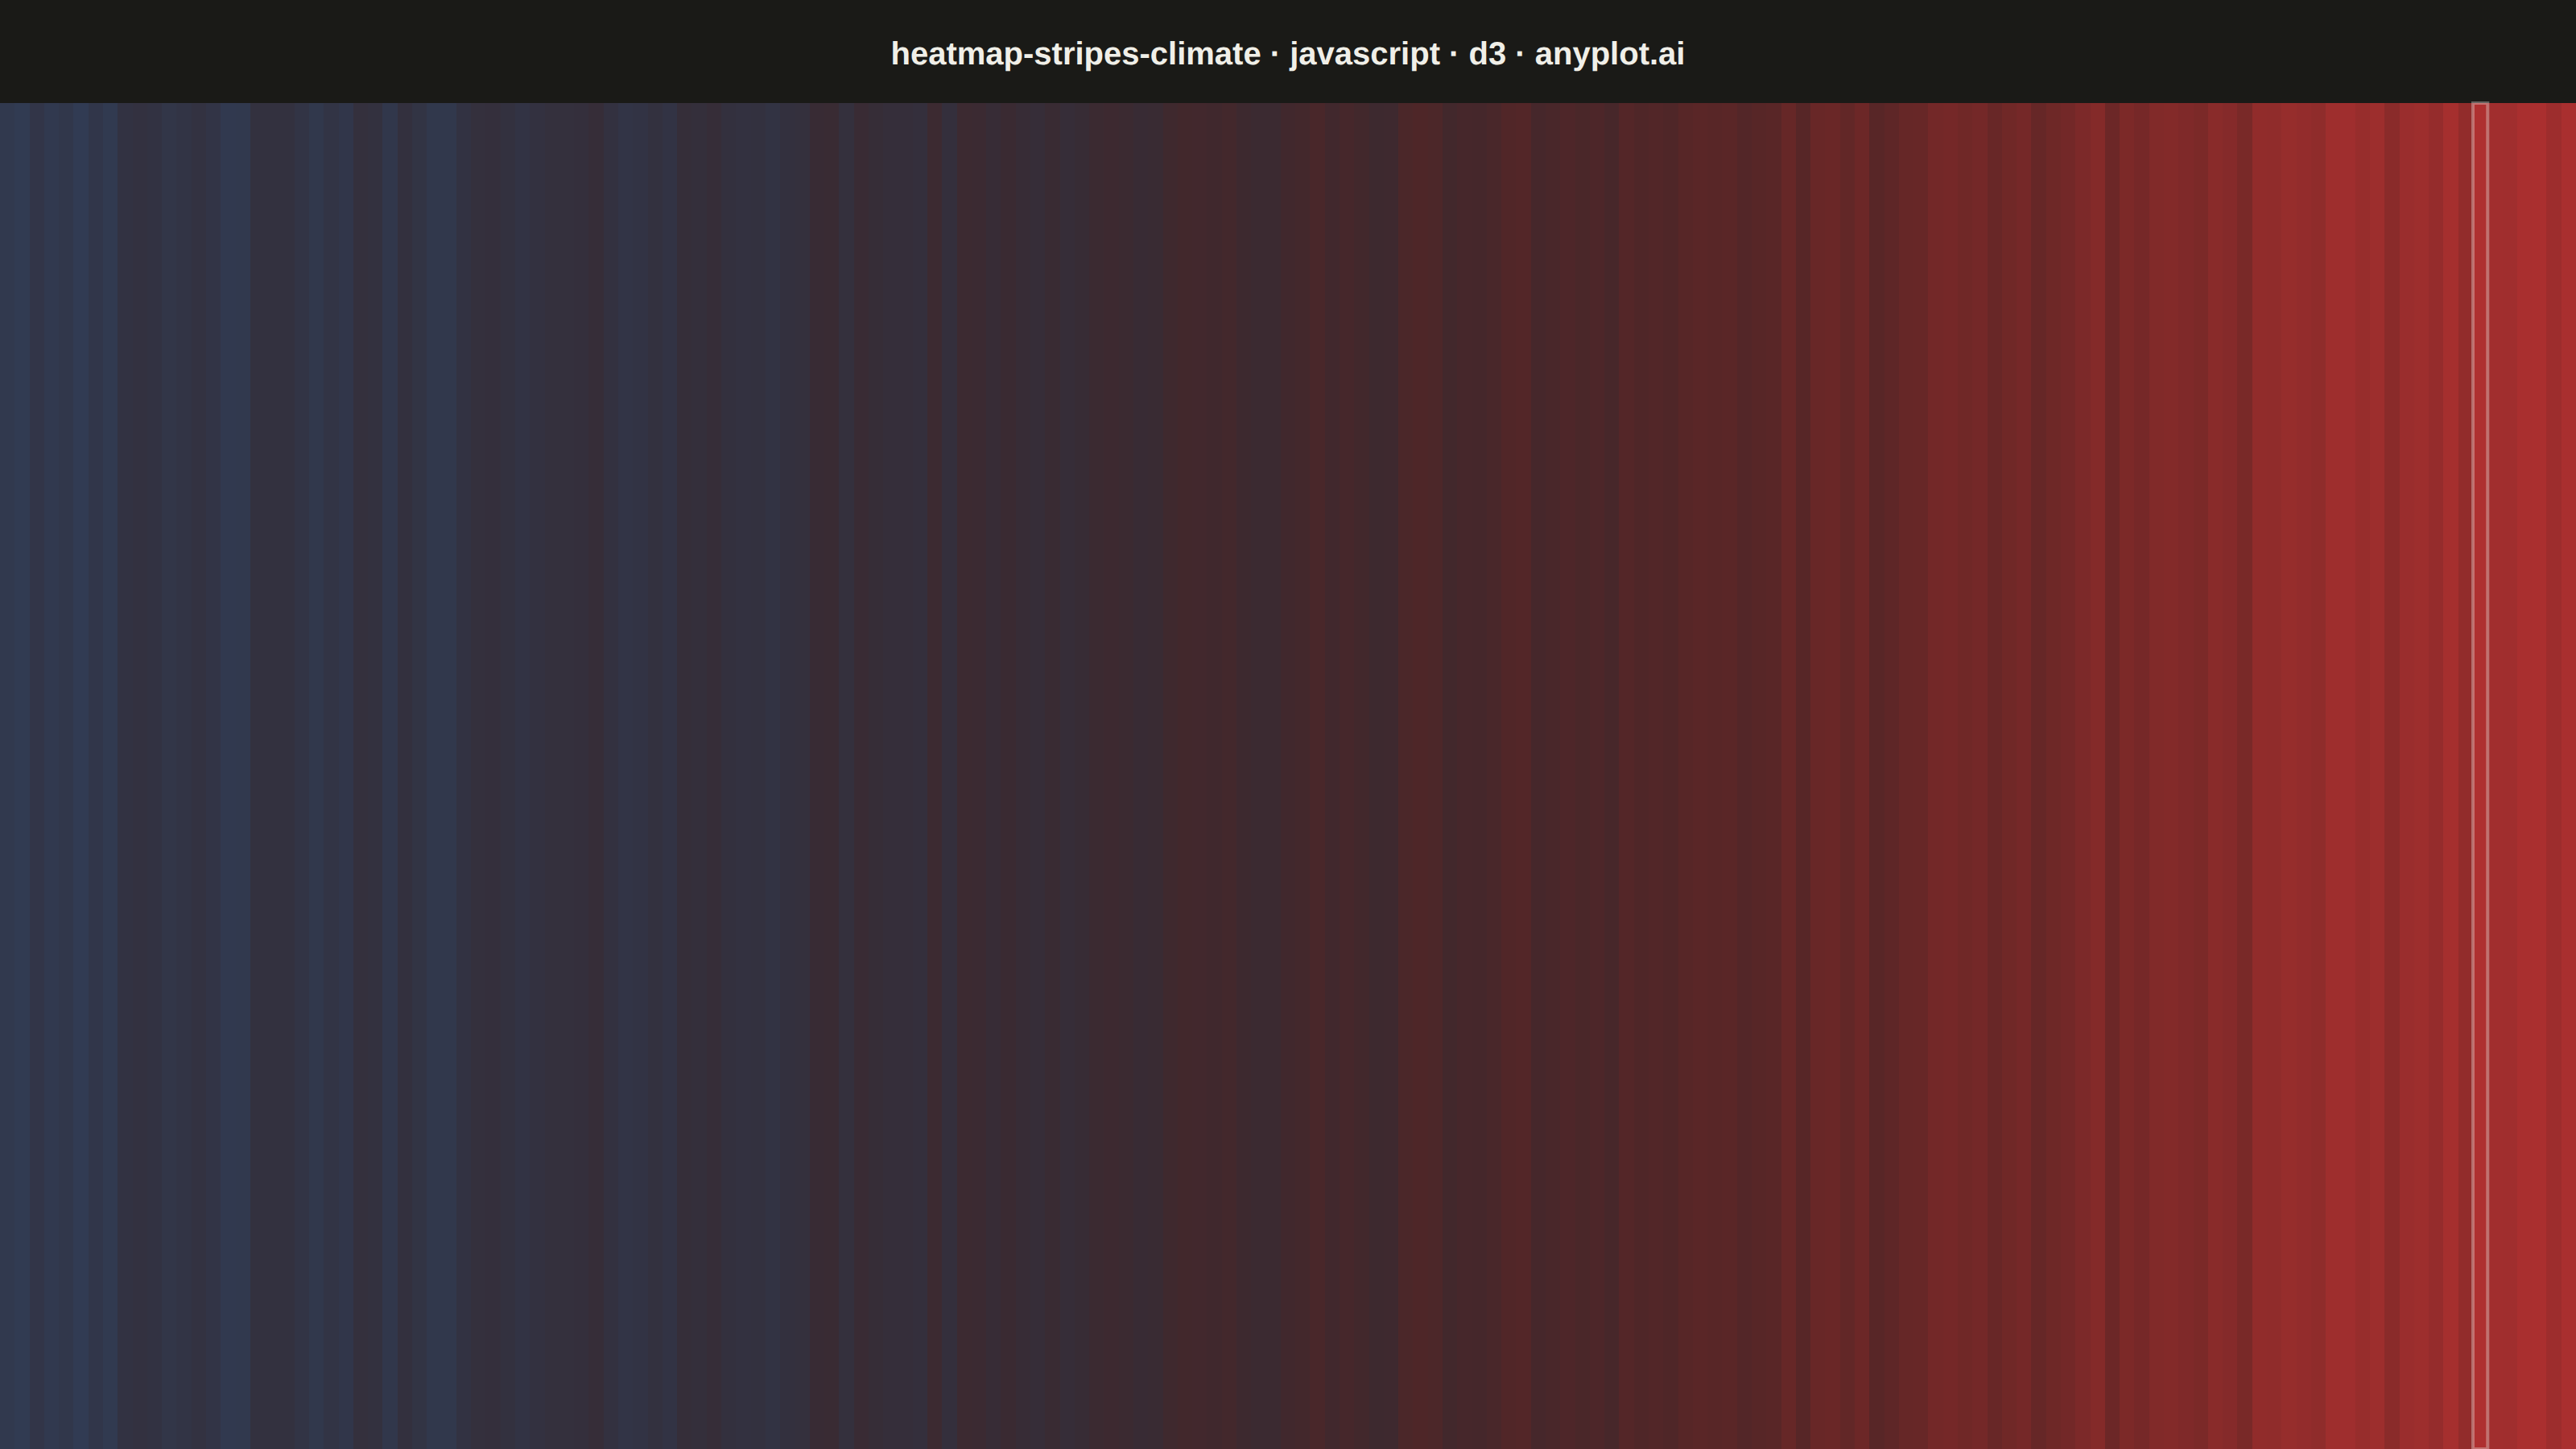
Climate warming stripes (also known as "warming stripes") display temperature anomaly data as a sequence of vertical colored bars, one per year, using a blue-to-red diverging colormap. Created by climate scientist Ed Hawkins, this minimalist visualization strips away axes, labels, and gridlines to communicate long-term warming trends through pure color encoding. The progression from cool blues to warm reds makes temperature change immediately visible at a glance.
// anyplot.ai
// heatmap-stripes-climate: Climate Warming Stripes
// Library: d3 7.9.0 | JavaScript 22.23.2
// Quality: 95/100 | Created: 2026-08-25

const t = window.ANYPLOT_TOKENS;
const { width, height } = window.ANYPLOT_SIZE;
const titleArea = 64;

// --- Data: global mean temperature anomaly, 1850-2024, °C vs 1961-1990 baseline
// Deterministic LCG (browser has no seeded Math.random) -----------------------
let seed = 42;
function lcgNoise() {
  seed = (seed * 1664525 + 1013904223) % 4294967296;
  return seed / 4294967296 - 0.5;
}

const startYear = 1850;
const endYear = 2024;
const years = d3.range(startYear, endYear + 1);
const anomalies = years.map((year) => {
  const progress = (year - startYear) / (endYear - startYear);
  // Long-term warming trend: slow pre-industrial drift, sharp post-1980 rise.
  const trend = -0.35 + 1.55 * Math.pow(progress, 1.7);
  const noise = lcgNoise() * 0.24;
  return trend + noise;
});

// --- SVG mount ----------------------------------------------------------------
const svg = d3.select("#container").append("svg").attr("width", width).attr("height", height);

// --- Color scale: symmetric diverging, cold->blue, warm->red (Imprint stops) --
// Semantic exception (temperature hot->red / cold->blue) — reorder the Imprint
// diverging stops so negative anomalies read blue and positive anomalies read red.
const extent = d3.max(anomalies, (d) => Math.abs(d));
const stripeColor = d3
  .scaleSequential(d3.interpolateRgbBasis([t.div[2], t.div[1], t.div[0]]))
  .domain([-extent, extent]);

// --- Stripes: equal-width bands, no gaps, edge-to-edge --------------------------
// Rendered as a single defs-based linearGradient (D3 data-join of <stop>
// elements) rather than per-bar solid fills — a more SVG/D3-native way to
// express a continuous, data-driven color transition.
const x = d3.scaleBand().domain(years).range([0, width]).padding(0);
const stripeTop = titleArea;
const stripeHeight = height - titleArea;

const stops = years.flatMap((year, i) => {
  const color = stripeColor(anomalies[i]);
  const startPct = (x(year) / width) * 100;
  const endPct = ((x(year) + x.bandwidth()) / width) * 100;
  return [
    { offset: startPct, color },
    { offset: endPct, color },
  ];
});

svg
  .append("defs")
  .append("linearGradient")
  .attr("id", "stripe-gradient")
  .attr("x1", "0%")
  .attr("x2", "100%")
  .attr("y1", "0%")
  .attr("y2", "0%")
  .selectAll("stop")
  .data(stops)
  .join("stop")
  .attr("offset", (d) => `${d.offset}%`)
  .attr("stop-color", (d) => d.color);

svg
  .append("rect")
  .attr("x", 0)
  .attr("y", stripeTop)
  .attr("width", width)
  .attr("height", stripeHeight)
  .attr("fill", "url(#stripe-gradient)");

// --- Record-warmest emphasis: subtle chrome-only outline, no new data encoding -
// Adds a light storytelling layer (the single hottest year on record) without
// introducing axes, labels, or gridlines; the outline uses theme ink, so it
// flips between light/dark like the rest of the chrome while the data fill
// underneath stays pixel-identical across themes.
const recordHotIndex = d3.maxIndex(anomalies);
svg
  .append("rect")
  .attr("x", x(years[recordHotIndex]))
  .attr("y", stripeTop)
  .attr("width", x.bandwidth())
  .attr("height", stripeHeight)
  .attr("fill", "none")
  .attr("stroke", t.ink)
  .attr("stroke-opacity", 0.35)
  .attr("stroke-width", 2);

// --- Title ----------------------------------------------------------------------
svg
  .append("text")
  .attr("x", width / 2)
  .attr("y", 40)
  .attr("text-anchor", "middle")
  .attr("fill", t.ink)
  .style("font-size", "20px")
  .style("font-weight", "600")
  .text("heatmap-stripes-climate · javascript · d3 · anyplot.ai");
Runnable source as JSON, for any HTTP client: https://api.anyplot.ai/specs/heatmap-stripes-climate/d3/code. Any spec id and library id listed in llms-full.txt fit the same URL shape; every URL below is complete and callable.
{
  "spec_id": "heatmap-stripes-climate",
  "language": "javascript",
  "library": "d3",
  "page": "https://anyplot.ai/heatmap-stripes-climate/javascript/d3",
  "hub": "https://anyplot.ai/heatmap-stripes-climate",
  "code_json": "https://api.anyplot.ai/specs/heatmap-stripes-climate/d3/code",
  "spec_json": "https://api.anyplot.ai/specs/heatmap-stripes-climate",
  "render_light_png": "https://storage.googleapis.com/anyplot-images/plots/heatmap-stripes-climate/javascript/d3/plot-light.png",
  "render_dark_png": "https://storage.googleapis.com/anyplot-images/plots/heatmap-stripes-climate/javascript/d3/plot-dark.png",
  "interactive_light_html": "https://storage.googleapis.com/anyplot-images/plots/heatmap-stripes-climate/javascript/d3/plot-light.html",
  "interactive_dark_html": "https://storage.googleapis.com/anyplot-images/plots/heatmap-stripes-climate/javascript/d3/plot-dark.html",
  "quality_score": 95.0,
  "license": "MIT",
  "guide": "https://anyplot.ai/llms.txt"
}
Part of Climate Warming Stripes on anyplot.ai.