The same plot in 14 other libraries — JavaScript: Chart.js, D3.js, Apache ECharts, Highcharts; Python: Altair, Bokeh, lets-plot, Matplotlib, Plotly, plotnine, Pygal, Seaborn; R: ggplot2; Julia: Makie.jl. Compare all 15 side by side: Climate Warming Stripes in Python, R, Julia and JavaScript.
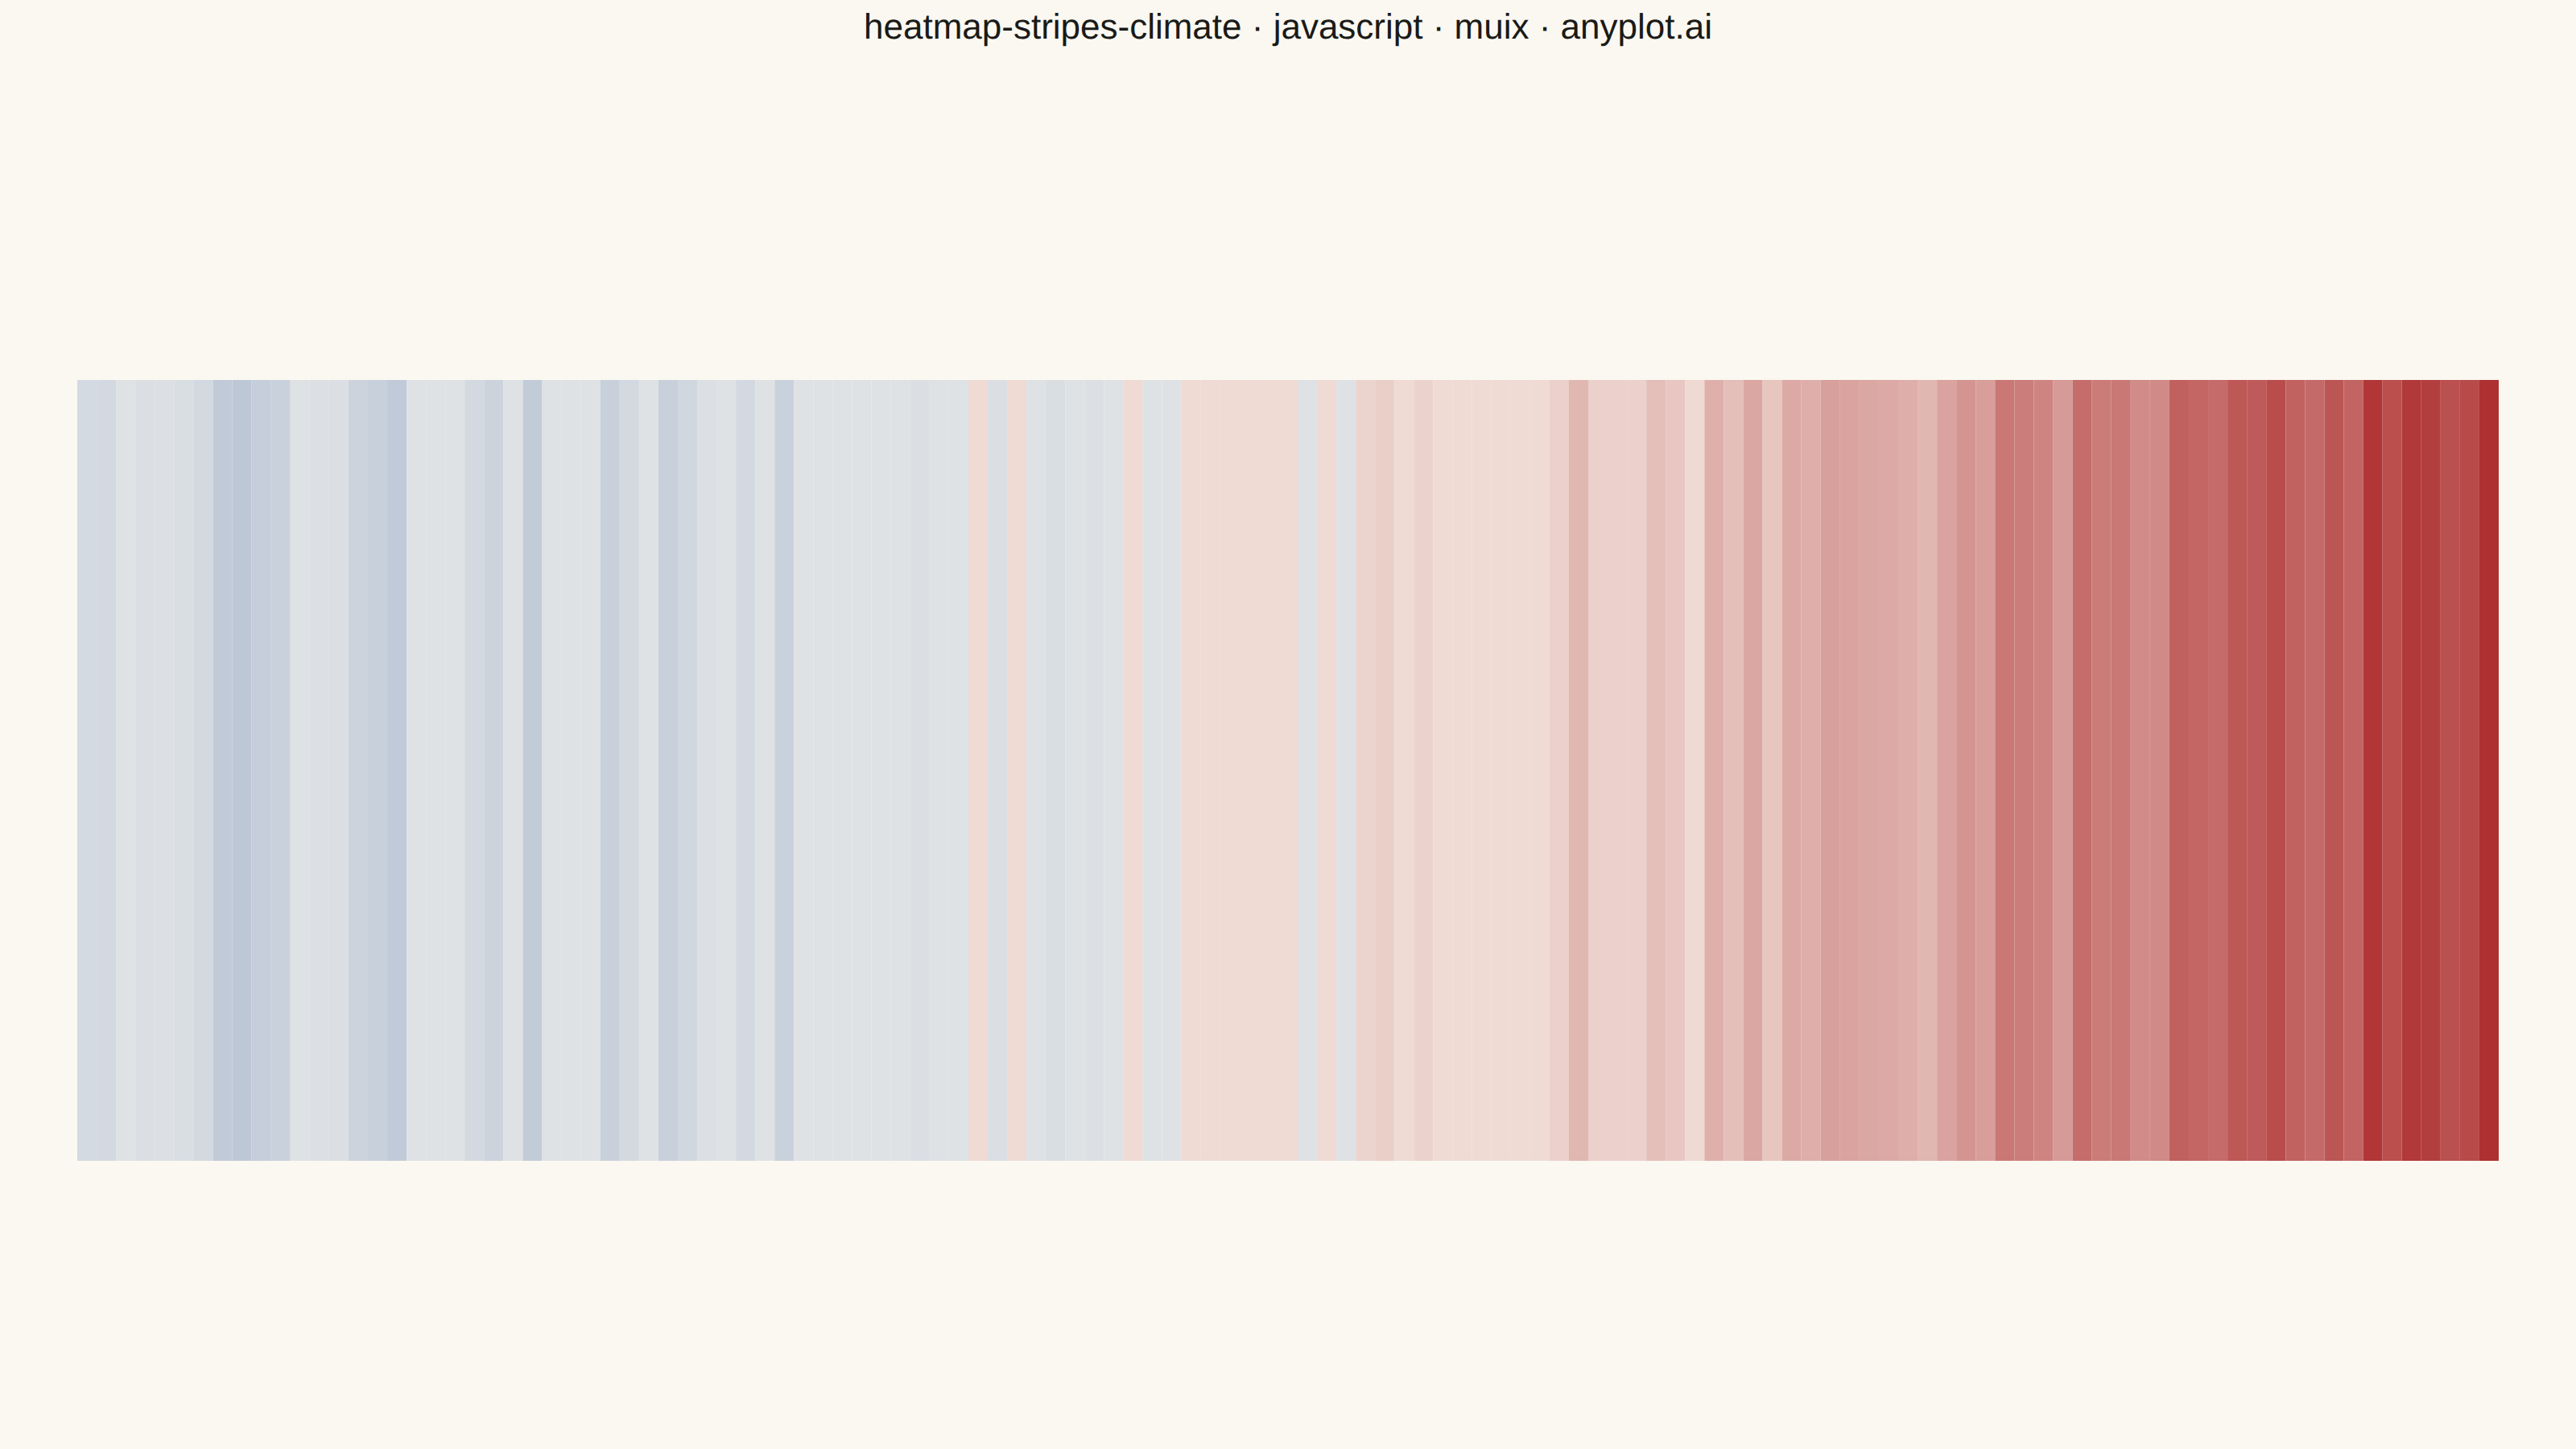
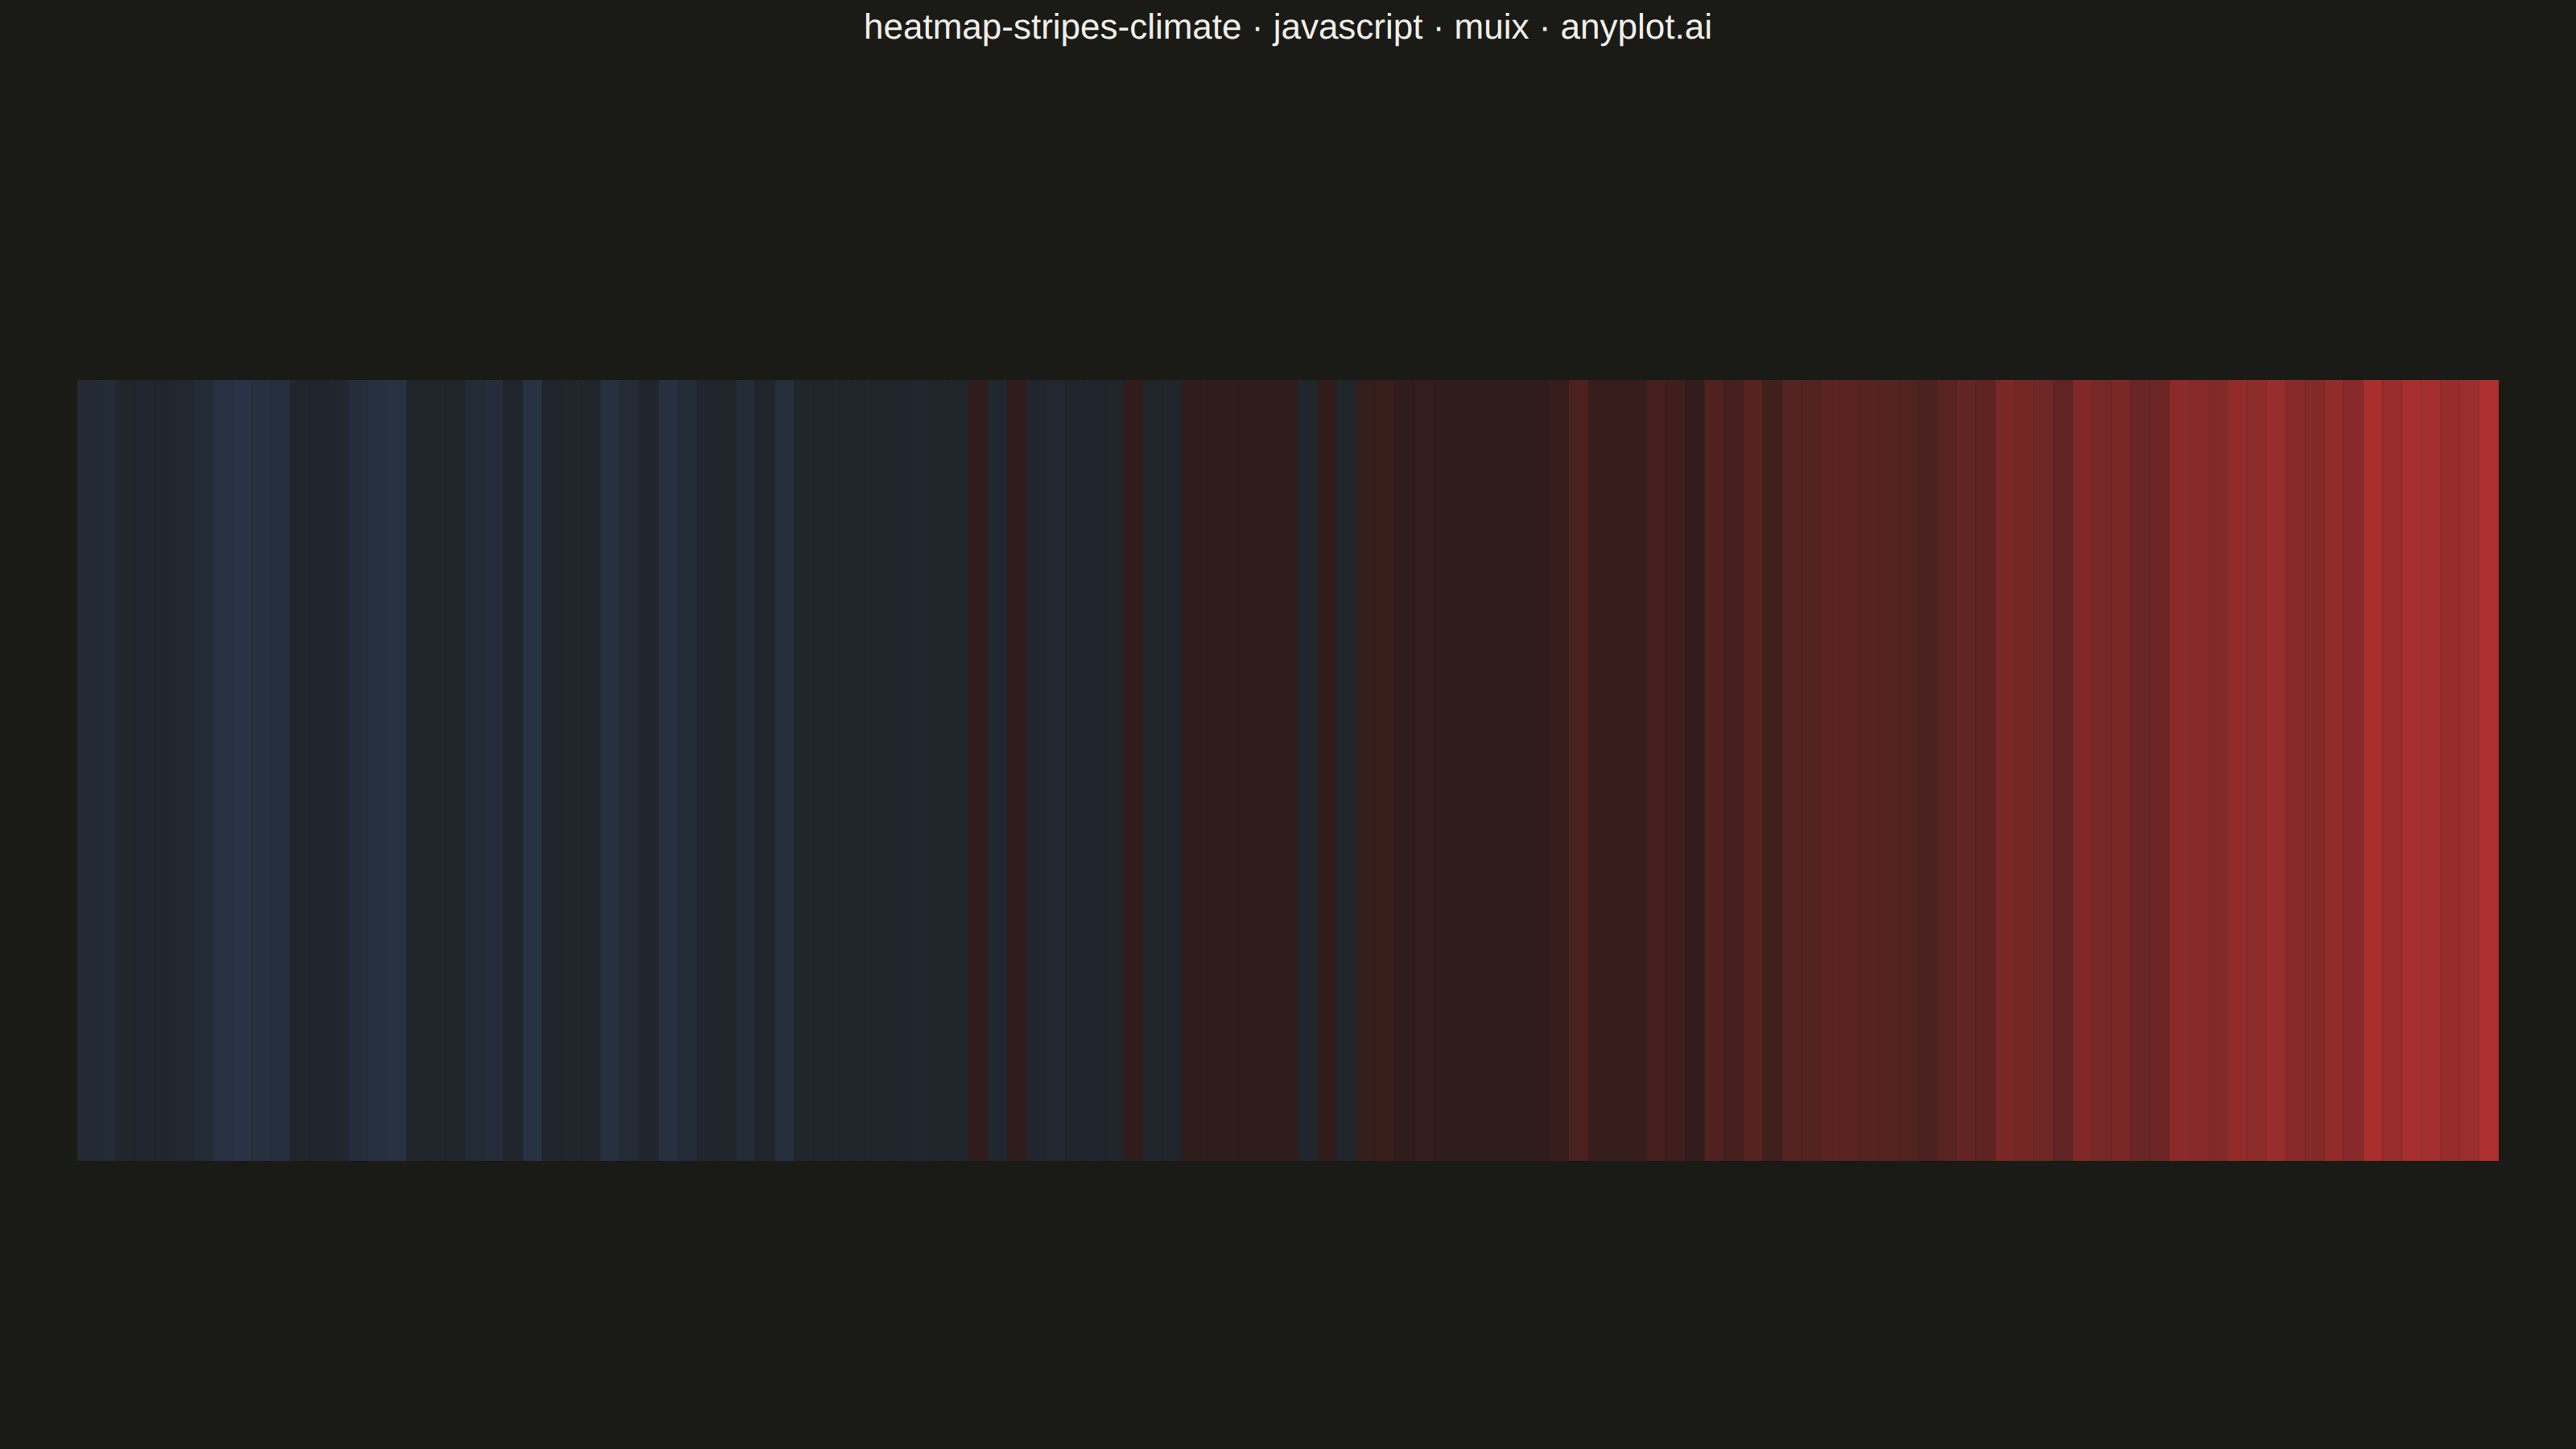
Climate warming stripes (also known as "warming stripes") display temperature anomaly data as a sequence of vertical colored bars, one per year, using a blue-to-red diverging colormap. Created by climate scientist Ed Hawkins, this minimalist visualization strips away axes, labels, and gridlines to communicate long-term warming trends through pure color encoding. The progression from cool blues to warm reds makes temperature change immediately visible at a glance.
// anyplot.ai
// heatmap-stripes-climate: Climate Warming Stripes
// Library: muix 7.29.1 | JavaScript 22.23.2
// Quality: 87/100 | Created: 2026-08-25
//# anyplot-orientation: landscape
// anyplot.ai
// heatmap-stripes-climate: Climate Warming Stripes
// Library: MUI X Charts | React | Node 22
// License: @mui/x-charts — MIT (community). Pro/Premium are out of scope.
// Quality: pending | Created: 2026-08-25
import { BarChart } from "@mui/x-charts/BarChart";
import Box from "@mui/material/Box";
import Typography from "@mui/material/Typography";

const tokens = window.ANYPLOT_TOKENS;

// --- Data (in-memory, deterministic) ----------------------------------------
// Synthetic global-mean temperature anomaly (°C, vs. a 1961-1990-style
// baseline) for 1900-2024 — a tiny LCG stands in for a seeded RNG since the
// browser has no Math.random() seed.
function lcg(seed) {
  let state = seed;
  return () => {
    state = (state * 1103515245 + 12345) & 0x7fffffff;
    return state / 0x7fffffff;
  };
}
const random = lcg(42);

const startYear = 1900;
const endYear = 2024;
const years = [];
const anomalies = [];
for (let year = startYear; year <= endYear; year += 1) {
  const progress = (year - startYear) / (endYear - startYear);
  const trend = -0.25 + 1.35 * progress ** 2.2; // slow start, accelerating post-1975 warming
  const noise = (random() - 0.5) * 0.28;
  years.push(year);
  anomalies.push(Math.round((trend + noise) * 100) / 100);
}
const maxAbsAnomaly = Math.max(...anomalies.map(Math.abs));

// --- Diverging color scale (Imprint imprint_div: cold blue -> midpoint -> warm red) ---
// Bar height stays constant (see `heights` below) — only color encodes the
// anomaly, the defining trait of the warming-stripes form.
function hexToRgb(hex) {
  const clean = hex.replace("#", "");
  return [parseInt(clean.slice(0, 2), 16), parseInt(clean.slice(2, 4), 16), parseInt(clean.slice(4, 6), 16)];
}
function mixColor(from, to, fraction) {
  const [r1, g1, b1] = hexToRgb(from);
  const [r2, g2, b2] = hexToRgb(to);
  const r = Math.round(r1 + (r2 - r1) * fraction);
  const g = Math.round(g1 + (g2 - g1) * fraction);
  const b = Math.round(b1 + (b2 - b1) * fraction);
  return `rgb(${r}, ${g}, ${b})`;
}
const COLD = tokens.div[2]; // Imprint imprint_div — blue, cold anomalies
const MID = tokens.div[1]; // Imprint imprint_div — theme-adaptive midpoint (zero anomaly)
const HOT = tokens.div[0]; // Imprint imprint_div — matte red, warm anomalies
// The diverging midpoint token is the theme-adaptive page background, so a
// fraction that reaches exactly 0 mixes to a color pixel-identical to the
// backdrop and the bar disappears. Floor the magnitude so every bar keeps a
// faint but real, non-zero-contrast tint — the fixed red/blue endpoints are
// untouched since |fraction| is already >= this floor near them.
const MIN_FRACTION = 0.15;
function anomalyToColor(value) {
  const rawFraction = value / maxAbsAnomaly; // symmetric around zero, per spec
  const sign = rawFraction < 0 ? -1 : 1;
  const fraction = sign * Math.max(MIN_FRACTION, Math.abs(rawFraction));
  return fraction < 0 ? mixColor(MID, COLD, -fraction) : mixColor(MID, HOT, fraction);
}
const stripeColors = anomalies.map(anomalyToColor);

// Uniform bar height — the stripe form encodes the anomaly purely through
// color, never through height, so every bar spans the full drawing area.
const heights = years.map(() => 1);

// --- Chart (default-exported component — the harness mounts it) -------------
export default function Chart() {
  const stripeWidth = Math.round(window.ANYPLOT_SIZE.width * 0.94);
  const stripeHeight = Math.round(stripeWidth / 3.1); // ~3:1, per spec's "wide and short"

  return (
    <Box
      sx={{
        width: window.ANYPLOT_SIZE.width,
        height: window.ANYPLOT_SIZE.height,
        display: "flex",
        flexDirection: "column",
        alignItems: "center",
        justifyContent: "center",
      }}
    >
      <Typography sx={{ fontSize: 22, fontWeight: 500, mb: 3 }}>
        heatmap-stripes-climate · javascript · muix · anyplot.ai
      </Typography>
      <BarChart
        width={stripeWidth}
        height={stripeHeight}
        series={[
          {
            data: heights,
            color: tokens.palette[0],
            valueFormatter: (_value, context) =>
              `${years[context.dataIndex]}: ${anomalies[context.dataIndex].toFixed(2)}°C`,
          },
        ]}
        xAxis={[
          {
            scaleType: "band",
            data: years,
            categoryGapRatio: 0,
            colorMap: { type: "ordinal", values: years, colors: stripeColors },
          },
        ]}
        yAxis={[{ scaleType: "linear", min: 0, max: 1, domainLimit: "strict" }]}
        bottomAxis={null}
        leftAxis={null}
        margin={{ top: 0, right: 0, bottom: 0, left: 0 }}
        borderRadius={0}
        skipAnimation
        slotProps={{ legend: { hidden: true } }}
      />
    </Box>
  );
}
Runnable source as JSON, for any HTTP client: https://api.anyplot.ai/specs/heatmap-stripes-climate/muix/code. Any spec id and library id listed in llms-full.txt fit the same URL shape; every URL below is complete and callable.
{
  "spec_id": "heatmap-stripes-climate",
  "language": "javascript",
  "library": "muix",
  "page": "https://anyplot.ai/heatmap-stripes-climate/javascript/muix",
  "hub": "https://anyplot.ai/heatmap-stripes-climate",
  "code_json": "https://api.anyplot.ai/specs/heatmap-stripes-climate/muix/code",
  "spec_json": "https://api.anyplot.ai/specs/heatmap-stripes-climate",
  "render_light_png": "https://storage.googleapis.com/anyplot-images/plots/heatmap-stripes-climate/javascript/muix/plot-light.png",
  "render_dark_png": "https://storage.googleapis.com/anyplot-images/plots/heatmap-stripes-climate/javascript/muix/plot-dark.png",
  "interactive_light_html": "https://storage.googleapis.com/anyplot-images/plots/heatmap-stripes-climate/javascript/muix/plot-light.html",
  "interactive_dark_html": "https://storage.googleapis.com/anyplot-images/plots/heatmap-stripes-climate/javascript/muix/plot-dark.html",
  "quality_score": 87.0,
  "license": "MIT",
  "guide": "https://anyplot.ai/llms.txt"
}
Part of Climate Warming Stripes on anyplot.ai.