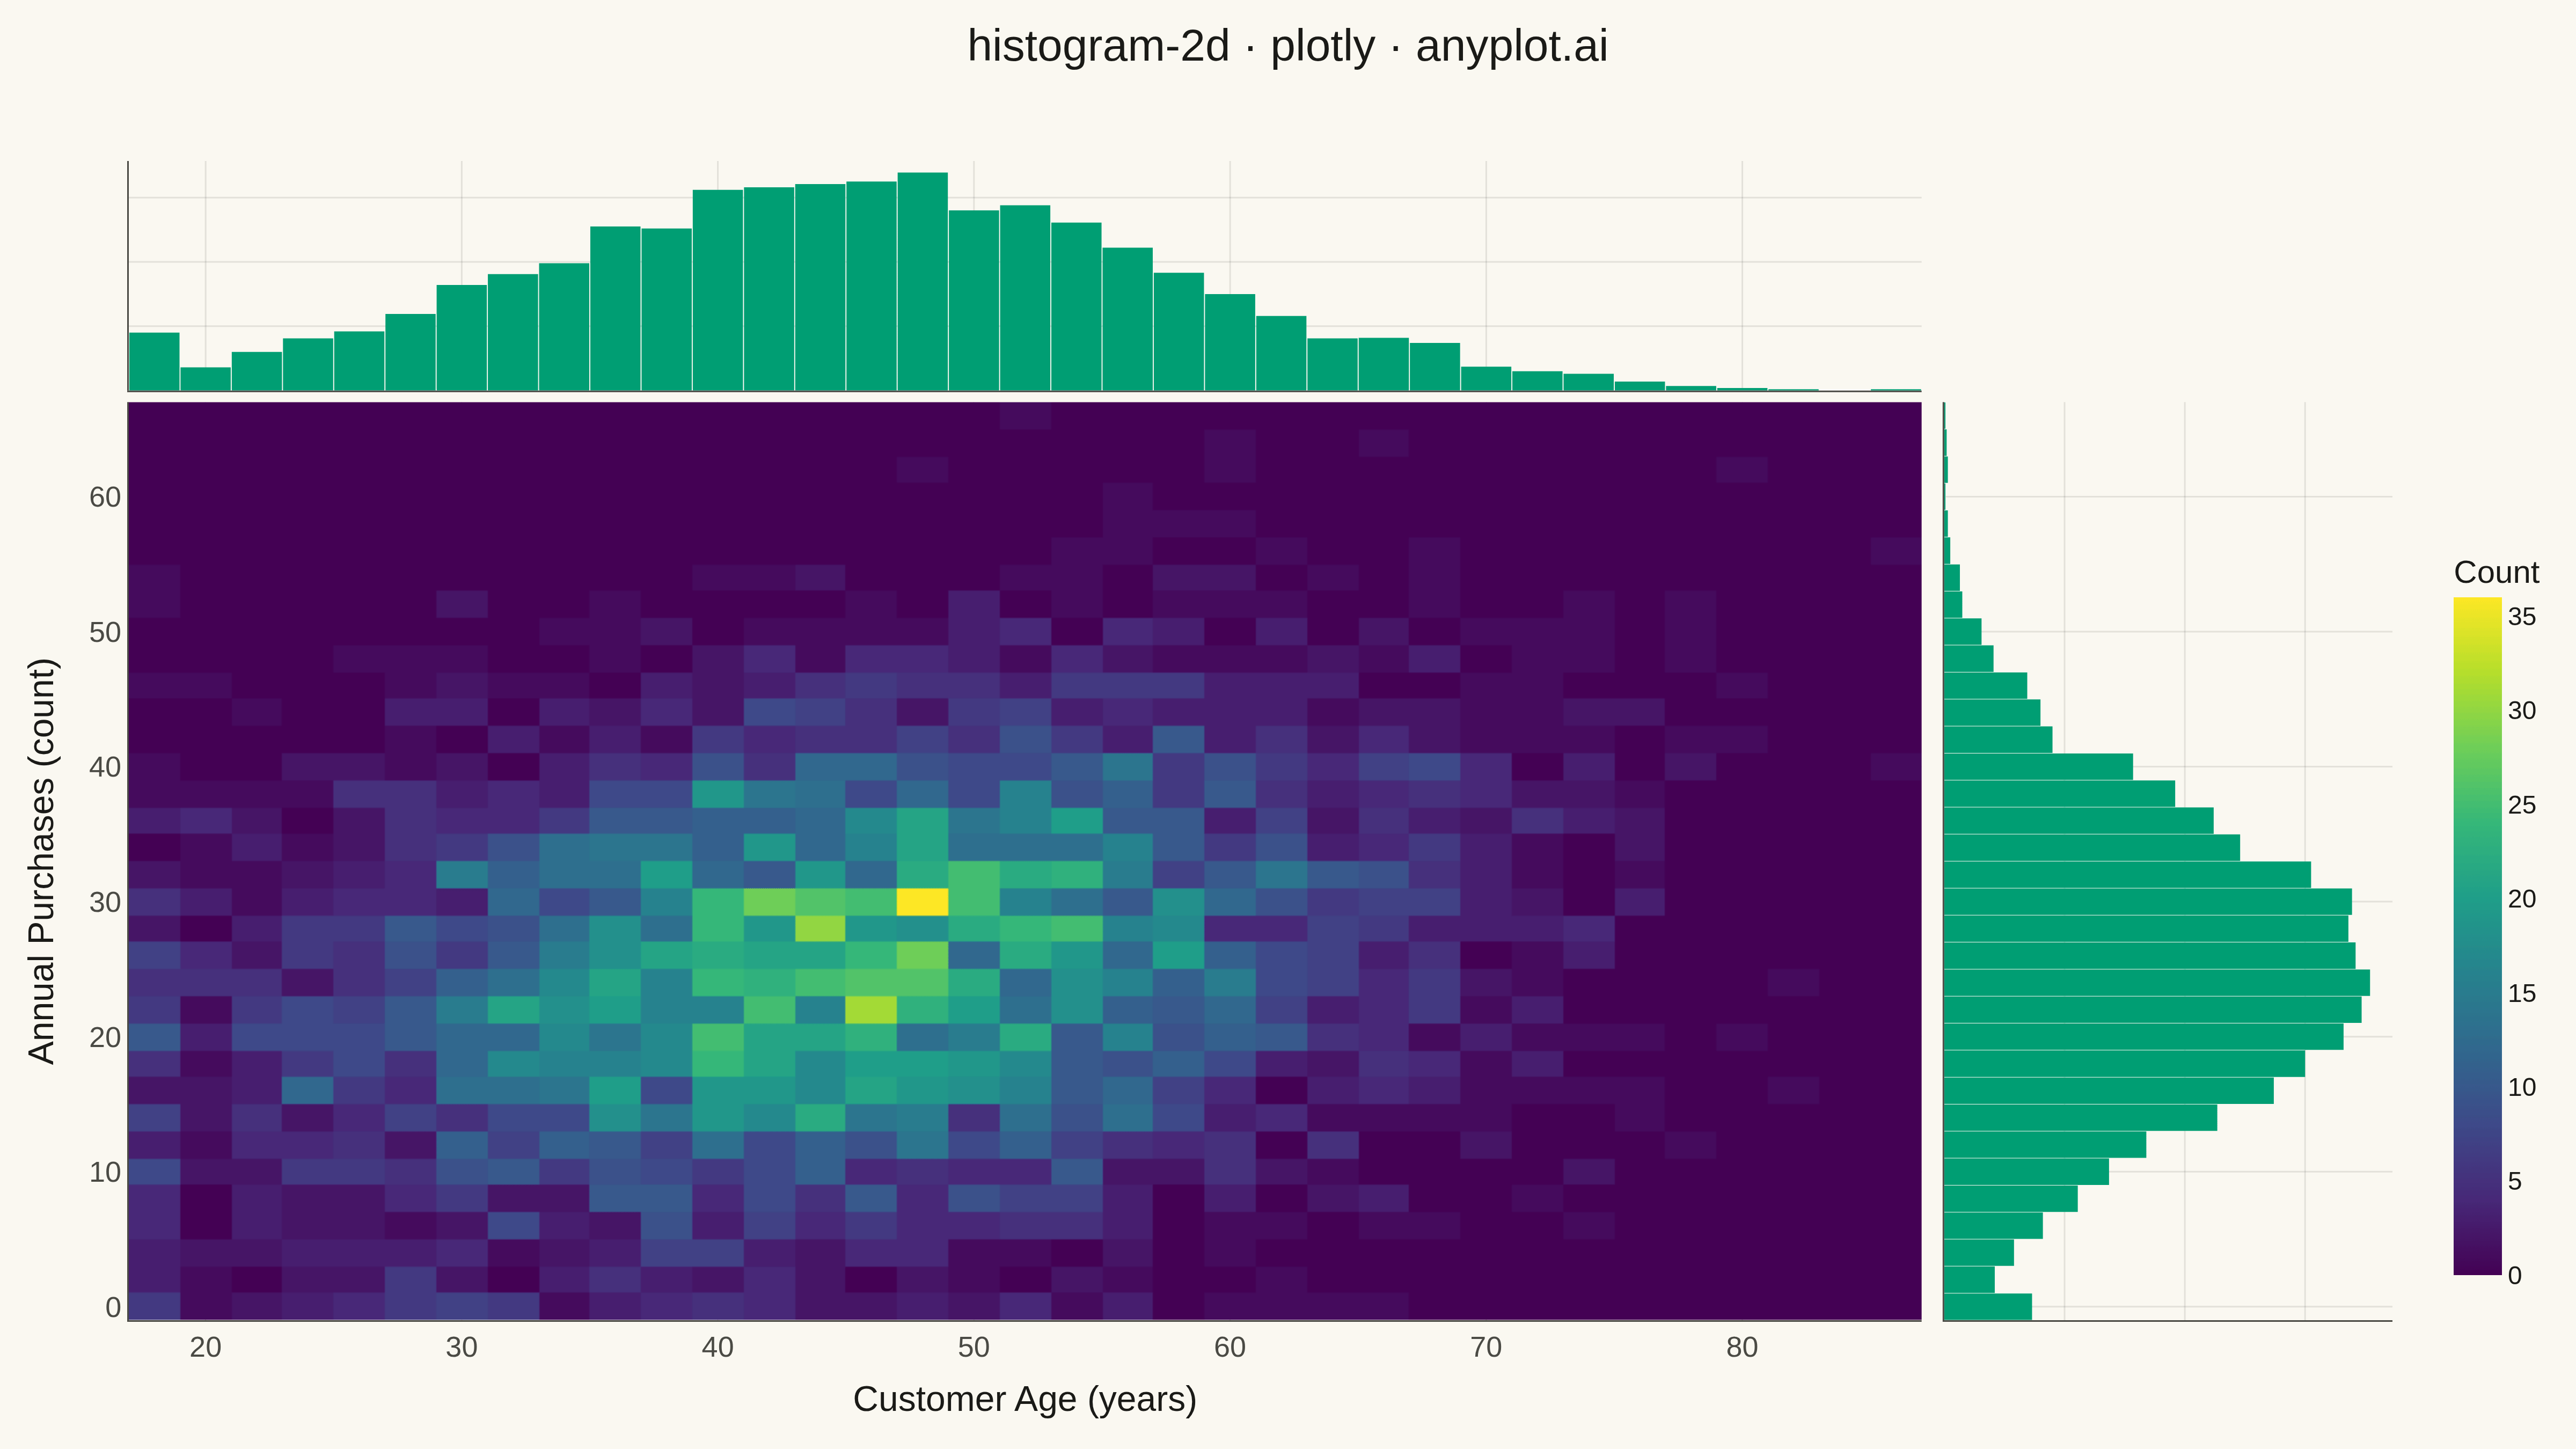
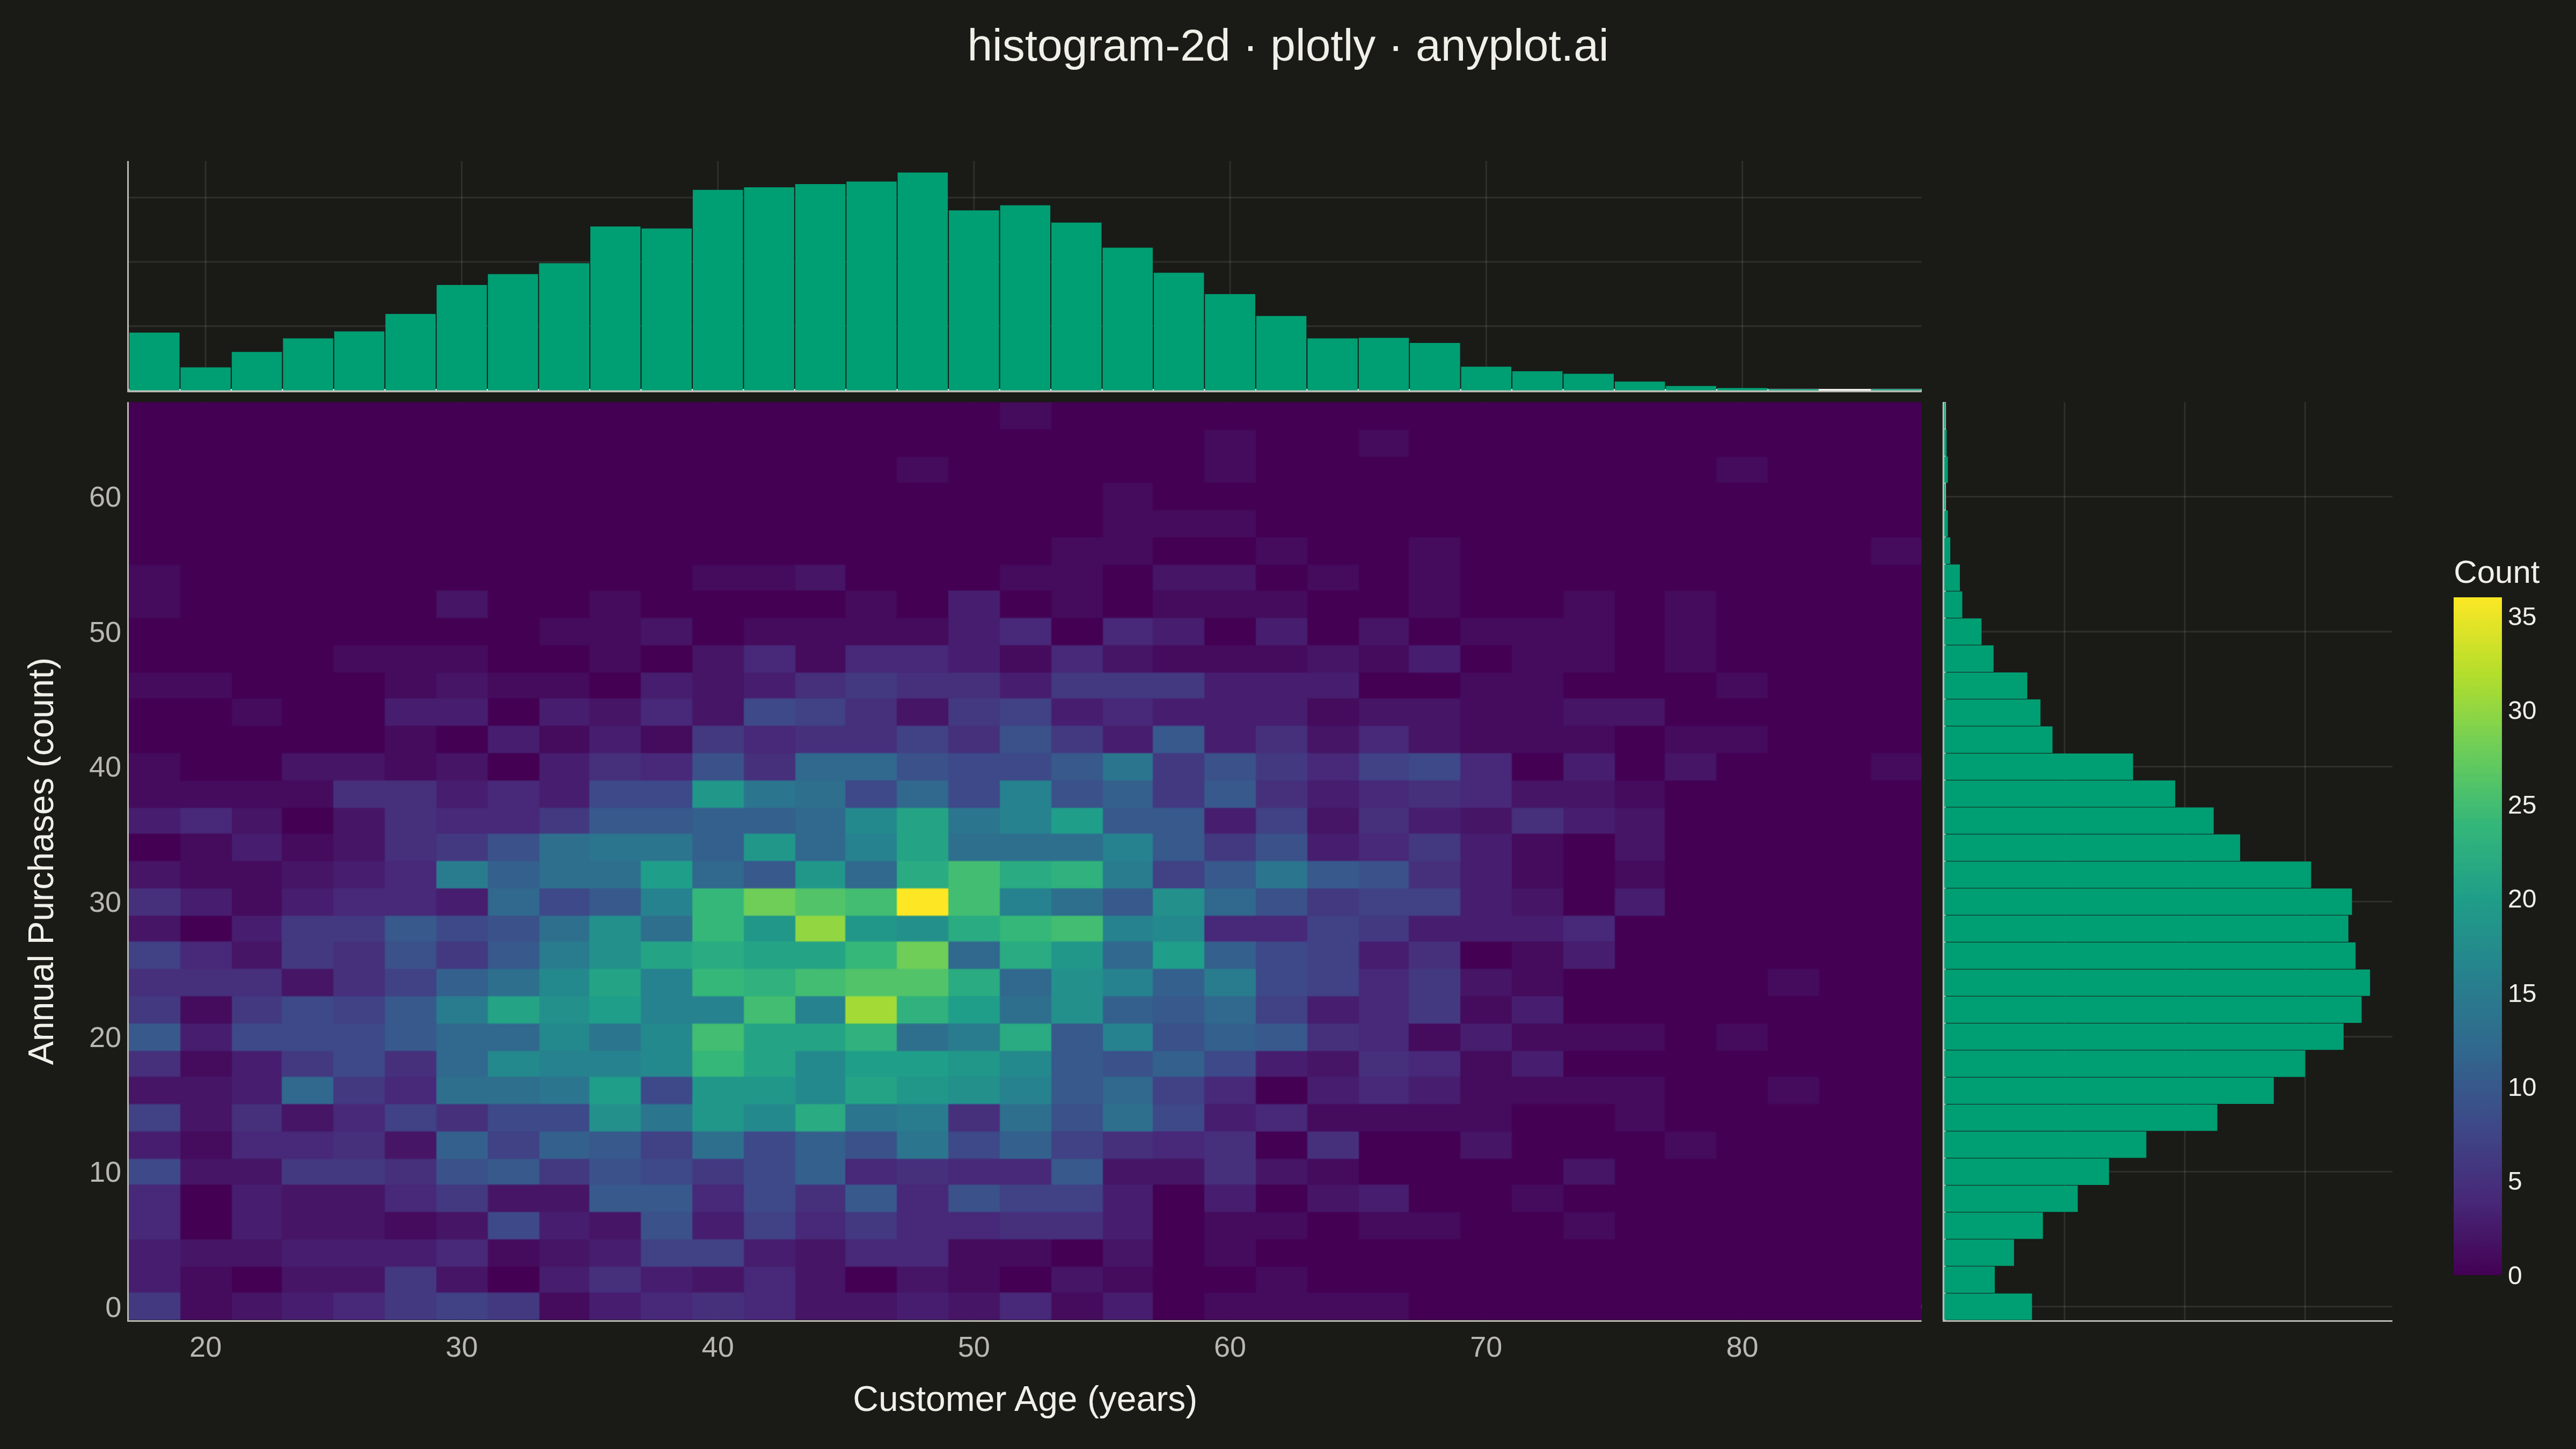
A two-dimensional histogram that displays the joint distribution of two continuous variables as a heatmap with rectangular bins. Each bin's color intensity represents the frequency or count of data points falling within that region, making it ideal for revealing density patterns, clusters, and correlations in bivariate data. Unlike scatter plots that can become cluttered with large datasets, 2D histograms effectively summarize point density.
Preview render from the Plotly implementation.