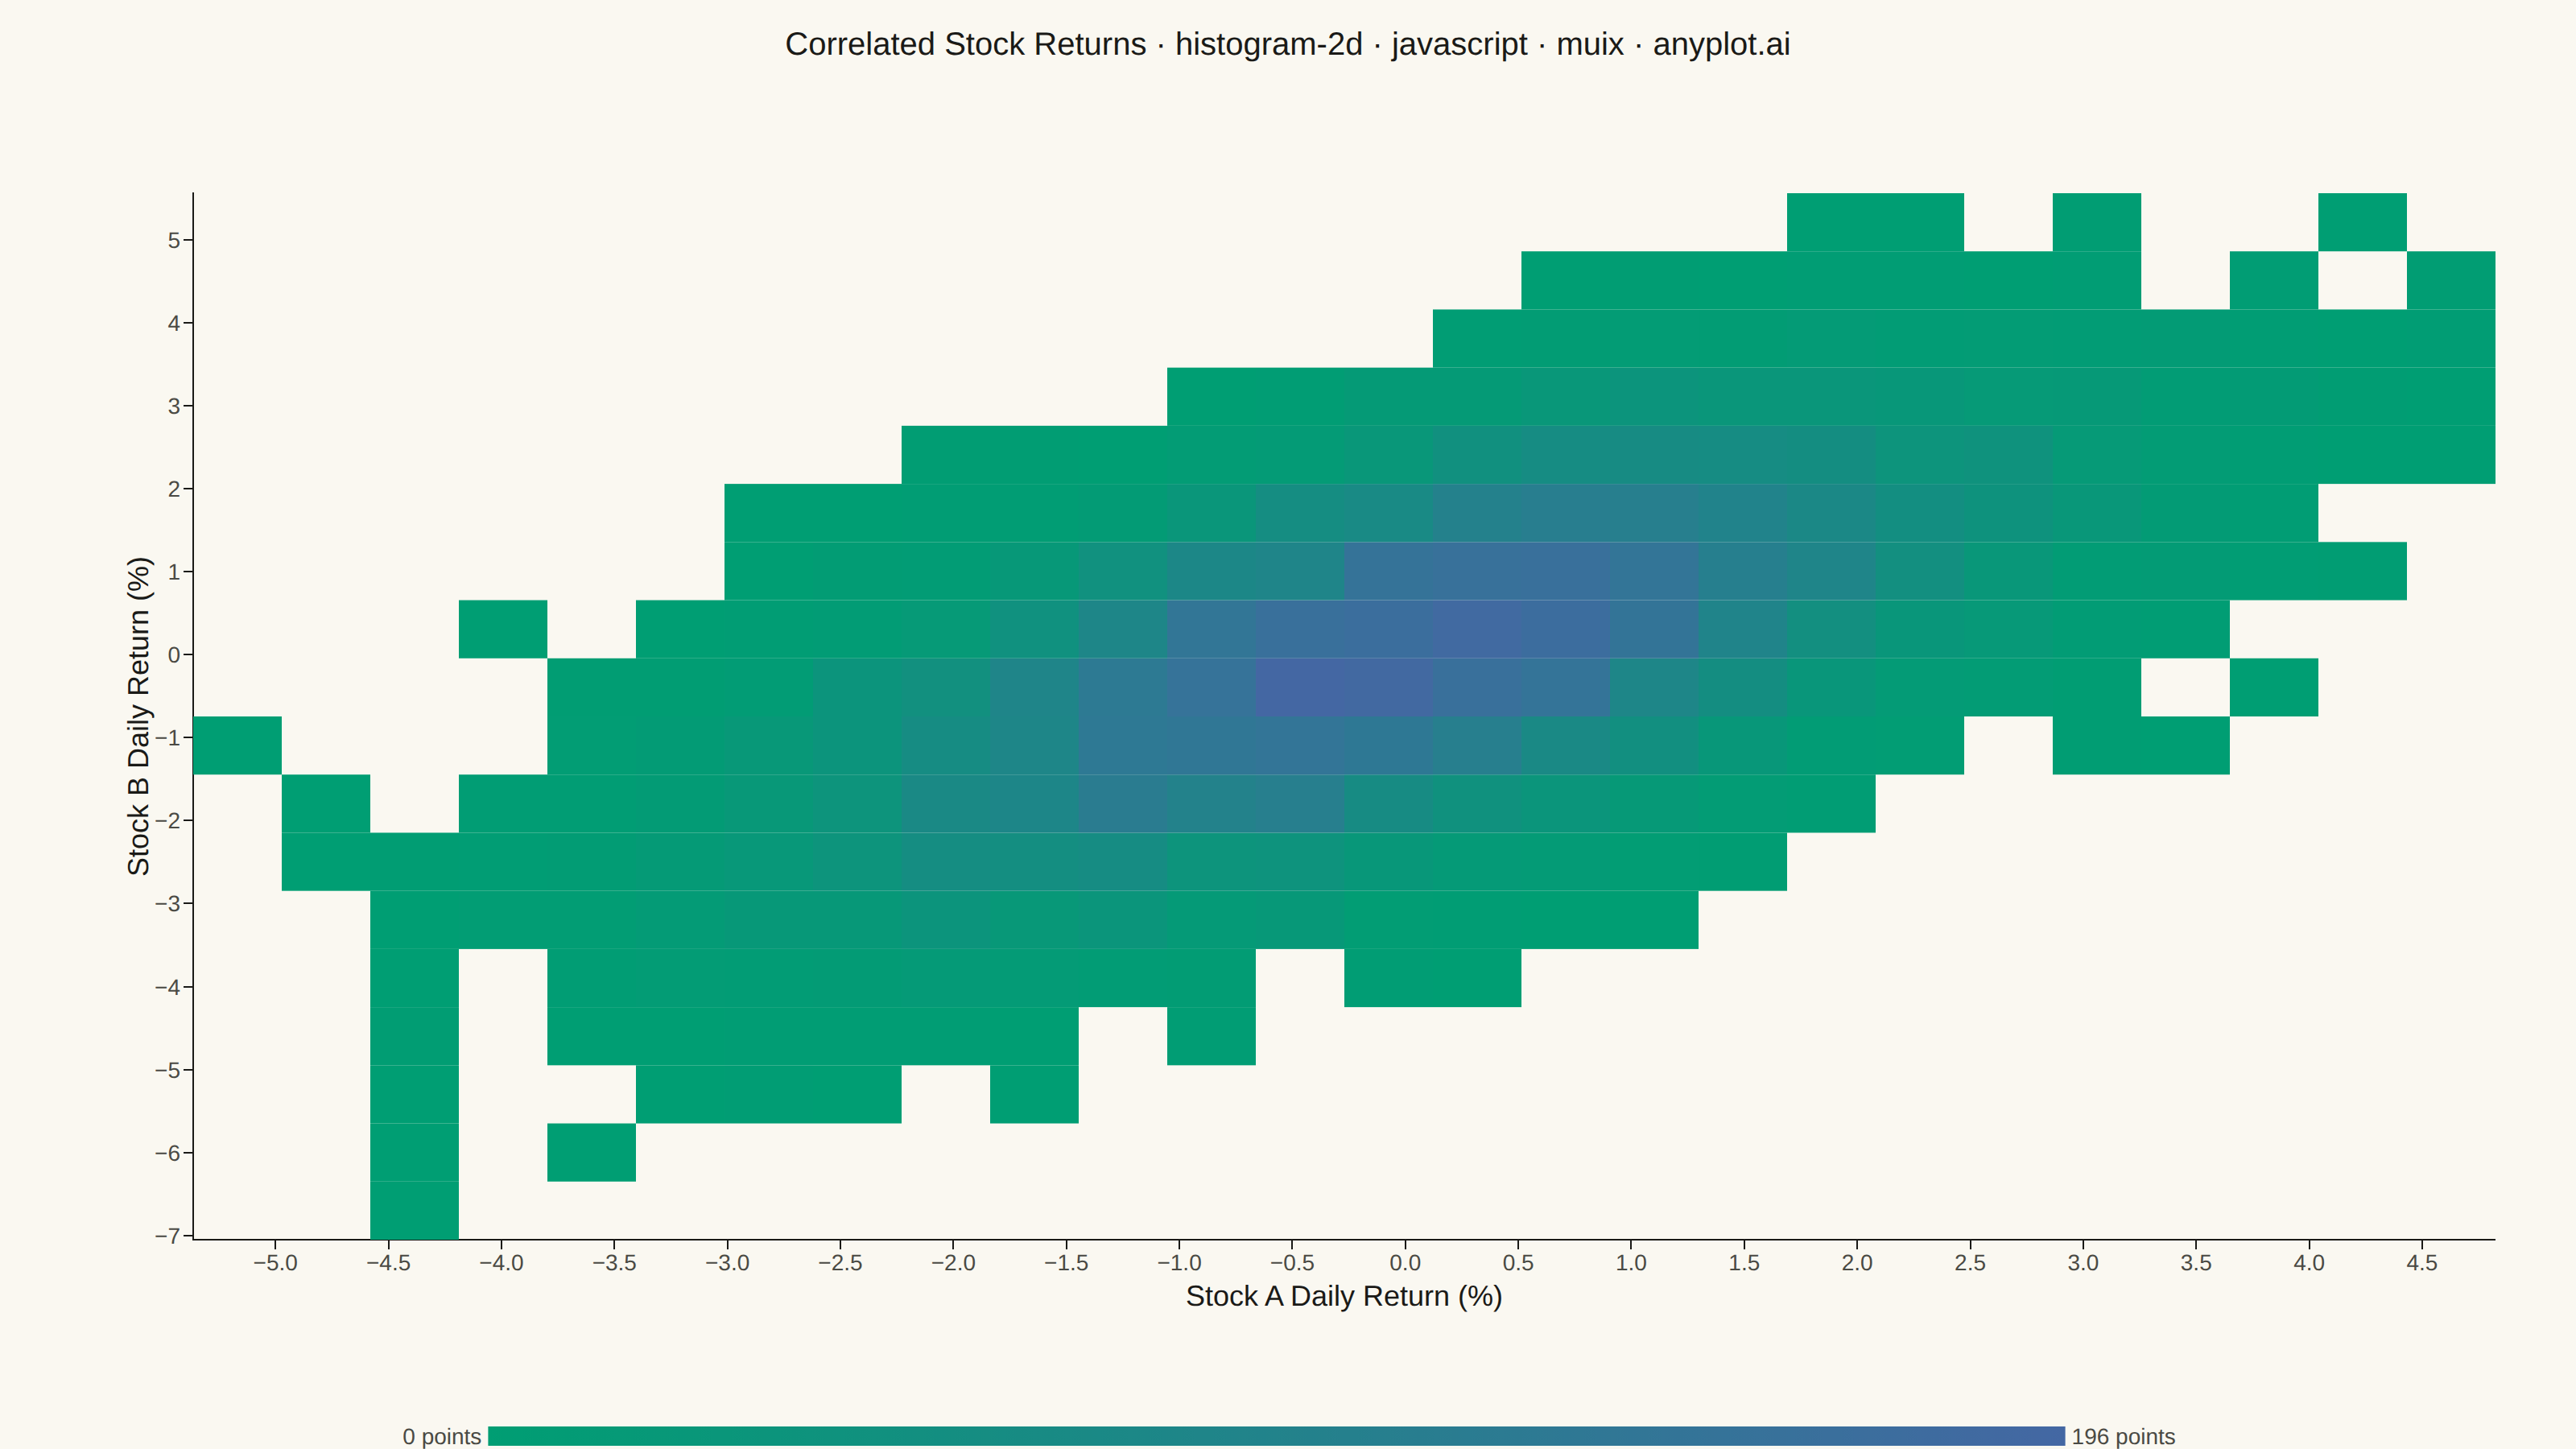
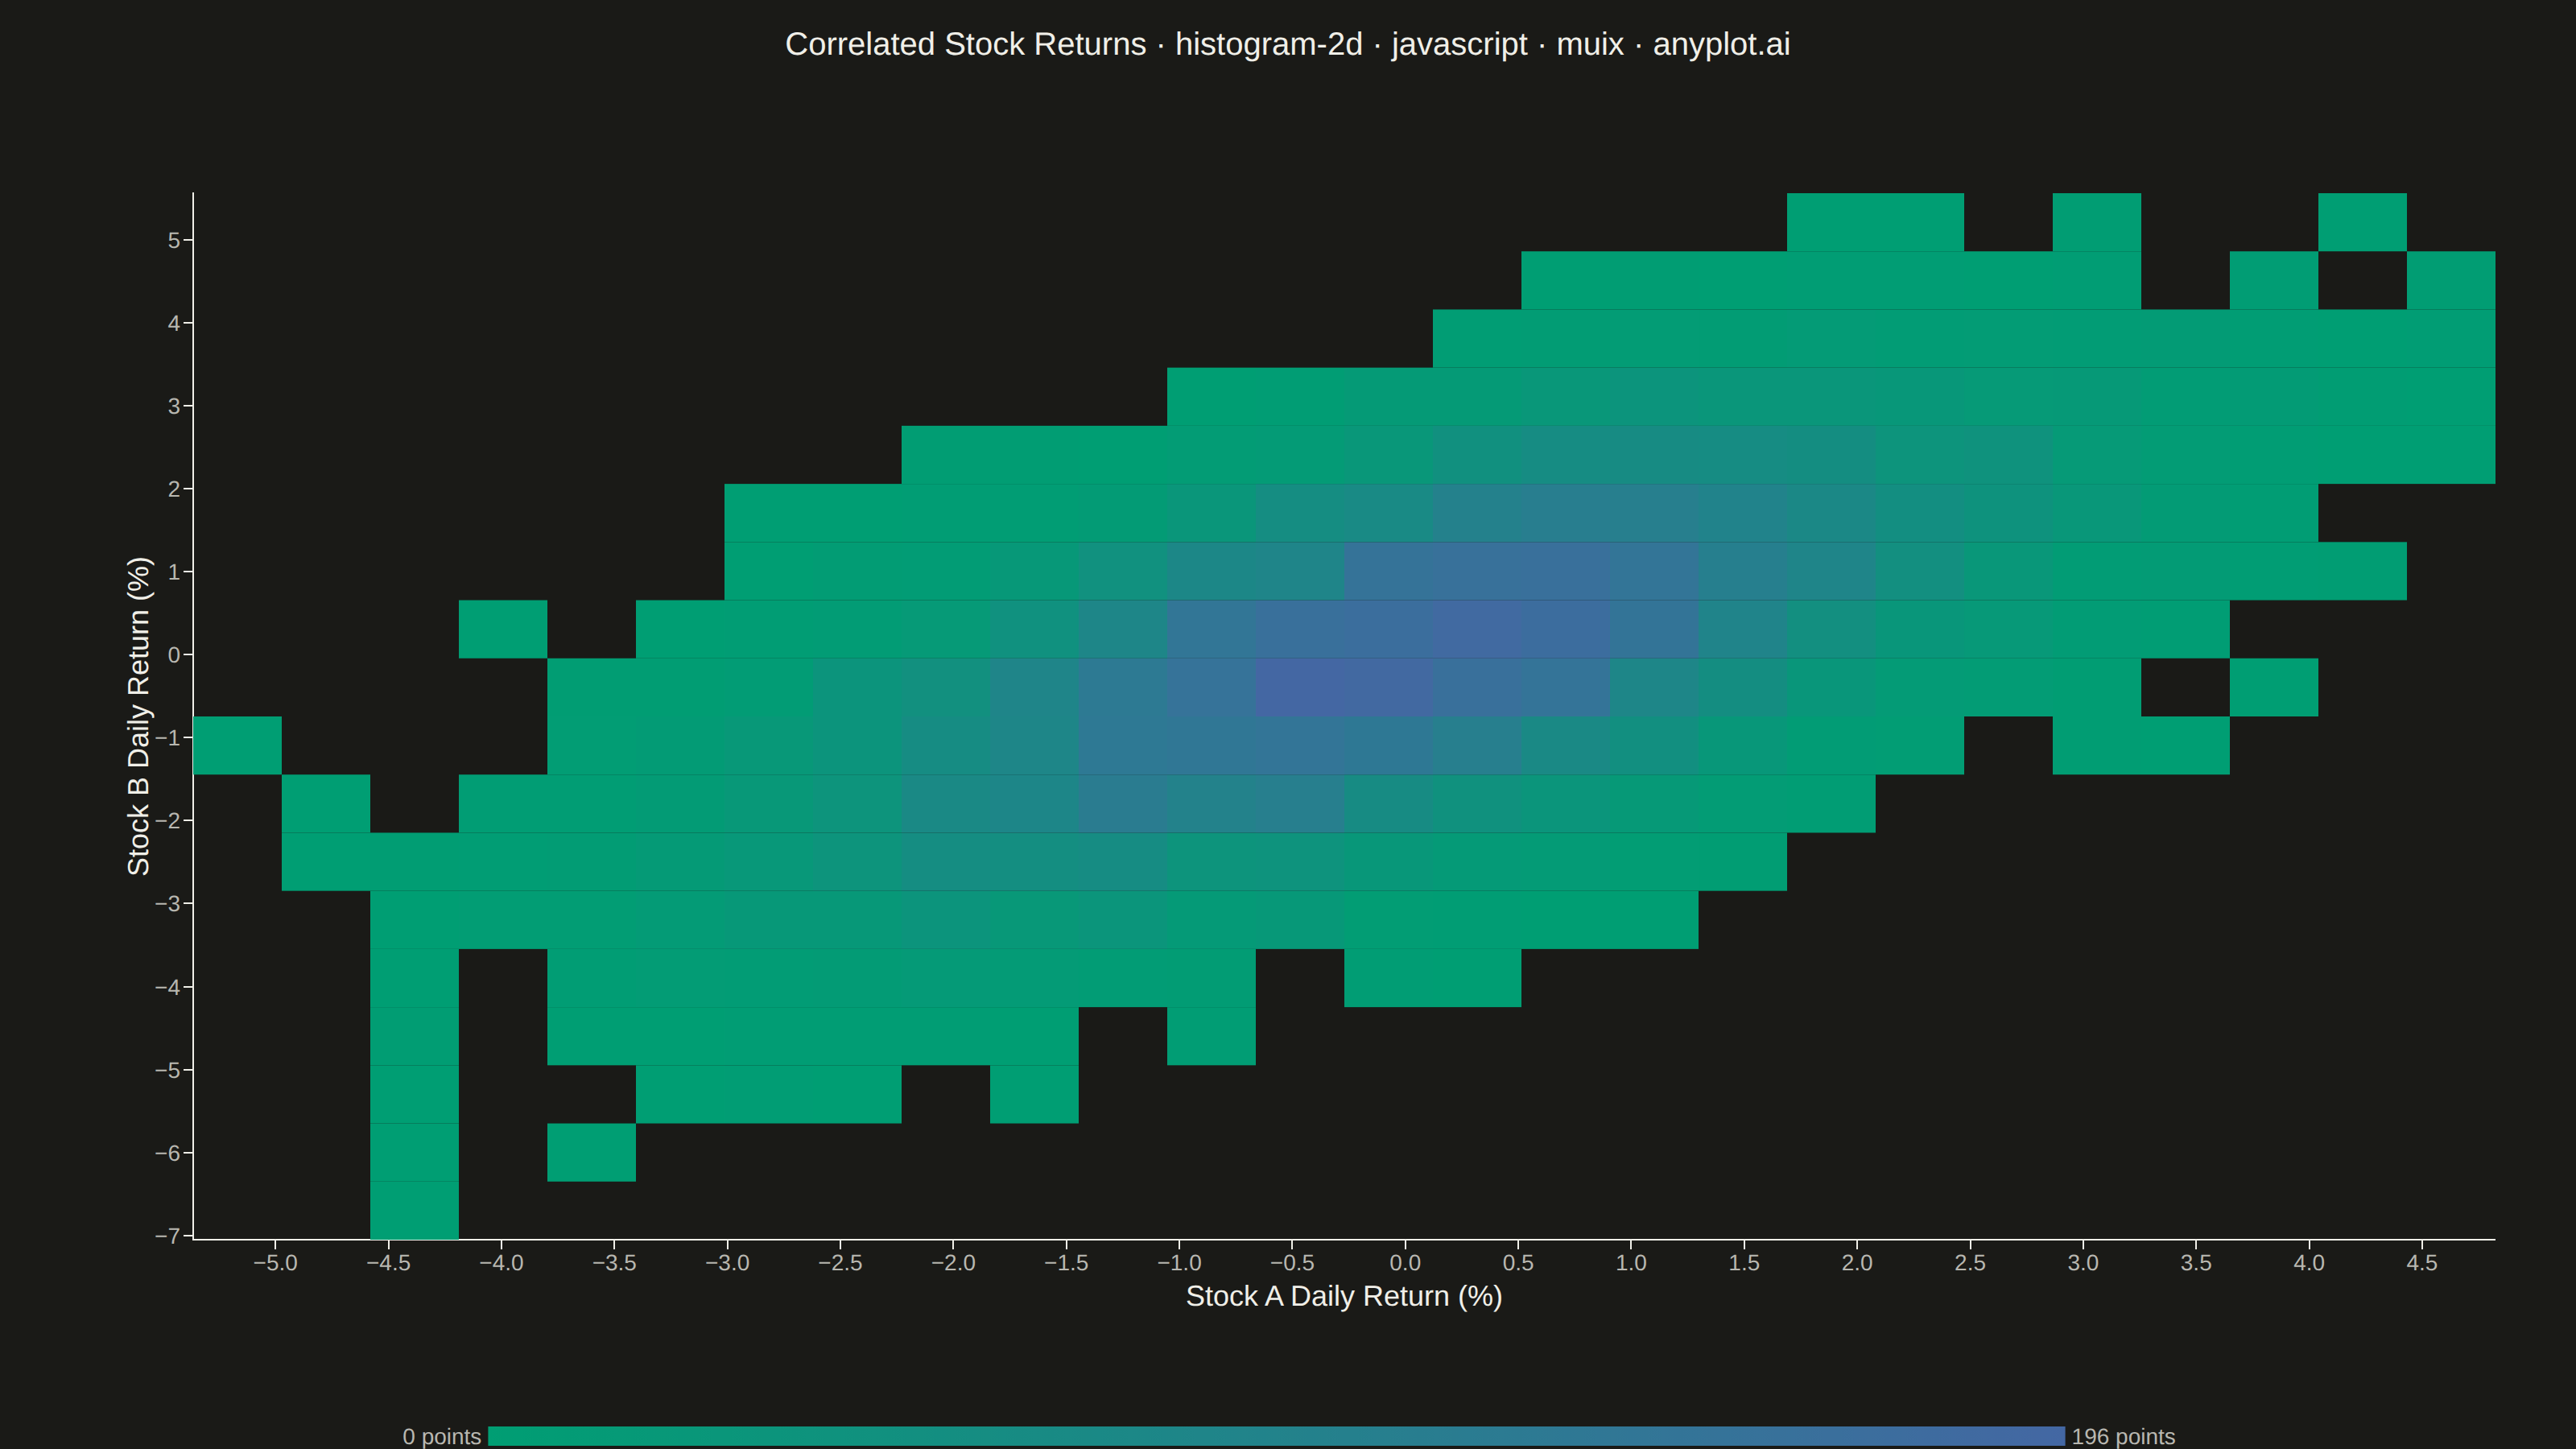
The same plot in 14 other libraries — JavaScript: Chart.js, D3.js, Apache ECharts, Highcharts; Python: Altair, Bokeh, lets-plot, Matplotlib, Plotly, plotnine, Pygal, Seaborn; R: ggplot2; Julia: Makie.jl. Compare all 15 side by side: 2D Histogram Heatmap in Python, R, Julia and JavaScript.
A two-dimensional histogram that displays the joint distribution of two continuous variables as a heatmap with rectangular bins. Each bin's color intensity represents the frequency or count of data points falling within that region, making it ideal for revealing density patterns, clusters, and correlations in bivariate data. Unlike scatter plots that can become cluttered with large datasets, 2D histograms effectively summarize point density.
// anyplot.ai
// histogram-2d: 2D Histogram Heatmap
// Library: muix 7.29.1 | JavaScript 22.23.2
// Quality: 82/100 | Created: 2026-09-05

import Box from "@mui/material/Box";
import Typography from "@mui/material/Typography";
import { ScatterChart } from "@mui/x-charts/ScatterChart";
import { ContinuousColorLegend } from "@mui/x-charts/ChartsLegend";

const tokens = window.ANYPLOT_TOKENS;

// --- Data (in-memory, deterministic) — joint distribution of two correlated
// daily stock returns, the kind of dataset a scatter plot turns into an
// unreadable smear once it grows past a few thousand points -----------------
function mulberry32(seed) {
  return function random() {
    seed = (seed + 0x6d2b79f5) | 0;
    let t = Math.imul(seed ^ (seed >>> 15), 1 | seed);
    t = (t + Math.imul(t ^ (t >>> 7), 61 | t)) ^ t;
    return ((t ^ (t >>> 14)) >>> 0) / 4294967296;
  };
}

function gaussian(random) {
  let u = 0;
  let v = 0;
  while (u === 0) u = random();
  while (v === 0) v = random();
  return Math.sqrt(-2 * Math.log(u)) * Math.cos(2 * Math.PI * v);
}

const random = mulberry32(42);
const POINT_COUNT = 8000;
const CORRELATION = 0.65;
const STOCK_A_VOLATILITY = 1.4;
const STOCK_B_VOLATILITY = 1.6;

const stockAReturns = [];
const stockBReturns = [];
for (let i = 0; i < POINT_COUNT; i += 1) {
  const z1 = gaussian(random);
  const z2 = gaussian(random);
  stockAReturns.push(z1 * STOCK_A_VOLATILITY);
  stockBReturns.push((CORRELATION * z1 + Math.sqrt(1 - CORRELATION * CORRELATION) * z2) * STOCK_B_VOLATILITY);
}

// --- Bin the point cloud into a rectangular grid — this is the "histogram"
// step: raw points collapse into per-cell counts before anything is drawn ---
const BIN_COUNT_X = 26;
const BIN_COUNT_Y = 18;
const xMin = Math.min(...stockAReturns);
const xMax = Math.max(...stockAReturns);
const yMin = Math.min(...stockBReturns);
const yMax = Math.max(...stockBReturns);
const BIN_WIDTH = (xMax - xMin) / BIN_COUNT_X;
const BIN_HEIGHT = (yMax - yMin) / BIN_COUNT_Y;

const binCounts = new Array(BIN_COUNT_X * BIN_COUNT_Y).fill(0);
for (let i = 0; i < POINT_COUNT; i += 1) {
  const bx = Math.min(BIN_COUNT_X - 1, Math.floor((stockAReturns[i] - xMin) / BIN_WIDTH));
  const by = Math.min(BIN_COUNT_Y - 1, Math.floor((stockBReturns[i] - yMin) / BIN_HEIGHT));
  binCounts[by * BIN_COUNT_X + bx] += 1;
}

const bins = [];
let maxCount = 0;
for (let by = 0; by < BIN_COUNT_Y; by += 1) {
  for (let bx = 0; bx < BIN_COUNT_X; bx += 1) {
    const count = binCounts[by * BIN_COUNT_X + bx];
    if (count > 0) {
      bins.push({
        id: `${bx}-${by}`,
        x: xMin + (bx + 0.5) * BIN_WIDTH,
        y: yMin + (by + 0.5) * BIN_HEIGHT,
        z: count,
      });
      maxCount = Math.max(maxCount, count);
    }
  }
}

// Custom marker: filled rectangular bins sized from the grid geometry above,
// replacing ScatterChart's default circles — the community `slots.scatter`
// override is the documented way to draw non-circular marks. `xScale`/`yScale`
// are affine (linear), so the on-screen span of one bin is the same anywhere
// along the axis; evaluating it once at the origin is enough.
function HistogramCell(props) {
  const { series, xScale, yScale, colorGetter, color } = props;
  const cellWidth = Math.abs(xScale(BIN_WIDTH) - xScale(0));
  const cellHeight = Math.abs(yScale(BIN_HEIGHT) - yScale(0));

  return (
    <g>
      {series.data.map((point, i) => (
        <rect
          key={point.id}
          x={(xScale(point.x) ?? 0) - cellWidth / 2}
          y={(yScale(point.y) ?? 0) - cellHeight / 2}
          width={cellWidth}
          height={cellHeight}
          fill={colorGetter ? colorGetter(i) : color}
        />
      ))}
    </g>
  );
}

const TITLE = "Correlated Stock Returns · histogram-2d · javascript · muix · anyplot.ai";
const TITLE_FONT_SIZE = Math.max(15, Math.round(22 * (TITLE.length > 67 ? 67 / TITLE.length : 1)));

export default function Chart() {
  const { width, height } = window.ANYPLOT_SIZE;
  const TITLE_HEIGHT = 90;
  const chartWidth = width - 20;
  const chartHeight = height - TITLE_HEIGHT;

  return (
    <Box sx={{ width, height, bgcolor: tokens.pageBg, display: "flex", flexDirection: "column" }}>
      <Typography
        sx={{
          color: tokens.ink,
          fontSize: TITLE_FONT_SIZE,
          fontWeight: 500,
          textAlign: "center",
          lineHeight: 1.2,
          pt: "16px",
          height: TITLE_HEIGHT,
          fontFamily: "inherit",
        }}
      >
        {TITLE}
      </Typography>
      <Box sx={{ flex: 1, display: "flex", alignItems: "flex-start", justifyContent: "flex-start" }}>
        <ScatterChart
          width={chartWidth}
          height={chartHeight}
          skipAnimation
          series={[
            {
              id: "density",
              type: "scatter",
              data: bins,
              label: "Point density",
              zAxisId: "count",
              valueFormatter: (value) => `${value.z} points`,
            },
          ]}
          xAxis={[
            {
              id: "returnA",
              min: xMin,
              max: xMax,
              label: "Stock A Daily Return (%)",
              labelStyle: { fontSize: 18, fill: tokens.ink, fontFamily: "inherit" },
              tickLabelStyle: { fontSize: 14, fill: tokens.inkSoft },
            },
          ]}
          yAxis={[
            {
              id: "returnB",
              min: yMin,
              max: yMax,
              label: "Stock B Daily Return (%)",
              labelStyle: { fontSize: 18, fill: tokens.ink, fontFamily: "inherit" },
              tickLabelStyle: { fontSize: 14, fill: tokens.inkSoft },
            },
          ]}
          zAxis={[
            {
              id: "count",
              min: 0,
              max: maxCount,
              colorMap: { type: "continuous", min: 0, max: maxCount, color: [tokens.seq[0], tokens.seq[1]] },
            },
          ]}
          grid={{ vertical: false, horizontal: false }}
          margin={{ top: 30, right: 40, bottom: 130, left: 110 }}
          slots={{ scatter: HistogramCell }}
          slotProps={{ legend: { hidden: true } }}
        >
          <ContinuousColorLegend
            axisId="count"
            axisDirection="z"
            position={{ horizontal: "middle", vertical: "bottom" }}
            direction="row"
            length="62%"
            thickness={12}
            minLabel={({ formattedValue }) => `${formattedValue} points`}
            maxLabel={({ formattedValue }) => `${formattedValue} points`}
            labelStyle={{ fontSize: 14, fill: tokens.inkSoft, fontFamily: "inherit" }}
          />
        </ScatterChart>
      </Box>
    </Box>
  );
}
Runnable source as JSON, for any HTTP client: https://api.anyplot.ai/specs/histogram-2d/muix/code. Any spec id and library id listed in llms-full.txt fit the same URL shape; every URL below is complete and callable.
{
  "spec_id": "histogram-2d",
  "language": "javascript",
  "library": "muix",
  "page": "https://anyplot.ai/histogram-2d/javascript/muix",
  "hub": "https://anyplot.ai/histogram-2d",
  "code_json": "https://api.anyplot.ai/specs/histogram-2d/muix/code",
  "spec_json": "https://api.anyplot.ai/specs/histogram-2d",
  "render_light_png": "https://storage.googleapis.com/anyplot-images/plots/histogram-2d/javascript/muix/plot-light.png",
  "render_dark_png": "https://storage.googleapis.com/anyplot-images/plots/histogram-2d/javascript/muix/plot-dark.png",
  "interactive_light_html": "https://storage.googleapis.com/anyplot-images/plots/histogram-2d/javascript/muix/plot-light.html",
  "interactive_dark_html": "https://storage.googleapis.com/anyplot-images/plots/histogram-2d/javascript/muix/plot-dark.html",
  "quality_score": 82.0,
  "license": "MIT",
  "guide": "https://anyplot.ai/llms.txt"
}
Part of 2D Histogram Heatmap on anyplot.ai.