The same plot in 14 other libraries — JavaScript: Chart.js, D3.js, Highcharts, MUI X Charts; Python: Altair, Bokeh, lets-plot, Matplotlib, Plotly, plotnine, Pygal, Seaborn; R: ggplot2; Julia: Makie.jl. Compare all 15 side by side: 2D Histogram Heatmap in Python, R, Julia and JavaScript.
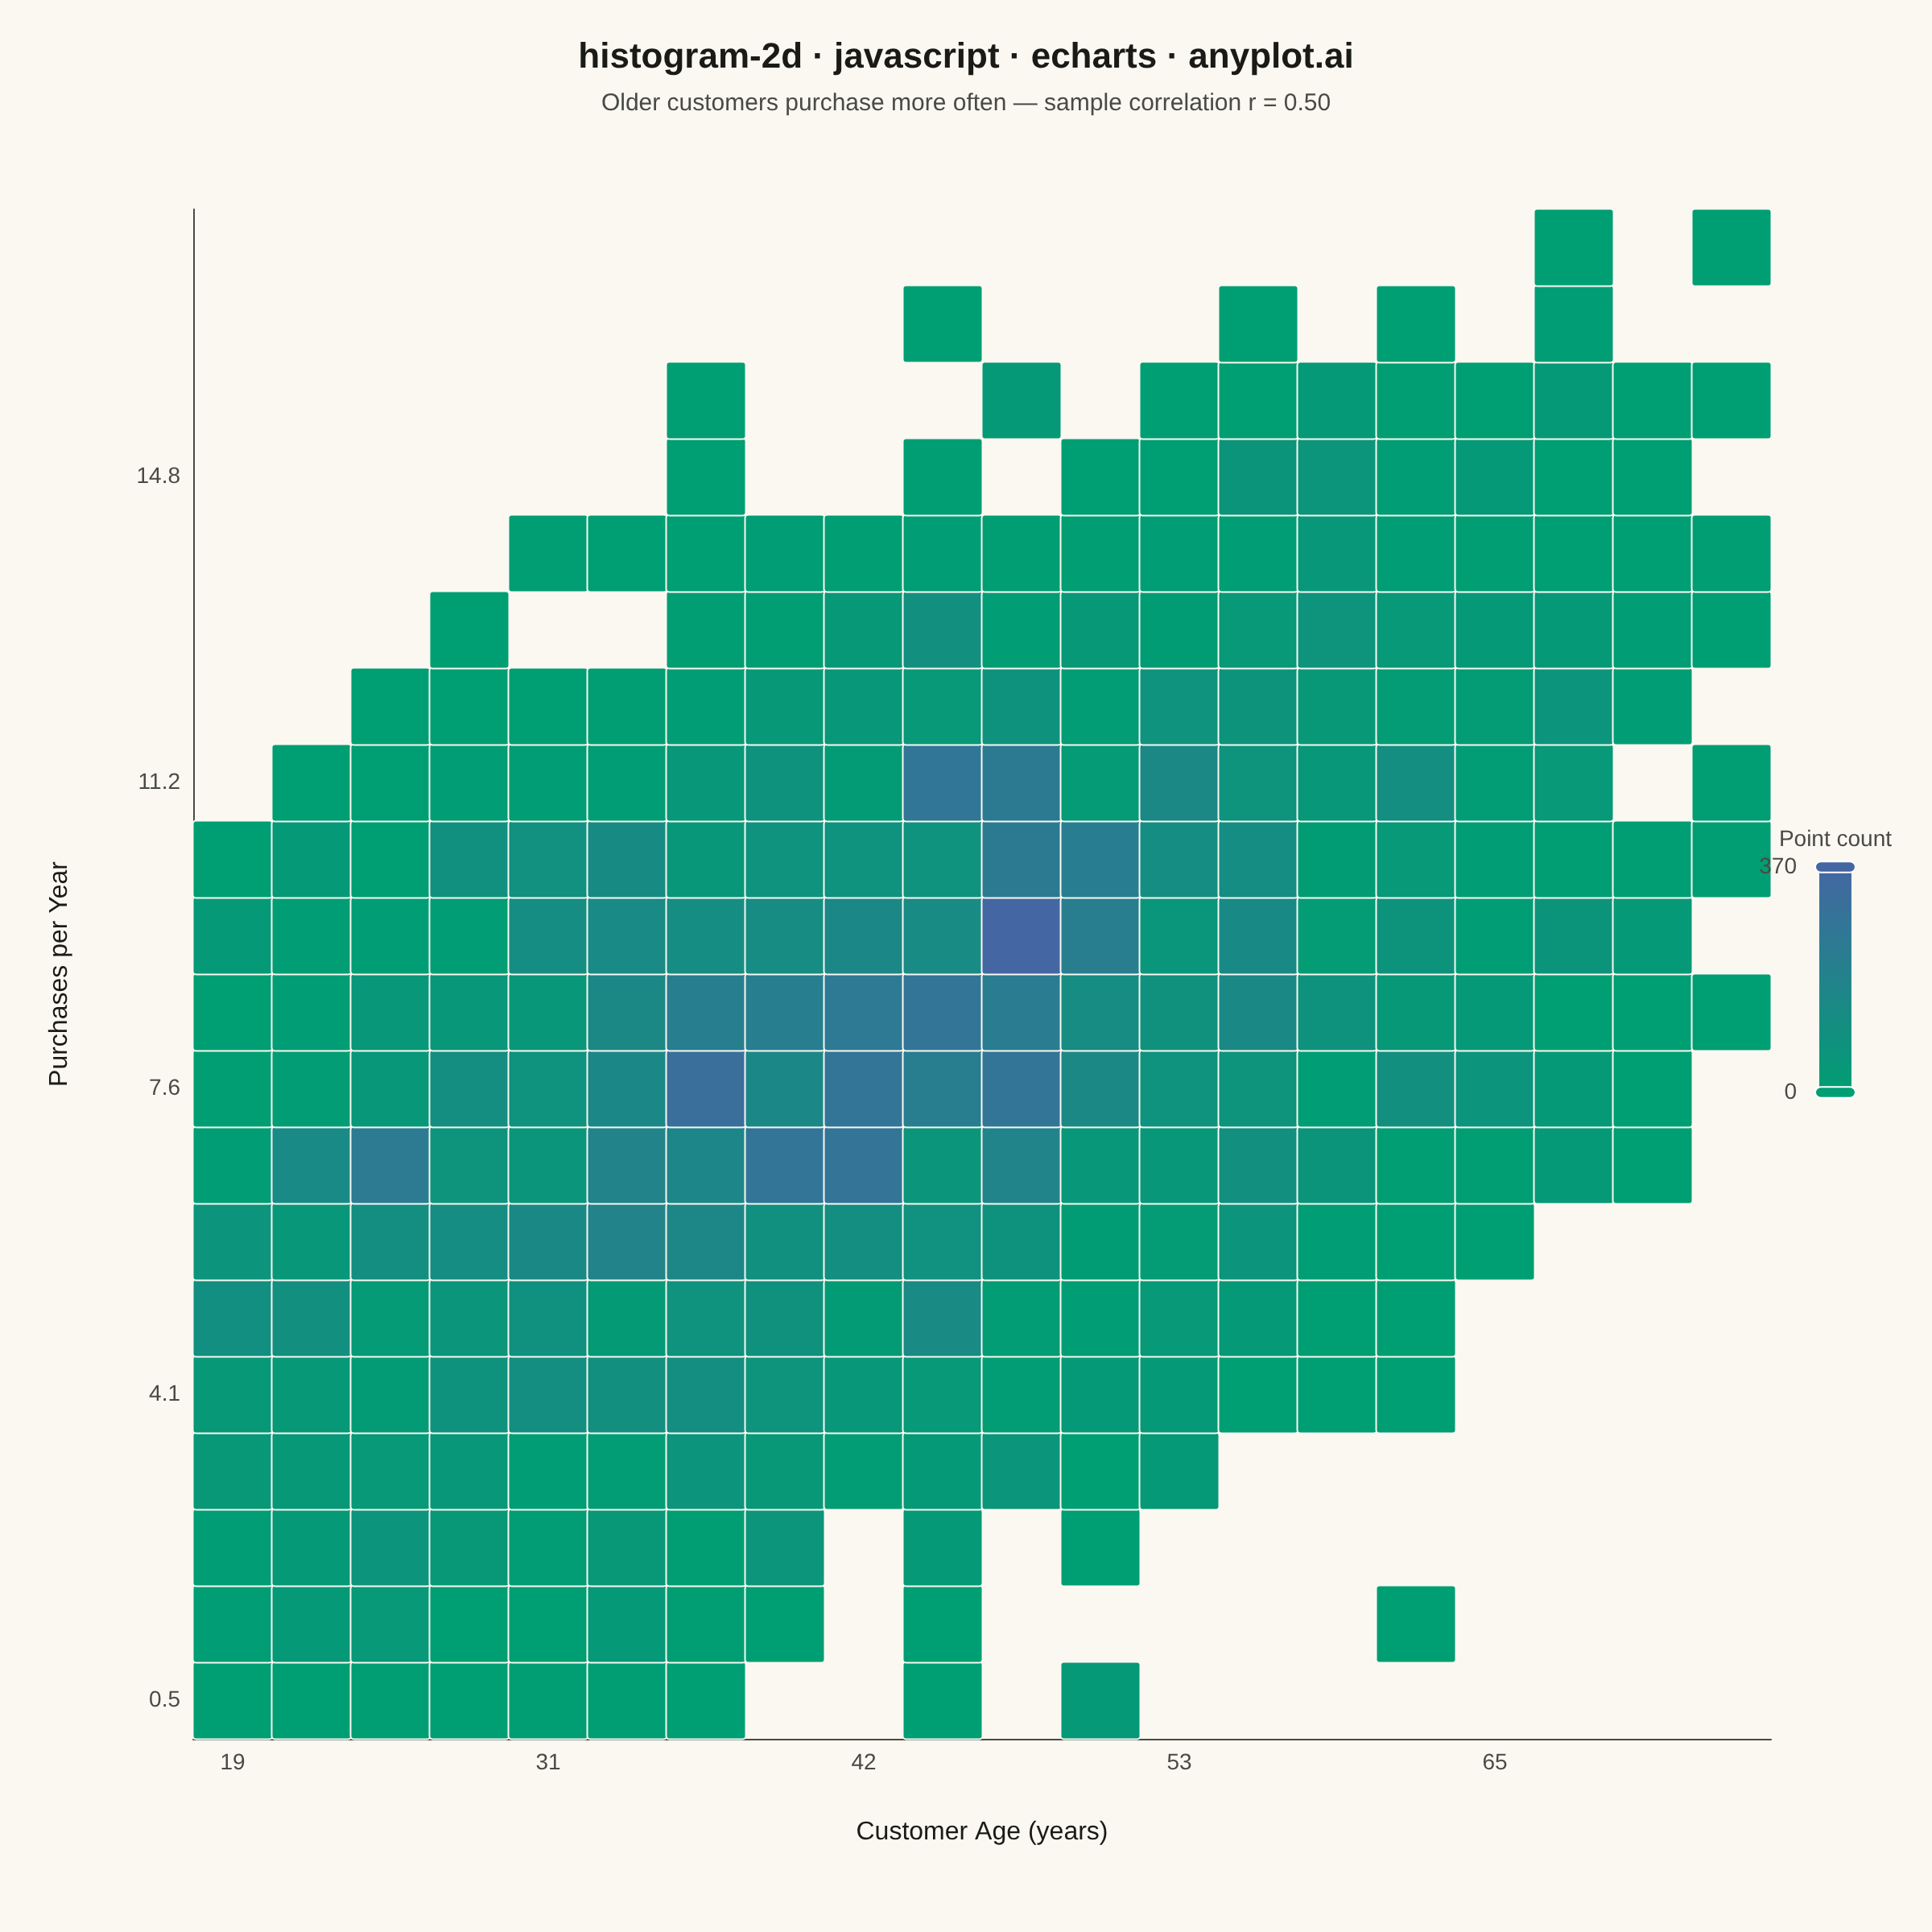
A two-dimensional histogram that displays the joint distribution of two continuous variables as a heatmap with rectangular bins. Each bin's color intensity represents the frequency or count of data points falling within that region, making it ideal for revealing density patterns, clusters, and correlations in bivariate data. Unlike scatter plots that can become cluttered with large datasets, 2D histograms effectively summarize point density.
// anyplot.ai
// histogram-2d: 2D Histogram Heatmap
// Library: echarts 6.1.0 | JavaScript 22.23.2
// Quality: 89/100 | Created: 2026-09-05
//# anyplot-orientation: square

const t = window.ANYPLOT_TOKENS;

// --- Data: deterministic bivariate-normal sample (LCG-seeded) --------------
function makeLcg(seed) {
  let state = seed >>> 0;
  return () => {
    state = (1103515245 * state + 12345) >>> 0;
    return state / 4294967296;
  };
}
const rand = makeLcg(42);

function randNormal() {
  const u1 = Math.max(rand(), 1e-12);
  const u2 = rand();
  return Math.sqrt(-2 * Math.log(u1)) * Math.cos(2 * Math.PI * u2);
}

const SAMPLE_SIZE = 16000;
const CORRELATION = 0.55;
const customerAges = [];
const purchaseFrequencies = [];
for (let i = 0; i < SAMPLE_SIZE; i++) {
  const z1 = randNormal();
  const z2 = randNormal();
  const zCorrelated = CORRELATION * z1 + Math.sqrt(1 - CORRELATION * CORRELATION) * z2;
  const age = 42 + z1 * 13;
  const frequency = 8 + zCorrelated * 3;
  if (age >= 18 && age <= 75 && frequency >= 0) {
    customerAges.push(age);
    purchaseFrequencies.push(frequency);
  }
}

// Pearson correlation of the retained sample, surfaced in the subtitle below.
function pearson(xs, ys) {
  const n = xs.length;
  const meanX = xs.reduce((a, b) => a + b, 0) / n;
  const meanY = ys.reduce((a, b) => a + b, 0) / n;
  let cov = 0;
  let varX = 0;
  let varY = 0;
  for (let i = 0; i < n; i++) {
    const dx = xs[i] - meanX;
    const dy = ys[i] - meanY;
    cov += dx * dy;
    varX += dx * dx;
    varY += dy * dy;
  }
  return cov / Math.sqrt(varX * varY);
}
const sampleCorrelation = pearson(customerAges, purchaseFrequencies);

// --- Binning: build the 2D histogram grid -----------------------------------
const BIN_COUNT = 20;
const xMin = Math.min(...customerAges);
const xMax = Math.max(...customerAges);
const yMin = Math.min(...purchaseFrequencies);
const yMax = Math.max(...purchaseFrequencies);
const xStep = (xMax - xMin) / BIN_COUNT;
const yStep = (yMax - yMin) / BIN_COUNT;

const binCounts = Array.from({ length: BIN_COUNT }, () => new Array(BIN_COUNT).fill(0));
for (let i = 0; i < customerAges.length; i++) {
  const xi = Math.min(BIN_COUNT - 1, Math.floor((customerAges[i] - xMin) / xStep));
  const yi = Math.min(BIN_COUNT - 1, Math.floor((purchaseFrequencies[i] - yMin) / yStep));
  binCounts[yi][xi] += 1;
}

const xLabels = Array.from({ length: BIN_COUNT }, (_, i) => (xMin + (i + 0.5) * xStep).toFixed(0));
const yLabels = Array.from({ length: BIN_COUNT }, (_, i) => (yMin + (i + 0.5) * yStep).toFixed(1));

const heatmapData = [];
let maxCount = 0;
for (let yi = 0; yi < BIN_COUNT; yi++) {
  for (let xi = 0; xi < BIN_COUNT; xi++) {
    const count = binCounts[yi][xi];
    if (count > 0) {
      heatmapData.push([xi, yi, count]);
      maxCount = Math.max(maxCount, count);
    }
  }
}

// --- Init --------------------------------------------------------------------
const chart = echarts.init(document.getElementById("container"));

// --- Option --------------------------------------------------------------------
chart.setOption({
  animation: false,
  backgroundColor: "transparent",
  title: {
    text: "histogram-2d · javascript · echarts · anyplot.ai",
    subtext: `Older customers purchase more often — sample correlation r = ${sampleCorrelation.toFixed(2)}`,
    left: "center",
    top: 20,
    textStyle: { color: t.ink, fontSize: 22 },
    subtextStyle: { color: t.inkSoft, fontSize: 15 },
  },
  tooltip: {
    trigger: "item",
    backgroundColor: t.elevatedBg,
    borderColor: t.grid,
    textStyle: { color: t.ink },
    formatter: (params) => {
      const [xi, yi, count] = params.value;
      return `Age: ${xLabels[xi]} yrs<br/>Purchases: ${yLabels[yi]}/yr<br/>Count: ${count}`;
    },
  },
  grid: { left: 120, right: 100, top: 130, bottom: 120 },
  xAxis: {
    type: "category",
    data: xLabels,
    name: "Customer Age (years)",
    nameLocation: "middle",
    nameGap: 50,
    nameTextStyle: { color: t.ink, fontSize: 16 },
    axisLabel: { color: t.inkSoft, fontSize: 14, interval: 3 },
    axisLine: { lineStyle: { color: t.inkSoft } },
    axisTick: { show: false },
    splitArea: { show: false },
  },
  yAxis: {
    type: "category",
    data: yLabels,
    name: "Purchases per Year",
    nameLocation: "middle",
    nameGap: 75,
    nameTextStyle: { color: t.ink, fontSize: 16 },
    axisLabel: { color: t.inkSoft, fontSize: 14, interval: 3 },
    axisLine: { lineStyle: { color: t.inkSoft } },
    axisTick: { show: false },
    splitArea: { show: false },
  },
  visualMap: {
    type: "continuous",
    min: 0,
    max: maxCount,
    calculable: true,
    orient: "vertical",
    right: 10,
    top: "middle",
    text: ["Point count", ""],
    textStyle: { color: t.inkSoft, fontSize: 14 },
    inRange: { color: t.seq },
  },
  series: [
    {
      type: "heatmap",
      data: heatmapData,
      itemStyle: { borderColor: t.pageBg, borderWidth: 1, borderRadius: 2 },
      emphasis: { itemStyle: { borderColor: t.ink, borderWidth: 2, shadowBlur: 0 } },
    },
  ],
});
Runnable source as JSON, for any HTTP client: https://api.anyplot.ai/specs/histogram-2d/echarts/code. Any spec id and library id listed in llms-full.txt fit the same URL shape; every URL below is complete and callable.
{
  "spec_id": "histogram-2d",
  "language": "javascript",
  "library": "echarts",
  "page": "https://anyplot.ai/histogram-2d/javascript/echarts",
  "hub": "https://anyplot.ai/histogram-2d",
  "code_json": "https://api.anyplot.ai/specs/histogram-2d/echarts/code",
  "spec_json": "https://api.anyplot.ai/specs/histogram-2d",
  "render_light_png": "https://storage.googleapis.com/anyplot-images/plots/histogram-2d/javascript/echarts/plot-light.png",
  "render_dark_png": "https://storage.googleapis.com/anyplot-images/plots/histogram-2d/javascript/echarts/plot-dark.png",
  "interactive_light_html": "https://storage.googleapis.com/anyplot-images/plots/histogram-2d/javascript/echarts/plot-light.html",
  "interactive_dark_html": "https://storage.googleapis.com/anyplot-images/plots/histogram-2d/javascript/echarts/plot-dark.html",
  "quality_score": 89.0,
  "license": "MIT",
  "guide": "https://anyplot.ai/llms.txt"
}
Part of 2D Histogram Heatmap on anyplot.ai.