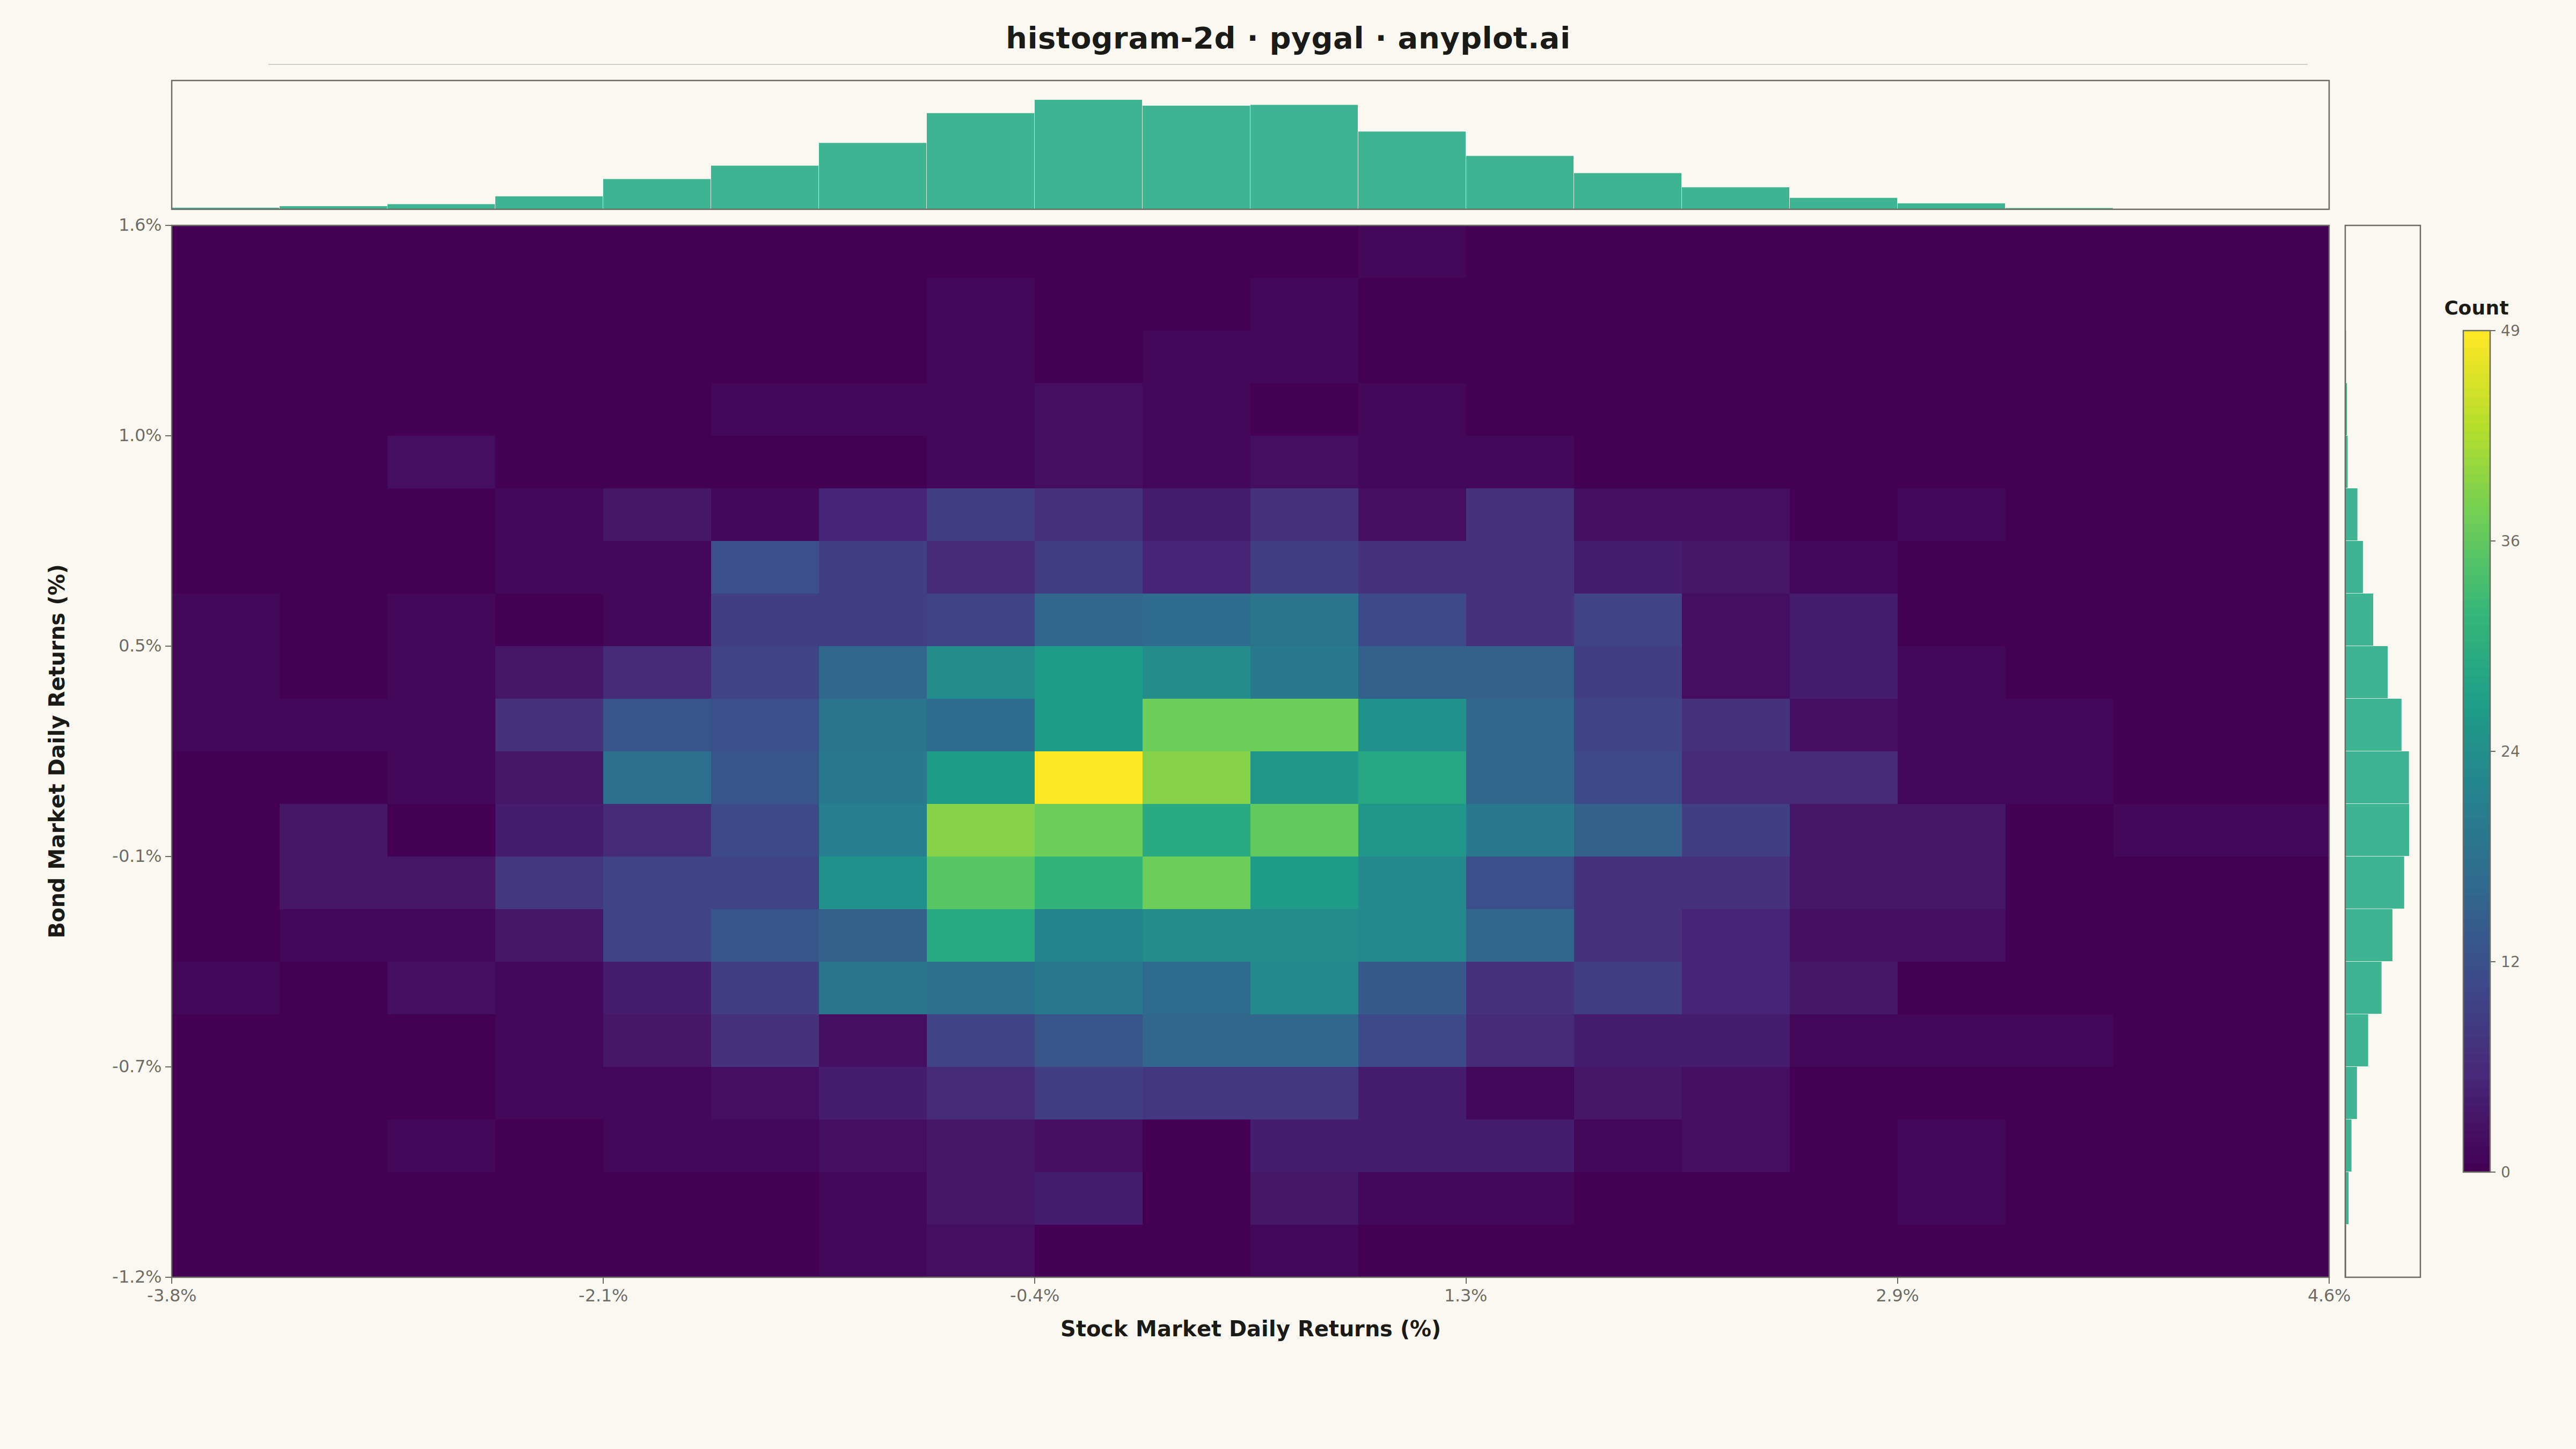
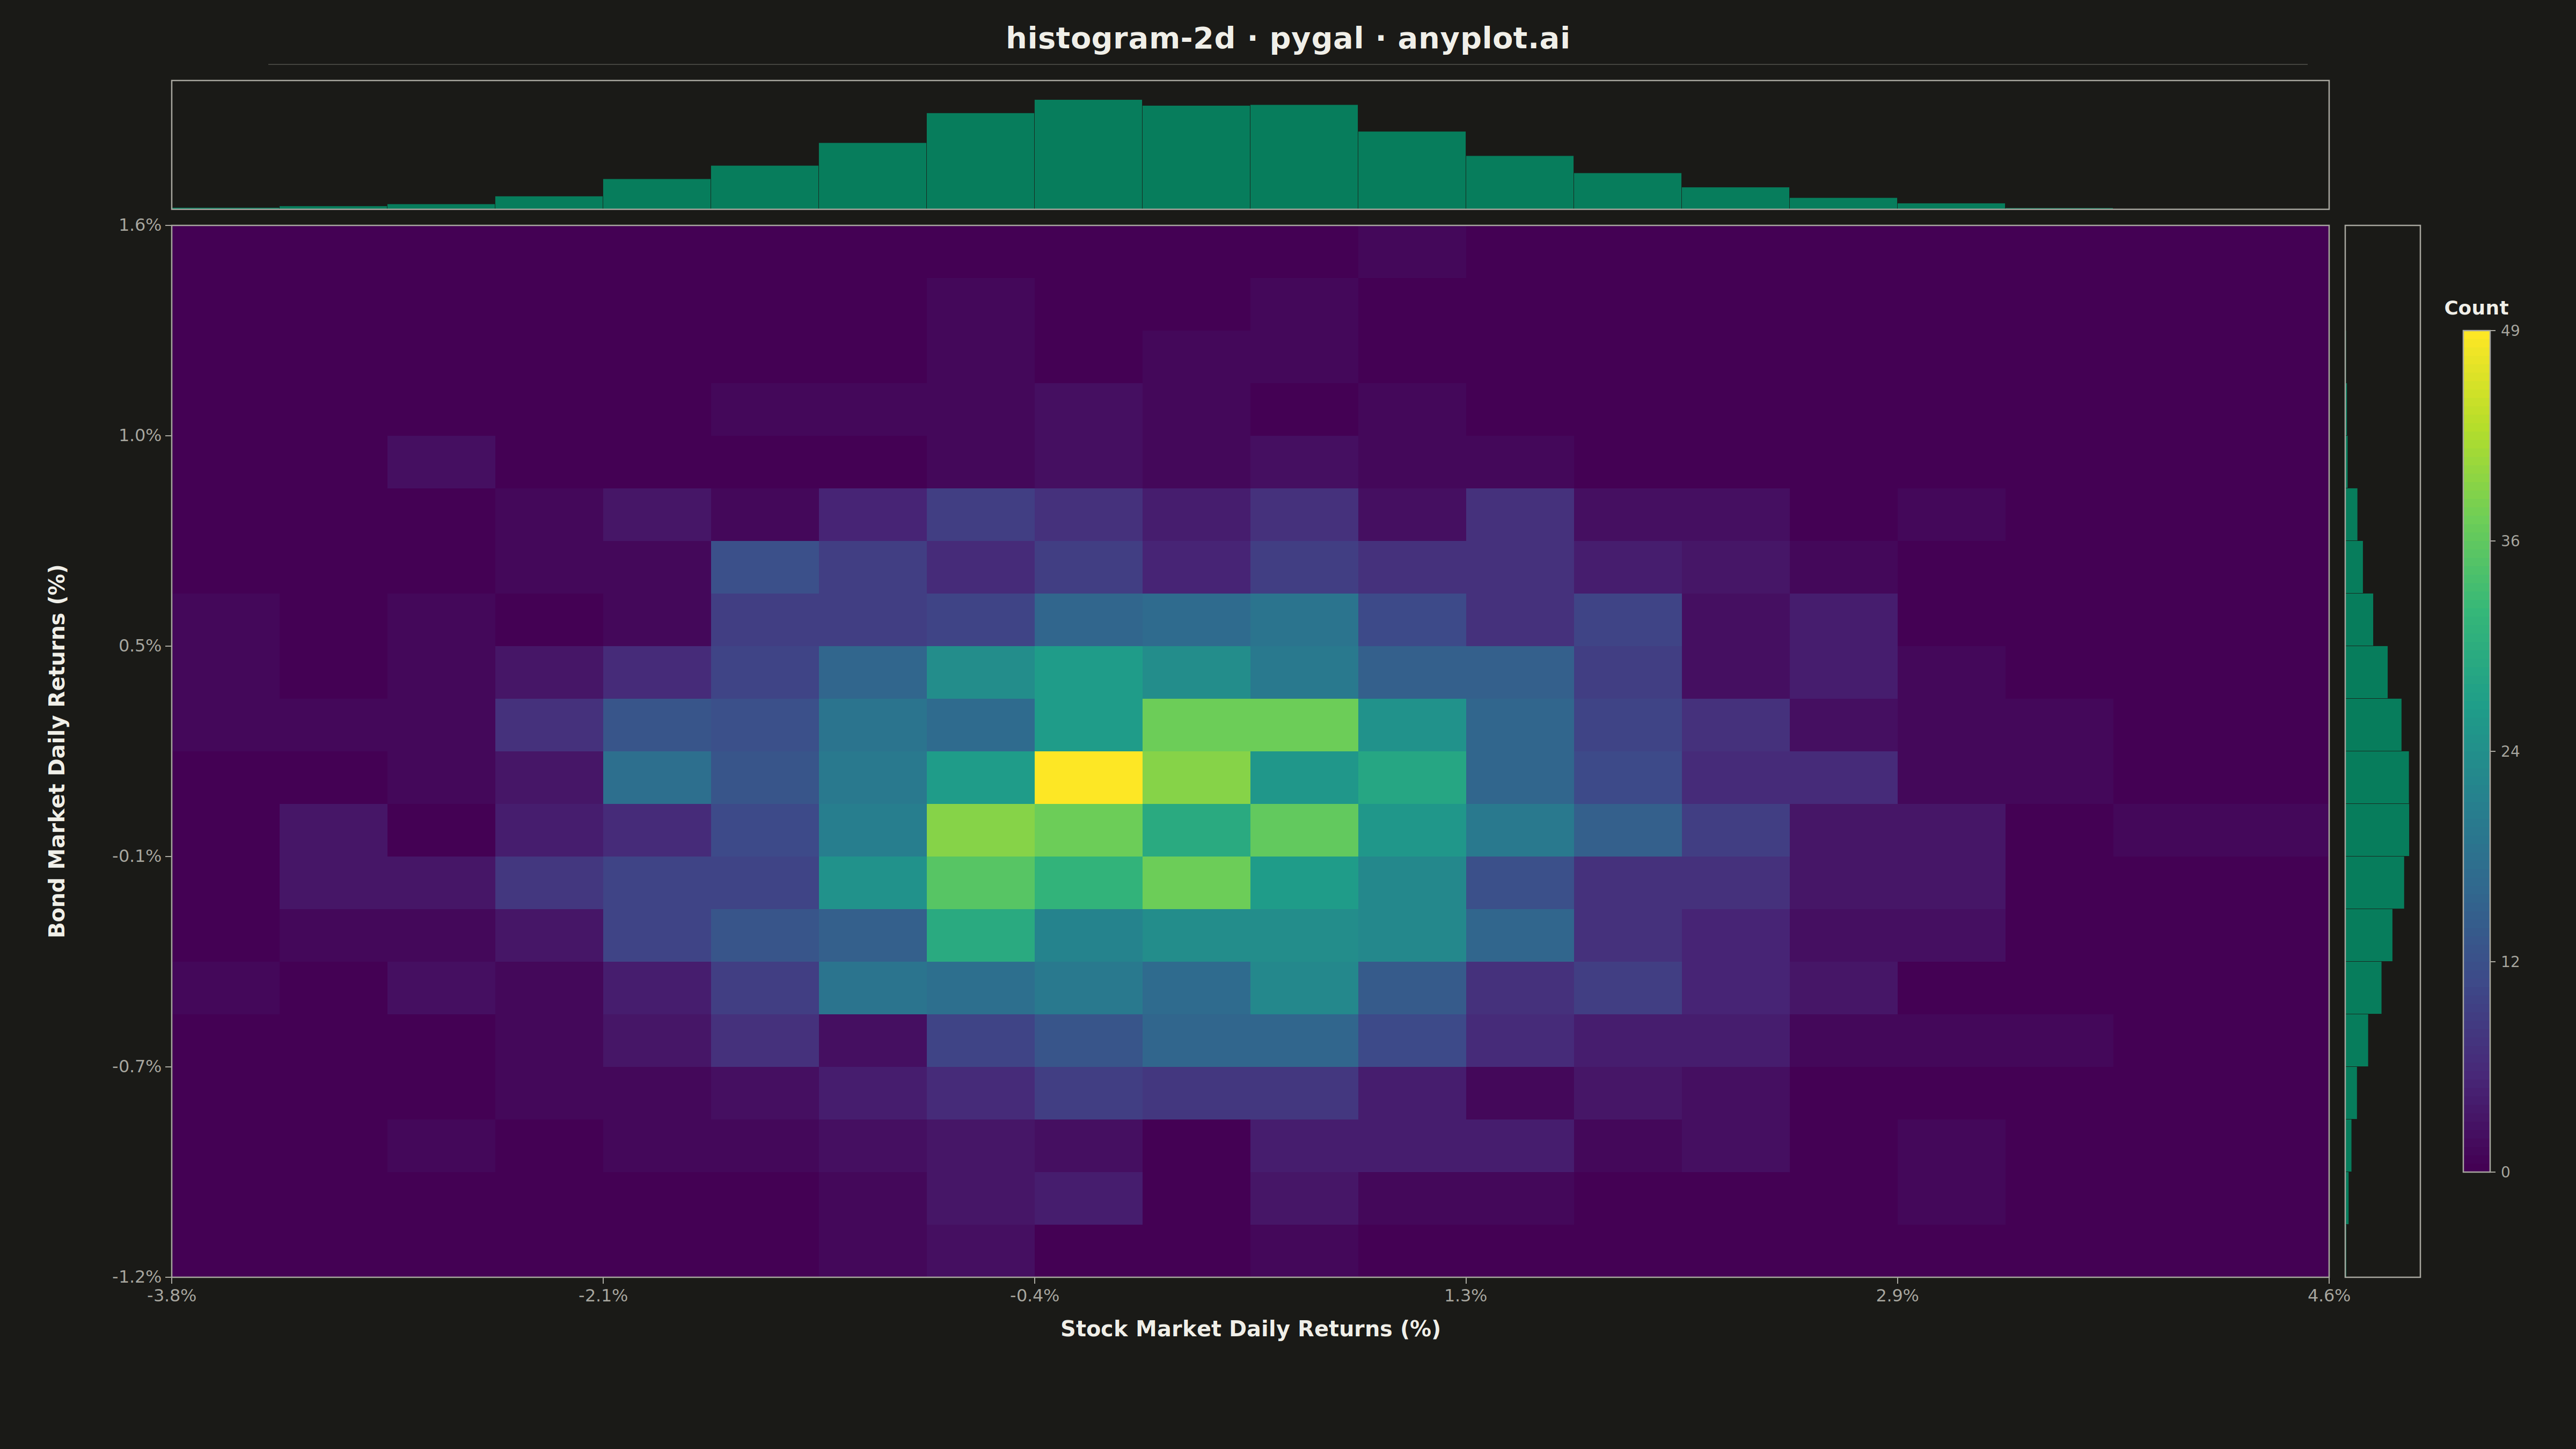
A two-dimensional histogram that displays the joint distribution of two continuous variables as a heatmap with rectangular bins. Each bin's color intensity represents the frequency or count of data points falling within that region, making it ideal for revealing density patterns, clusters, and correlations in bivariate data. Unlike scatter plots that can become cluttered with large datasets, 2D histograms effectively summarize point density.
""" anyplot.ai
histogram-2d: 2D Histogram Heatmap
Library: pygal 3.1.0 | Python 3.13.13
Quality: 91/100 | Updated: 2026-05-08
"""

import os

import cairosvg
import numpy as np


# Theme tokens - derived from pygal.style.Style patterns
THEME = os.getenv("ANYPLOT_THEME", "light")
PAGE_BG = "#FAF8F1" if THEME == "light" else "#1A1A17"
INK = "#1A1A17" if THEME == "light" else "#F0EFE8"
INK_SOFT = "#4A4A44" if THEME == "light" else "#B8B7B0"
INK_MUTED = "#6B6A63" if THEME == "light" else "#A8A79F"
OKABE_ITO_1 = "#009E73"

# Theme-adaptive style configuration (as would be used with pygal.style.Style)
_style_config = {
    "background": PAGE_BG,
    "plot_background": PAGE_BG,
    "foreground": INK,
    "foreground_strong": INK,
    "foreground_subtle": INK_MUTED,
    "colors": (OKABE_ITO_1,),
}

# Data: Financial returns from different asset classes
np.random.seed(42)

# Stock market returns (daily %)
stock_returns = np.random.normal(0.08, 1.2, 2000)

# Bond market returns (daily %)
bond_returns = np.random.normal(0.02, 0.4, 2000)

# Add some correlation structure (stocks and bonds move together in bull markets)
correlation_factor = np.random.normal(0, 0.15, 2000)
stock_returns = stock_returns + correlation_factor * 0.5
bond_returns = bond_returns + correlation_factor * 0.2

# Clip to realistic ranges
x = np.clip(stock_returns, -5, 5)
y = np.clip(bond_returns, -2, 2)

# Compute 2D histogram
n_bins = 20
counts, x_edges, y_edges = np.histogram2d(x, y, bins=n_bins)
counts = counts.T

# Compute 1D marginal histograms
x_hist, _ = np.histogram(x, bins=n_bins, range=(x_edges[0], x_edges[-1]))
y_hist, _ = np.histogram(y, bins=n_bins, range=(y_edges[0], y_edges[-1]))


def get_viridis_color(t):
    """Interpolate perceptually uniform viridis colormap."""
    viridis_lut = [
        "#440154",
        "#482878",
        "#3e4a89",
        "#31688e",
        "#26828e",
        "#1f9e89",
        "#35b779",
        "#6ece58",
        "#b5de2b",
        "#fde725",
    ]
    pos = t * (len(viridis_lut) - 1)
    idx = int(pos)
    frac = pos - idx

    if idx >= len(viridis_lut) - 1:
        return viridis_lut[-1]
    if frac == 0:
        return viridis_lut[idx]

    c1, c2 = viridis_lut[idx], viridis_lut[idx + 1]
    r = int(int(c1[1:3], 16) * (1 - frac) + int(c2[1:3], 16) * frac)
    g = int(int(c1[3:5], 16) * (1 - frac) + int(c2[3:5], 16) * frac)
    b = int(int(c1[5:7], 16) * (1 - frac) + int(c2[5:7], 16) * frac)
    return f"#{r:02x}{g:02x}{b:02x}"


# SVG construction
svg_parts = []
svg_parts.append('<?xml version="1.0" encoding="utf-8"?>')
svg_parts.append('<svg xmlns="http://www.w3.org/2000/svg" width="4800" height="2700" viewBox="0 0 4800 2700">')
svg_parts.append(f'<rect width="4800" height="2700" fill="{PAGE_BG}"/>')

# Title with refined styling
svg_parts.append(
    f'<text x="2400" y="90" text-anchor="middle" fill="{INK}" '
    f"style=\"font-size:56px;font-weight:600;font-family:'system-ui', sans-serif;letter-spacing:0.5px\">"
    f"histogram-2d · pygal · anyplot.ai</text>"
)
svg_parts.append(f'<line x1="500" y1="120" x2="4300" y2="120" stroke="{INK_MUTED}" stroke-width="1.5" opacity="0.4"/>')

# Layout
margin_l, margin_t = 320, 150
margin_r, margin_b = 280, 320
marginal_h = 240
gap = 30

# Main heatmap area
hm_x = margin_l
hm_y = margin_t + marginal_h + gap
hm_w = 4800 - margin_l - margin_r - 180
hm_h = 2700 - margin_t - margin_b - marginal_h - gap

cell_w = hm_w / n_bins
cell_h = hm_h / n_bins

min_val = counts.min()
max_val = counts.max()

# Draw heatmap cells
for i in range(n_bins):
    for j in range(n_bins):
        val = counts[n_bins - 1 - i, j]
        if max_val == min_val:
            t = 1.0
        else:
            t = max(0, min(1, (val - min_val) / (max_val - min_val)))

        color = get_viridis_color(t)

        rx = hm_x + j * cell_w
        ry = hm_y + i * cell_h
        svg_parts.append(
            f'<rect x="{rx:.1f}" y="{ry:.1f}" width="{cell_w + 0.5:.1f}" height="{cell_h + 0.5:.1f}" fill="{color}"/>'
        )

# Heatmap border with refined styling
svg_parts.append(
    f'<rect x="{hm_x}" y="{hm_y}" width="{hm_w}" height="{hm_h}" fill="none" stroke="{INK_MUTED}" stroke-width="2.5" stroke-linejoin="miter"/>'
)

# X-axis marginal histogram (top)
marg_x_y = margin_t
marg_x_h = marginal_h
x_max = x_hist.max()
for j in range(n_bins):
    bar_h = (x_hist[j] / x_max) * marg_x_h * 0.85 if x_max > 0 else 0
    rx = hm_x + j * cell_w
    ry = marg_x_y + marg_x_h - bar_h
    svg_parts.append(
        f'<rect x="{rx:.1f}" y="{ry:.1f}" width="{cell_w - 1:.1f}" height="{bar_h:.1f}" fill="{OKABE_ITO_1}" opacity="0.75" stroke="{OKABE_ITO_1}" stroke-width="0.5" stroke-opacity="0.3"/>'
    )
svg_parts.append(
    f'<rect x="{hm_x}" y="{marg_x_y}" width="{hm_w}" height="{marg_x_h}" fill="none" stroke="{INK_MUTED}" stroke-width="2.5" stroke-linejoin="miter"/>'
)

# Y-axis marginal histogram (right)
marg_y_x = hm_x + hm_w + gap
marg_y_w = 140
y_max = y_hist.max()
for i in range(n_bins):
    bar_w = (y_hist[n_bins - 1 - i] / y_max) * marg_y_w * 0.85 if y_max > 0 else 0
    rx = marg_y_x
    ry = hm_y + i * cell_h
    svg_parts.append(
        f'<rect x="{rx:.1f}" y="{ry:.1f}" width="{bar_w:.1f}" height="{cell_h - 1:.1f}" fill="{OKABE_ITO_1}" opacity="0.75" stroke="{OKABE_ITO_1}" stroke-width="0.5" stroke-opacity="0.3"/>'
    )
svg_parts.append(
    f'<rect x="{marg_y_x}" y="{hm_y}" width="{marg_y_w}" height="{hm_h}" fill="none" stroke="{INK_MUTED}" stroke-width="2.5" stroke-linejoin="miter"/>'
)

# X-axis ticks and labels
for idx in np.linspace(0, n_bins, 6):
    px = hm_x + idx * cell_w
    py = hm_y + hm_h
    val = x_edges[0] + (x_edges[-1] - x_edges[0]) * idx / n_bins
    svg_parts.append(
        f'<line x1="{px:.1f}" y1="{py:.1f}" x2="{px:.1f}" y2="{py + 12:.1f}" stroke="{INK_MUTED}" stroke-width="2"/>'
    )
    svg_parts.append(
        f'<text x="{px:.1f}" y="{py + 45:.1f}" text-anchor="middle" fill="{INK_MUTED}" '
        f'style="font-size:32px;font-family:sans-serif">{val:.1f}%</text>'
    )

# X-axis label
svg_parts.append(
    f'<text x="{hm_x + hm_w / 2:.1f}" y="{hm_y + hm_h + 110:.1f}" text-anchor="middle" '
    f'fill="{INK}" style="font-size:40px;font-weight:bold;font-family:sans-serif">'
    f"Stock Market Daily Returns (%)</text>"
)

# Y-axis ticks and labels
for idx in np.linspace(0, n_bins, 6):
    px = hm_x
    py = hm_y + hm_h - idx * cell_h
    val = y_edges[0] + (y_edges[-1] - y_edges[0]) * idx / n_bins
    svg_parts.append(
        f'<line x1="{px - 12:.1f}" y1="{py:.1f}" x2="{px:.1f}" y2="{py:.1f}" stroke="{INK_MUTED}" stroke-width="2"/>'
    )
    svg_parts.append(
        f'<text x="{px - 20:.1f}" y="{py + 10:.1f}" text-anchor="end" fill="{INK_MUTED}" '
        f'style="font-size:32px;font-family:sans-serif">{val:.1f}%</text>'
    )

# Y-axis label (rotated)
ly = hm_y + hm_h / 2
lx = hm_x - 200
svg_parts.append(
    f'<text x="{lx:.1f}" y="{ly:.1f}" text-anchor="middle" fill="{INK}" '
    f'style="font-size:40px;font-weight:bold;font-family:sans-serif" '
    f'transform="rotate(-90, {lx:.1f}, {ly:.1f})">Bond Market Daily Returns (%)</text>'
)

# Colorbar
cb_x = marg_y_x + marg_y_w + 80
cb_y = hm_y + hm_h * 0.1
cb_w = 50
cb_h = hm_h * 0.8
n_seg = 100

for i in range(n_seg):
    seg_val = min_val + (max_val - min_val) * (n_seg - 1 - i) / (n_seg - 1)
    t = (seg_val - min_val) / (max_val - min_val) if max_val > min_val else 1
    color = get_viridis_color(t)
    seg_h = cb_h / n_seg
    svg_parts.append(
        f'<rect x="{cb_x:.1f}" y="{cb_y + i * seg_h:.1f}" width="{cb_w}" height="{seg_h + 1:.1f}" fill="{color}"/>'
    )

svg_parts.append(
    f'<rect x="{cb_x}" y="{cb_y}" width="{cb_w}" height="{cb_h}" fill="none" stroke="{INK_MUTED}" stroke-width="2.5" stroke-linejoin="miter"/>'
)

# Colorbar ticks and labels
for i in range(5):
    frac = i / 4
    tick_val = max_val - frac * (max_val - min_val)
    ty = cb_y + frac * cb_h
    svg_parts.append(
        f'<line x1="{cb_x + cb_w:.1f}" y1="{ty:.1f}" '
        f'x2="{cb_x + cb_w + 10:.1f}" y2="{ty:.1f}" stroke="{INK_MUTED}" stroke-width="2"/>'
    )
    svg_parts.append(
        f'<text x="{cb_x + cb_w + 20:.1f}" y="{ty + 10:.1f}" fill="{INK_MUTED}" '
        f'style="font-size:28px;font-family:sans-serif">{int(tick_val)}</text>'
    )

# Colorbar label
svg_parts.append(
    f'<text x="{cb_x + cb_w / 2:.1f}" y="{cb_y - 30:.1f}" text-anchor="middle" '
    f'fill="{INK}" style="font-size:36px;font-weight:bold;font-family:sans-serif">Count</text>'
)

svg_parts.append("</svg>")

# Save SVG and PNG
svg_content = "\n".join(svg_parts)
with open(f"plot-{THEME}.svg", "w", encoding="utf-8") as f:
    f.write(svg_content)

cairosvg.svg2png(bytestring=svg_content.encode("utf-8"), write_to=f"plot-{THEME}.png")

# Save HTML
html_content = f"""<!DOCTYPE html>
<html>
<head>
    <meta charset="utf-8">
    <title>histogram-2d - pygal</title>
    <style>
        body {{ margin: 0; display: flex; justify-content: center; align-items: center; min-height: 100vh; background: {PAGE_BG}; }}
        .chart {{ max-width: 100%; height: auto; }}
    </style>
</head>
<body>
    <figure class="chart">
        {svg_content}
    </figure>
</body>
</html>
"""

with open(f"plot-{THEME}.html", "w", encoding="utf-8") as f:
    f.write(html_content)
Runnable source as JSON, for any HTTP client: https://api.anyplot.ai/specs/histogram-2d/pygal/code. Any spec id and library id listed in llms-full.txt fit the same URL shape; every URL below is complete and callable.
{
  "spec_id": "histogram-2d",
  "language": "python",
  "library": "pygal",
  "page": "https://anyplot.ai/histogram-2d/python/pygal",
  "hub": "https://anyplot.ai/histogram-2d",
  "code_json": "https://api.anyplot.ai/specs/histogram-2d/pygal/code",
  "spec_json": "https://api.anyplot.ai/specs/histogram-2d",
  "render_light_png": "https://storage.googleapis.com/anyplot-images/plots/histogram-2d/python/pygal/plot-light.png",
  "render_dark_png": "https://storage.googleapis.com/anyplot-images/plots/histogram-2d/python/pygal/plot-dark.png",
  "interactive_light_html": "https://storage.googleapis.com/anyplot-images/plots/histogram-2d/python/pygal/plot-light.html",
  "interactive_dark_html": "https://storage.googleapis.com/anyplot-images/plots/histogram-2d/python/pygal/plot-dark.html",
  "quality_score": 91.0,
  "license": "MIT",
  "guide": "https://anyplot.ai/llms.txt"
}
Part of 2D Histogram Heatmap on anyplot.ai.