The same plot in 14 other libraries — JavaScript: Chart.js, D3.js, Apache ECharts, MUI X Charts; Python: Altair, Bokeh, lets-plot, Matplotlib, Plotly, plotnine, Pygal, Seaborn; R: ggplot2; Julia: Makie.jl. Compare all 15 side by side: 2D Histogram Heatmap in Python, R, Julia and JavaScript.
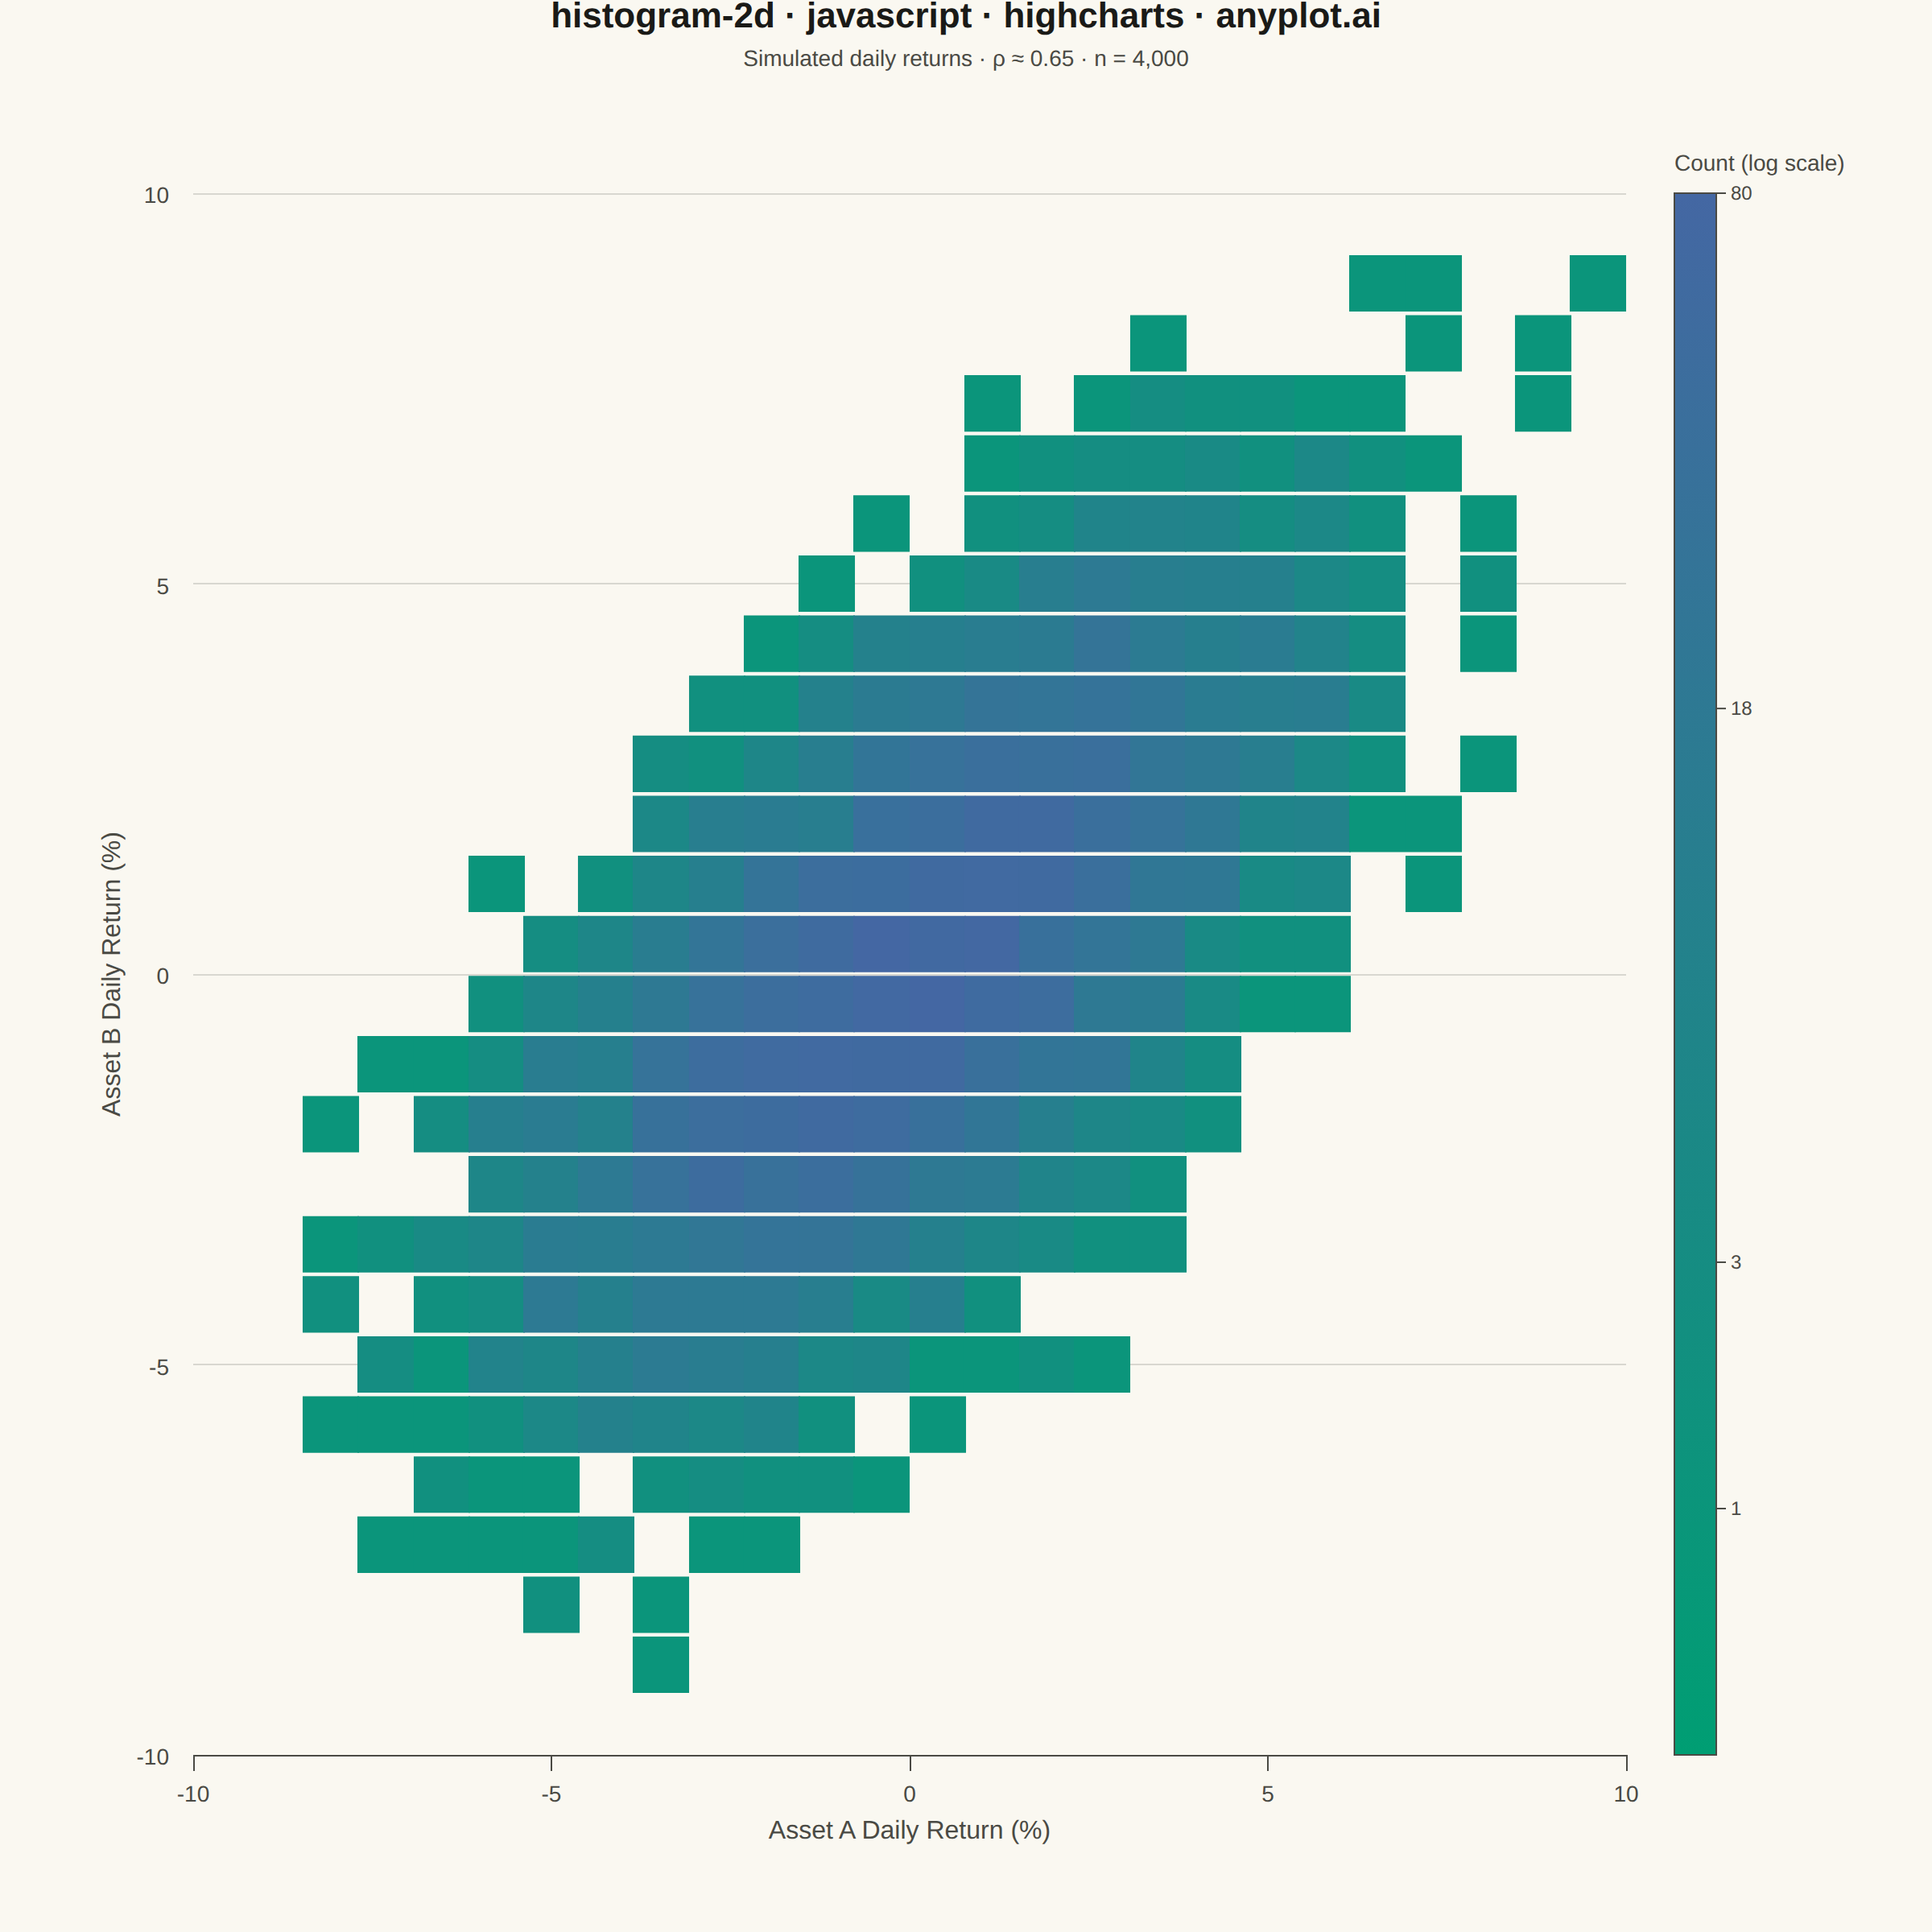
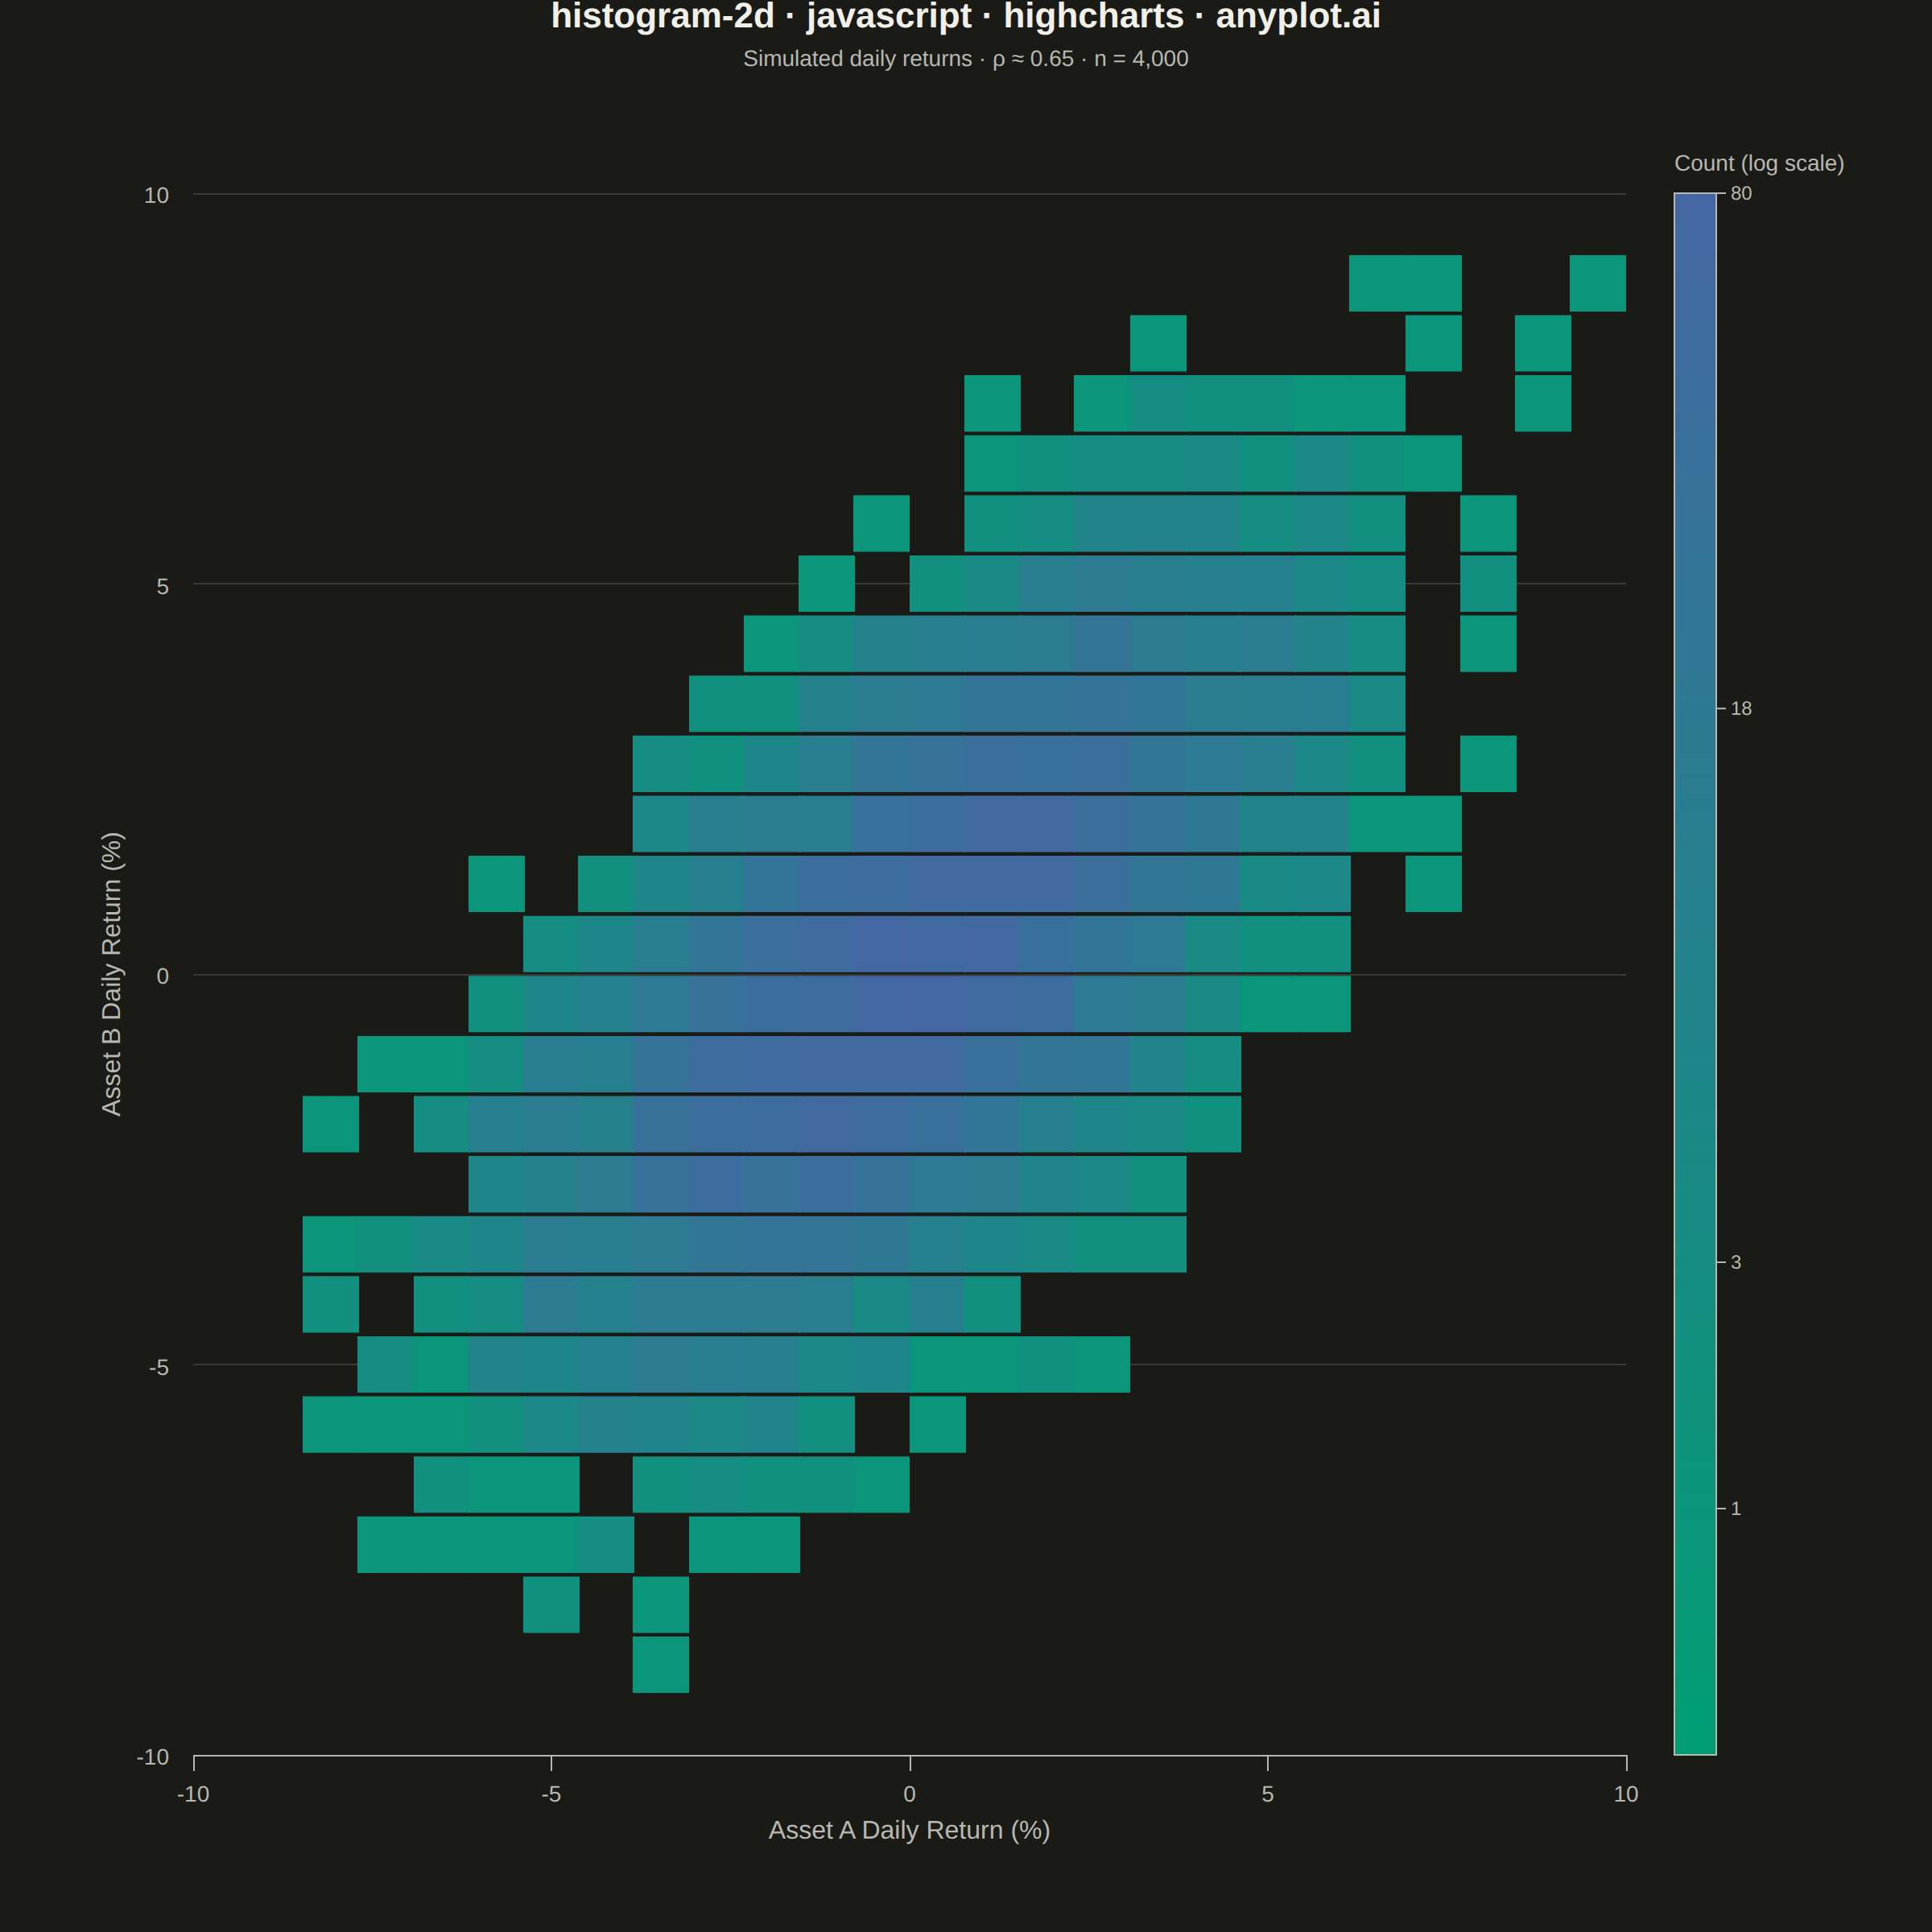
A two-dimensional histogram that displays the joint distribution of two continuous variables as a heatmap with rectangular bins. Each bin's color intensity represents the frequency or count of data points falling within that region, making it ideal for revealing density patterns, clusters, and correlations in bivariate data. Unlike scatter plots that can become cluttered with large datasets, 2D histograms effectively summarize point density.
// anyplot.ai
// histogram-2d: 2D Histogram Heatmap
// Library: highcharts 12.6.0 | JavaScript 22.23.2
// Quality: 90/100 | Created: 2026-09-05

//# anyplot-orientation: square
const t = window.ANYPLOT_TOKENS;
const size = window.ANYPLOT_SIZE;

// --- Data: correlated daily returns of two assets (deterministic LCG) ------
let seed = 42;
function nextUniform() {
  seed = (seed * 1664525 + 1013904223) >>> 0;
  return seed / 4294967296;
}
function nextNormal() {
  const u1 = Math.max(nextUniform(), 1e-12);
  const u2 = nextUniform();
  return Math.sqrt(-2 * Math.log(u1)) * Math.cos(2 * Math.PI * u2);
}

const N_POINTS = 4000;
const RHO = 0.65;
const SIGMA = 2.6; // percent

const N_BINS = 26;
const RANGE_MIN = -10;
const RANGE_MAX = 10;
const BIN_WIDTH = (RANGE_MAX - RANGE_MIN) / N_BINS;

const counts = Array.from({ length: N_BINS }, () => new Array(N_BINS).fill(0));
for (let i = 0; i < N_POINTS; i++) {
  const z1 = nextNormal();
  const z2 = nextNormal();
  const assetA = z1 * SIGMA;
  const assetB = (RHO * z1 + Math.sqrt(1 - RHO * RHO) * z2) * SIGMA;

  const ix = Math.min(Math.max(Math.floor((assetA - RANGE_MIN) / BIN_WIDTH), 0), N_BINS - 1);
  const iy = Math.min(Math.max(Math.floor((assetB - RANGE_MIN) / BIN_WIDTH), 0), N_BINS - 1);
  counts[iy][ix] += 1;
}

let maxCount = 0;
for (const row of counts) {
  for (const c of row) maxCount = Math.max(maxCount, c);
}

// --- Density → Imprint sequential color (log scale — density is skewed) ---
function hexToRgb(hex) {
  const n = parseInt(hex.slice(1), 16);
  return [(n >> 16) & 255, (n >> 8) & 255, n & 255];
}
function mixHex(hexA, hexB, ratio) {
  const a = hexToRgb(hexA);
  const b = hexToRgb(hexB);
  const rgb = a.map((v, i) => Math.round(v + (b[i] - v) * ratio));
  return '#' + rgb.map((v) => v.toString(16).padStart(2, '0')).join('');
}
function colorForCount(count) {
  const ratio = Math.log1p(count) / Math.log1p(maxCount);
  return mixHex(t.seq[0], t.seq[1], ratio);
}

const seriesData = [];
for (let iy = 0; iy < N_BINS; iy++) {
  for (let ix = 0; ix < N_BINS; ix++) {
    const count = counts[iy][ix];
    if (count === 0) continue;
    seriesData.push({
      x: RANGE_MIN + (ix + 0.5) * BIN_WIDTH,
      y: RANGE_MIN + (iy + 0.5) * BIN_WIDTH,
      count,
      color: colorForCount(count),
    });
  }
}

// --- Layout: explicit margins so the square bin markers can be sized exactly
const MARGIN = { top: 120, right: 190, bottom: 110, left: 120 };
const plotWidth = size.width - MARGIN.left - MARGIN.right;
const plotHeight = size.height - MARGIN.top - MARGIN.bottom;
const pxPerXUnit = plotWidth / (RANGE_MAX - RANGE_MIN);
const pxPerYUnit = plotHeight / (RANGE_MAX - RANGE_MIN);
const markerRadius = (BIN_WIDTH * Math.min(pxPerXUnit, pxPerYUnit)) / 2 + 0.4;

// --- Custom colorbar (core SVGRenderer — no colorAxis module required) -----
// Vertical position on the bar is linear in log1p(count), matching colorForCount().
// Intermediate ticks are placed at their real log-spaced count values so the bar
// doesn't read as a plain linear count scale.
function colorbarTicks(maxCountValue, barHeight) {
  const denom = Math.log1p(maxCountValue) || 1;
  const raw = [0, 1 / 3, 2 / 3, 1].map((r) => {
    const value = Math.max(1, Math.round(Math.expm1(r * denom)));
    return { value, ratio: Math.log1p(value) / denom };
  });
  const ticks = [];
  for (const tick of raw) {
    const y = barHeight * (1 - tick.ratio);
    const prev = ticks[ticks.length - 1];
    if (!prev || Math.abs(y - prev.y) >= 16) ticks.push({ ...tick, y });
  }
  return ticks;
}

function drawColorbar(chart) {
  const barWidth = 26;
  const barX = chart.plotLeft + chart.plotWidth + 30;
  const barY = chart.plotTop;
  const barHeight = chart.plotHeight;

  chart.renderer
    .rect(barX, barY, barWidth, barHeight)
    .attr({
      fill: {
        linearGradient: { x1: 0, y1: 1, x2: 0, y2: 0 },
        stops: [
          [0, t.seq[0]],
          [1, t.seq[1]],
        ],
      },
      stroke: t.inkSoft,
      'stroke-width': 1,
    })
    .add();
  chart.renderer
    .text('Count (log scale)', barX, barY - 14)
    .css({ color: t.inkSoft, fontSize: '14px' })
    .add();

  for (const tick of colorbarTicks(maxCount, barHeight)) {
    const y = barY + tick.y;
    chart.renderer
      .path(['M', barX + barWidth, y, 'L', barX + barWidth + 6, y])
      .attr({ stroke: t.inkSoft, 'stroke-width': 1 })
      .add();
    chart.renderer
      .text(String(tick.value), barX + barWidth + 9, y + 4)
      .css({ color: t.inkSoft, fontSize: '12px' })
      .add();
  }
}

// --- Chart -------------------------------------------------------------
Highcharts.chart('container', {
  chart: {
    type: 'scatter',
    backgroundColor: 'transparent',
    animation: false,
    spacing: [0, 0, 0, 0],
    margin: [MARGIN.top, MARGIN.right, MARGIN.bottom, MARGIN.left],
    style: { fontFamily: 'inherit' },
    events: { load: function () { drawColorbar(this); } },
  },
  credits: { enabled: false },
  colors: t.palette,
  title: {
    text: 'histogram-2d · javascript · highcharts · anyplot.ai',
    style: { color: t.ink, fontSize: '22px', fontWeight: '600' },
  },
  subtitle: {
    text: `Simulated daily returns · ρ ≈ ${RHO.toFixed(2)} · n = ${N_POINTS.toLocaleString()}`,
    style: { color: t.inkSoft, fontSize: '14px' },
  },
  xAxis: {
    min: RANGE_MIN,
    max: RANGE_MAX,
    startOnTick: false,
    endOnTick: false,
    tickInterval: 5,
    title: { text: 'Asset A Daily Return (%)', style: { color: t.inkSoft, fontSize: '16px' } },
    lineColor: t.inkSoft,
    tickColor: t.inkSoft,
    gridLineColor: t.grid,
    labels: { style: { color: t.inkSoft, fontSize: '14px' } },
  },
  yAxis: {
    min: RANGE_MIN,
    max: RANGE_MAX,
    startOnTick: false,
    endOnTick: false,
    tickInterval: 5,
    title: { text: 'Asset B Daily Return (%)', style: { color: t.inkSoft, fontSize: '16px' } },
    lineColor: t.inkSoft,
    tickColor: t.inkSoft,
    gridLineColor: t.grid,
    labels: { style: { color: t.inkSoft, fontSize: '14px' } },
  },
  legend: { enabled: false },
  tooltip: {
    backgroundColor: t.elevatedBg,
    borderColor: t.inkSoft,
    style: { color: t.ink, fontSize: '14px' },
    formatter: function () {
      return `Asset A: ${this.x.toFixed(1)}%<br/>Asset B: ${this.y.toFixed(1)}%<br/>Count: ${this.point.count}`;
    },
  },
  plotOptions: {
    series: { animation: false },
    scatter: { marker: { symbol: 'square', radius: markerRadius, lineWidth: 0 } },
  },
  series: [{ name: 'Bin count', data: seriesData }],
});
Runnable source as JSON, for any HTTP client: https://api.anyplot.ai/specs/histogram-2d/highcharts/code. Any spec id and library id listed in llms-full.txt fit the same URL shape; every URL below is complete and callable.
{
  "spec_id": "histogram-2d",
  "language": "javascript",
  "library": "highcharts",
  "page": "https://anyplot.ai/histogram-2d/javascript/highcharts",
  "hub": "https://anyplot.ai/histogram-2d",
  "code_json": "https://api.anyplot.ai/specs/histogram-2d/highcharts/code",
  "spec_json": "https://api.anyplot.ai/specs/histogram-2d",
  "render_light_png": "https://storage.googleapis.com/anyplot-images/plots/histogram-2d/javascript/highcharts/plot-light.png",
  "render_dark_png": "https://storage.googleapis.com/anyplot-images/plots/histogram-2d/javascript/highcharts/plot-dark.png",
  "interactive_light_html": "https://storage.googleapis.com/anyplot-images/plots/histogram-2d/javascript/highcharts/plot-light.html",
  "interactive_dark_html": "https://storage.googleapis.com/anyplot-images/plots/histogram-2d/javascript/highcharts/plot-dark.html",
  "quality_score": 90.0,
  "license": "MIT",
  "guide": "https://anyplot.ai/llms.txt"
}
Part of 2D Histogram Heatmap on anyplot.ai.