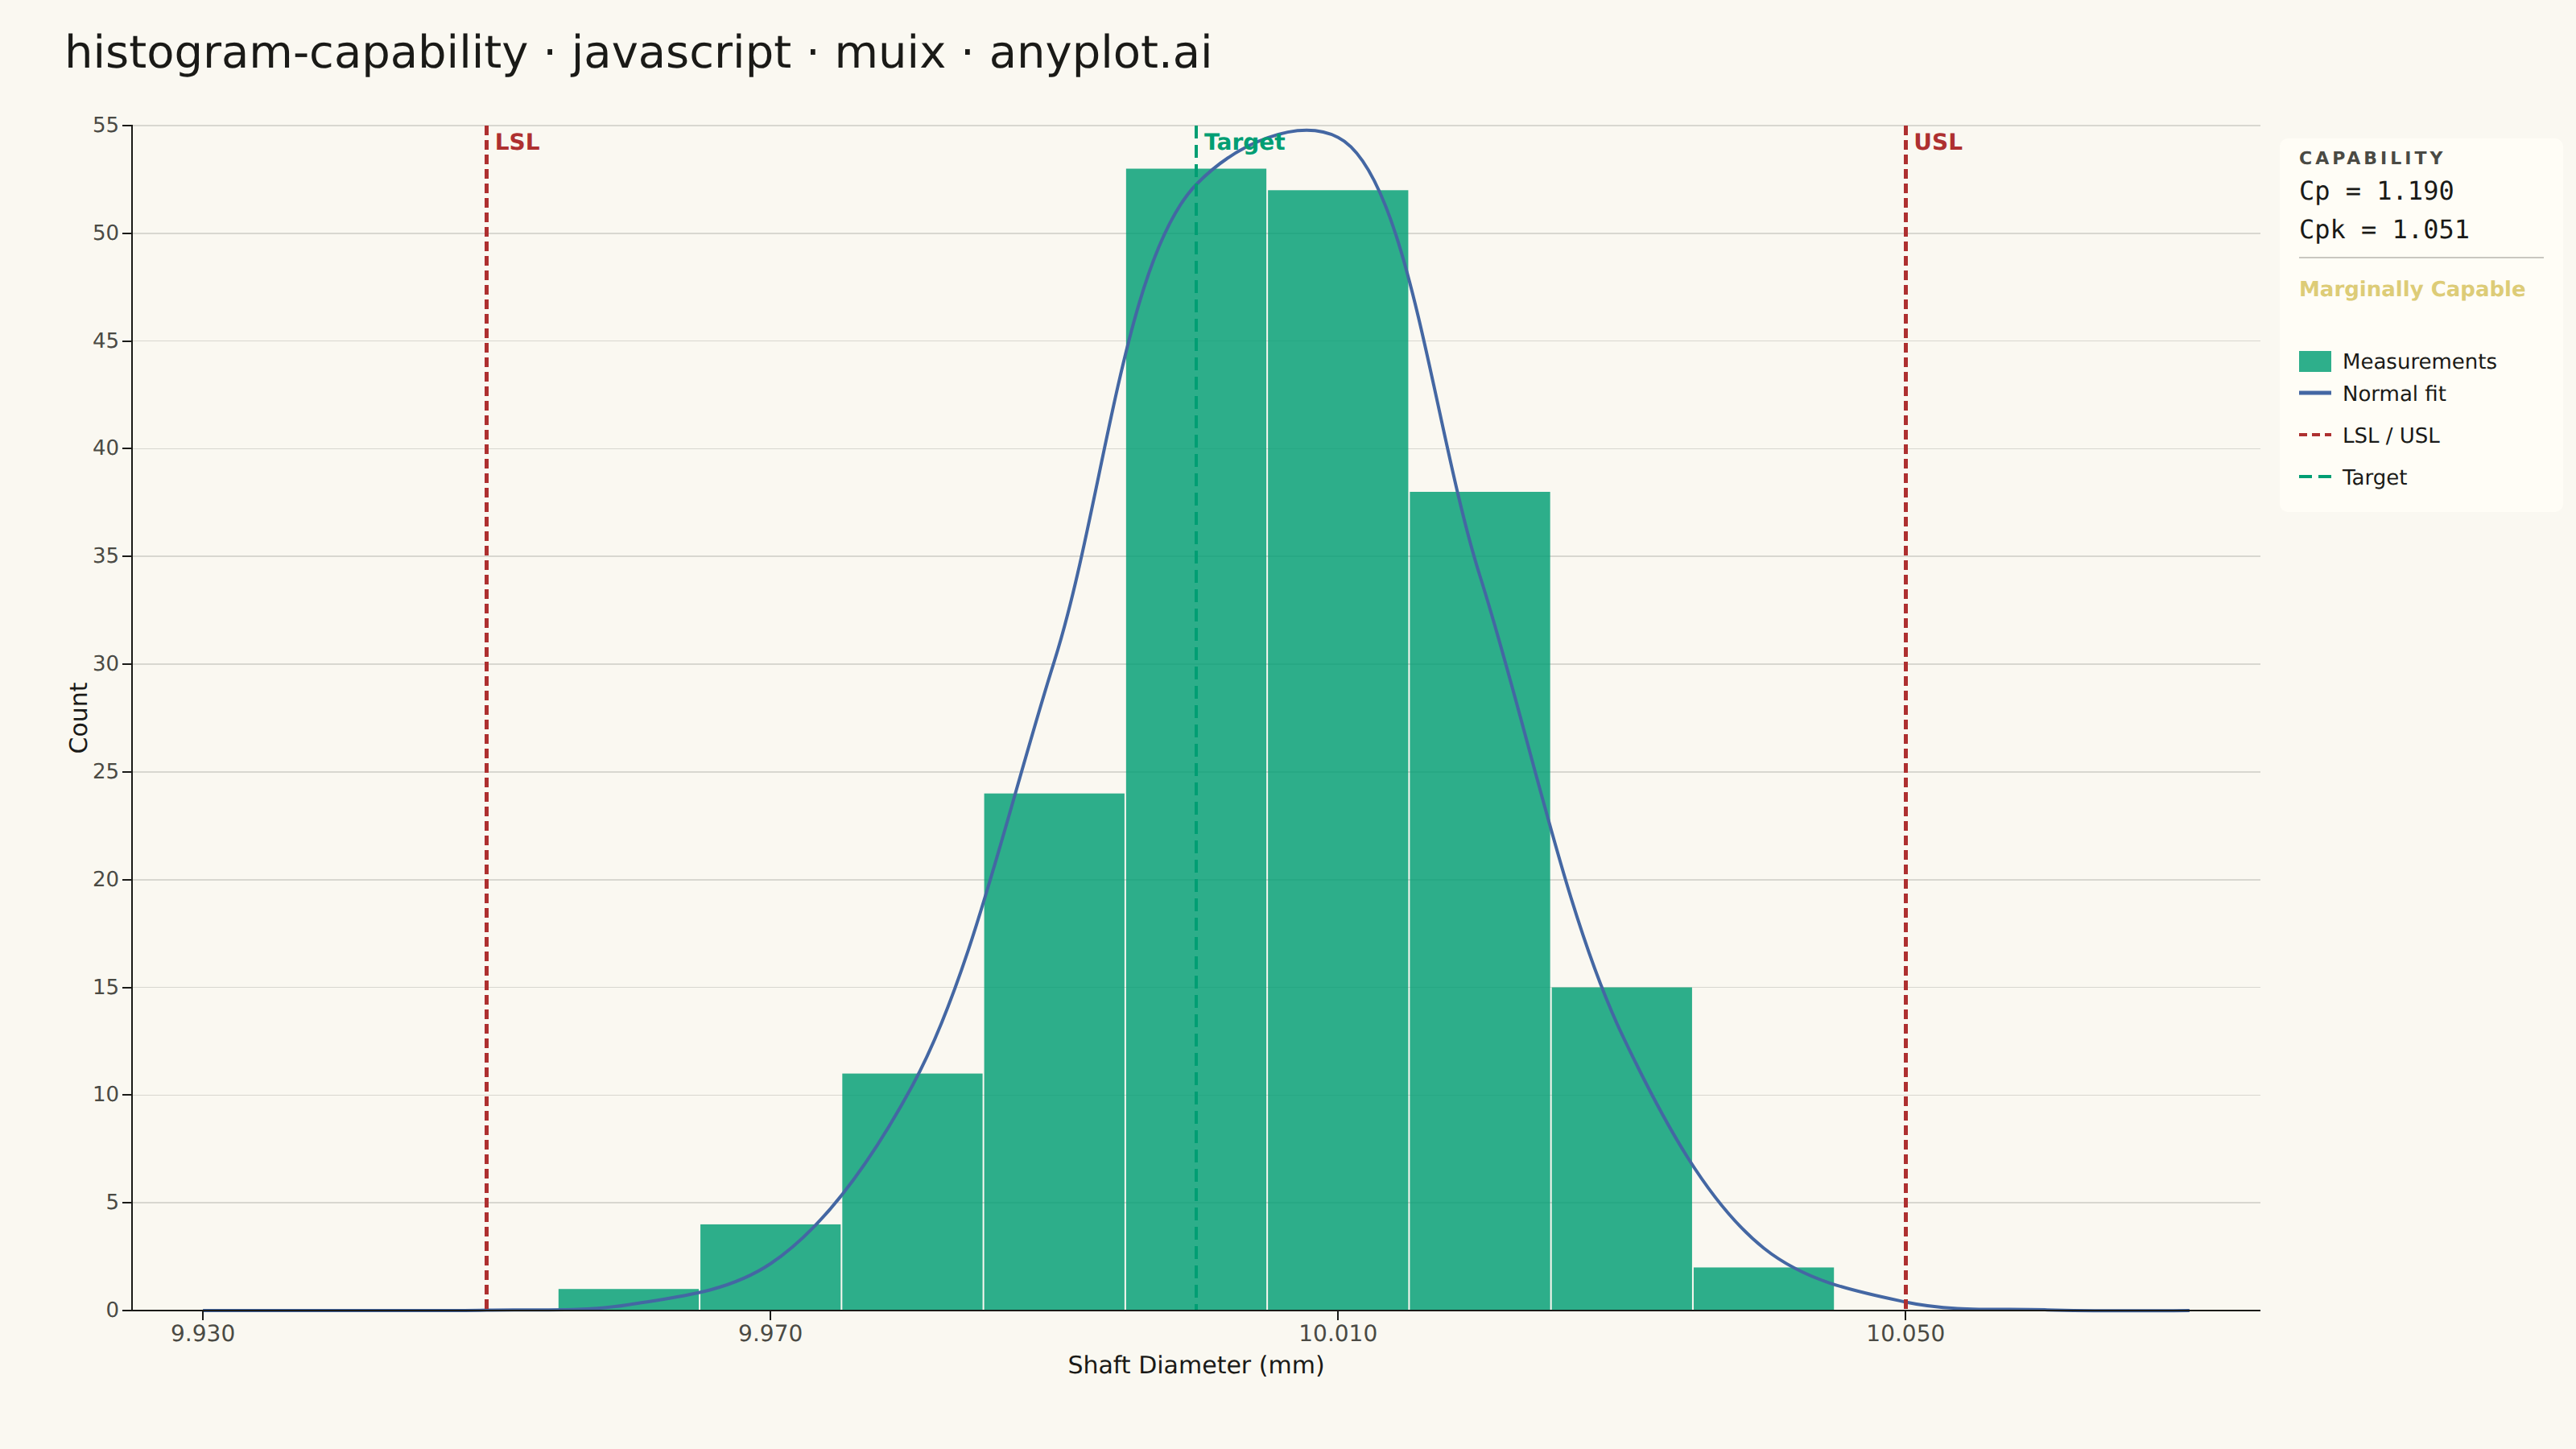
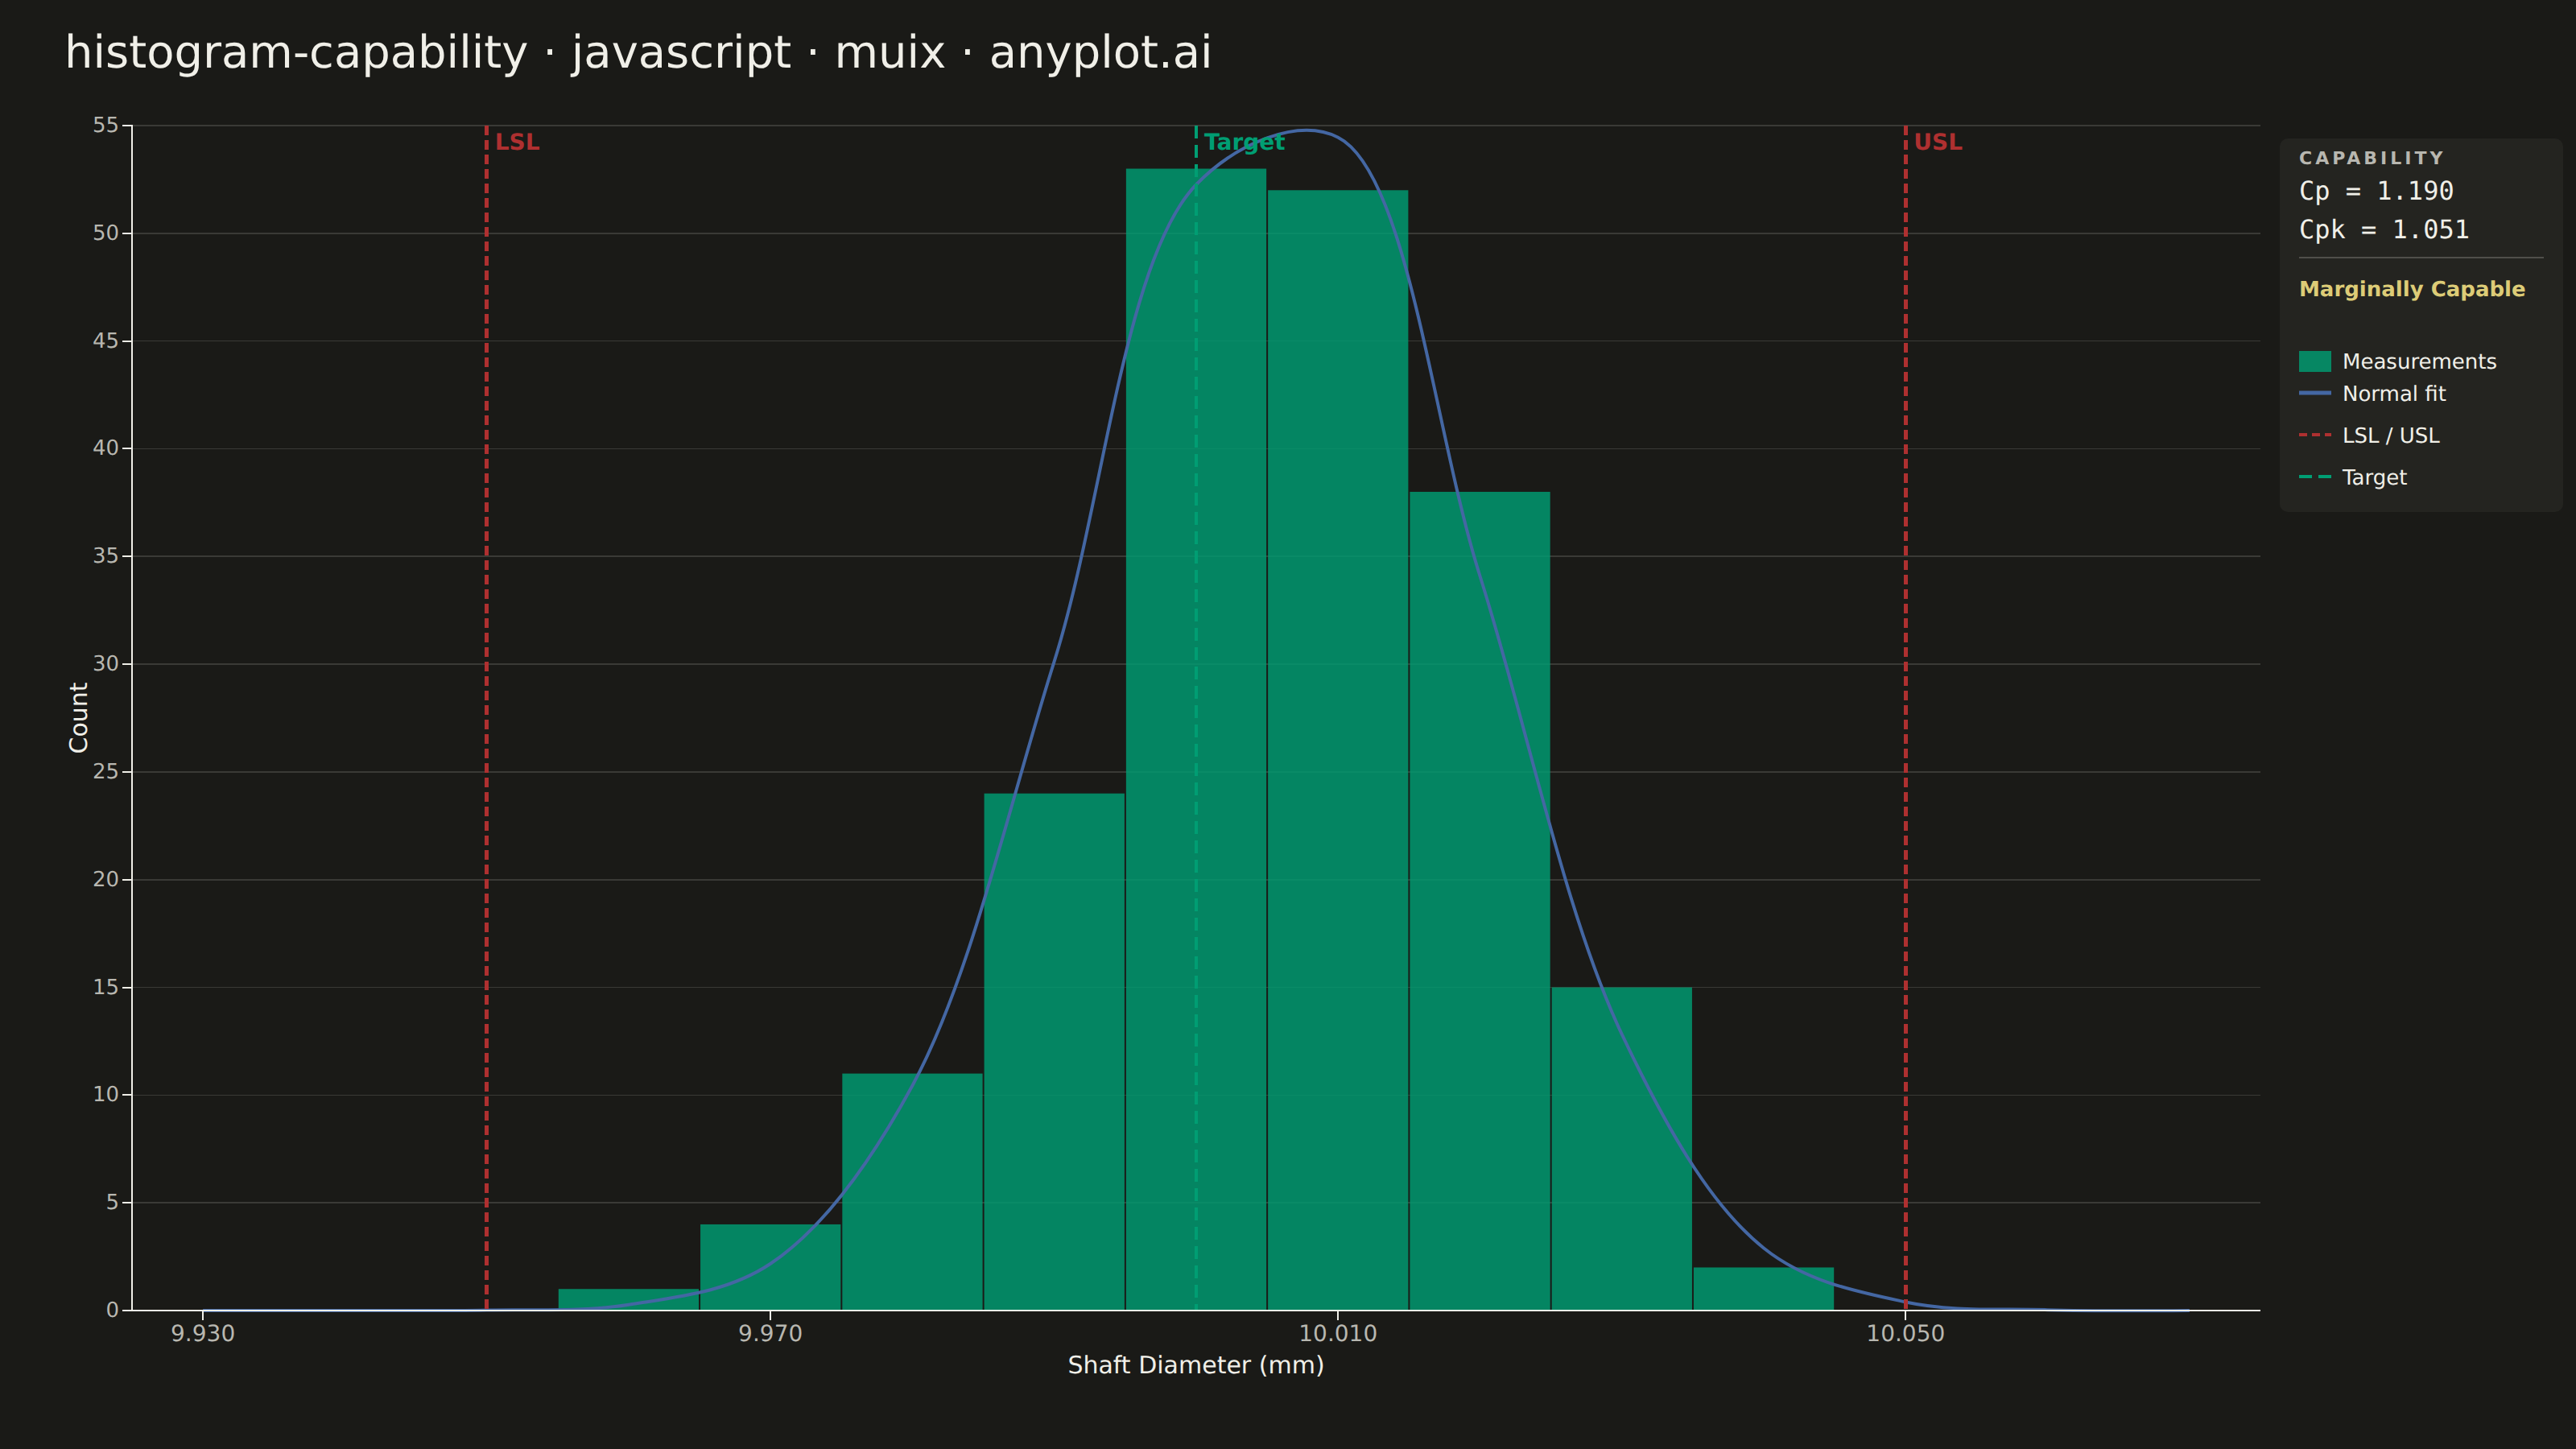
A process capability plot displays a histogram of measured process data overlaid with a fitted normal distribution curve and vertical lines for specification limits (LSL, USL) and target value. Capability indices (Cp, Cpk) are annotated on the plot to quantify how well the process meets specifications. This is a standard tool in quality engineering and Six Sigma for assessing whether a manufacturing or production process is capable of consistently producing output within tolerance.
Preview render from the MUI X Charts implementation.