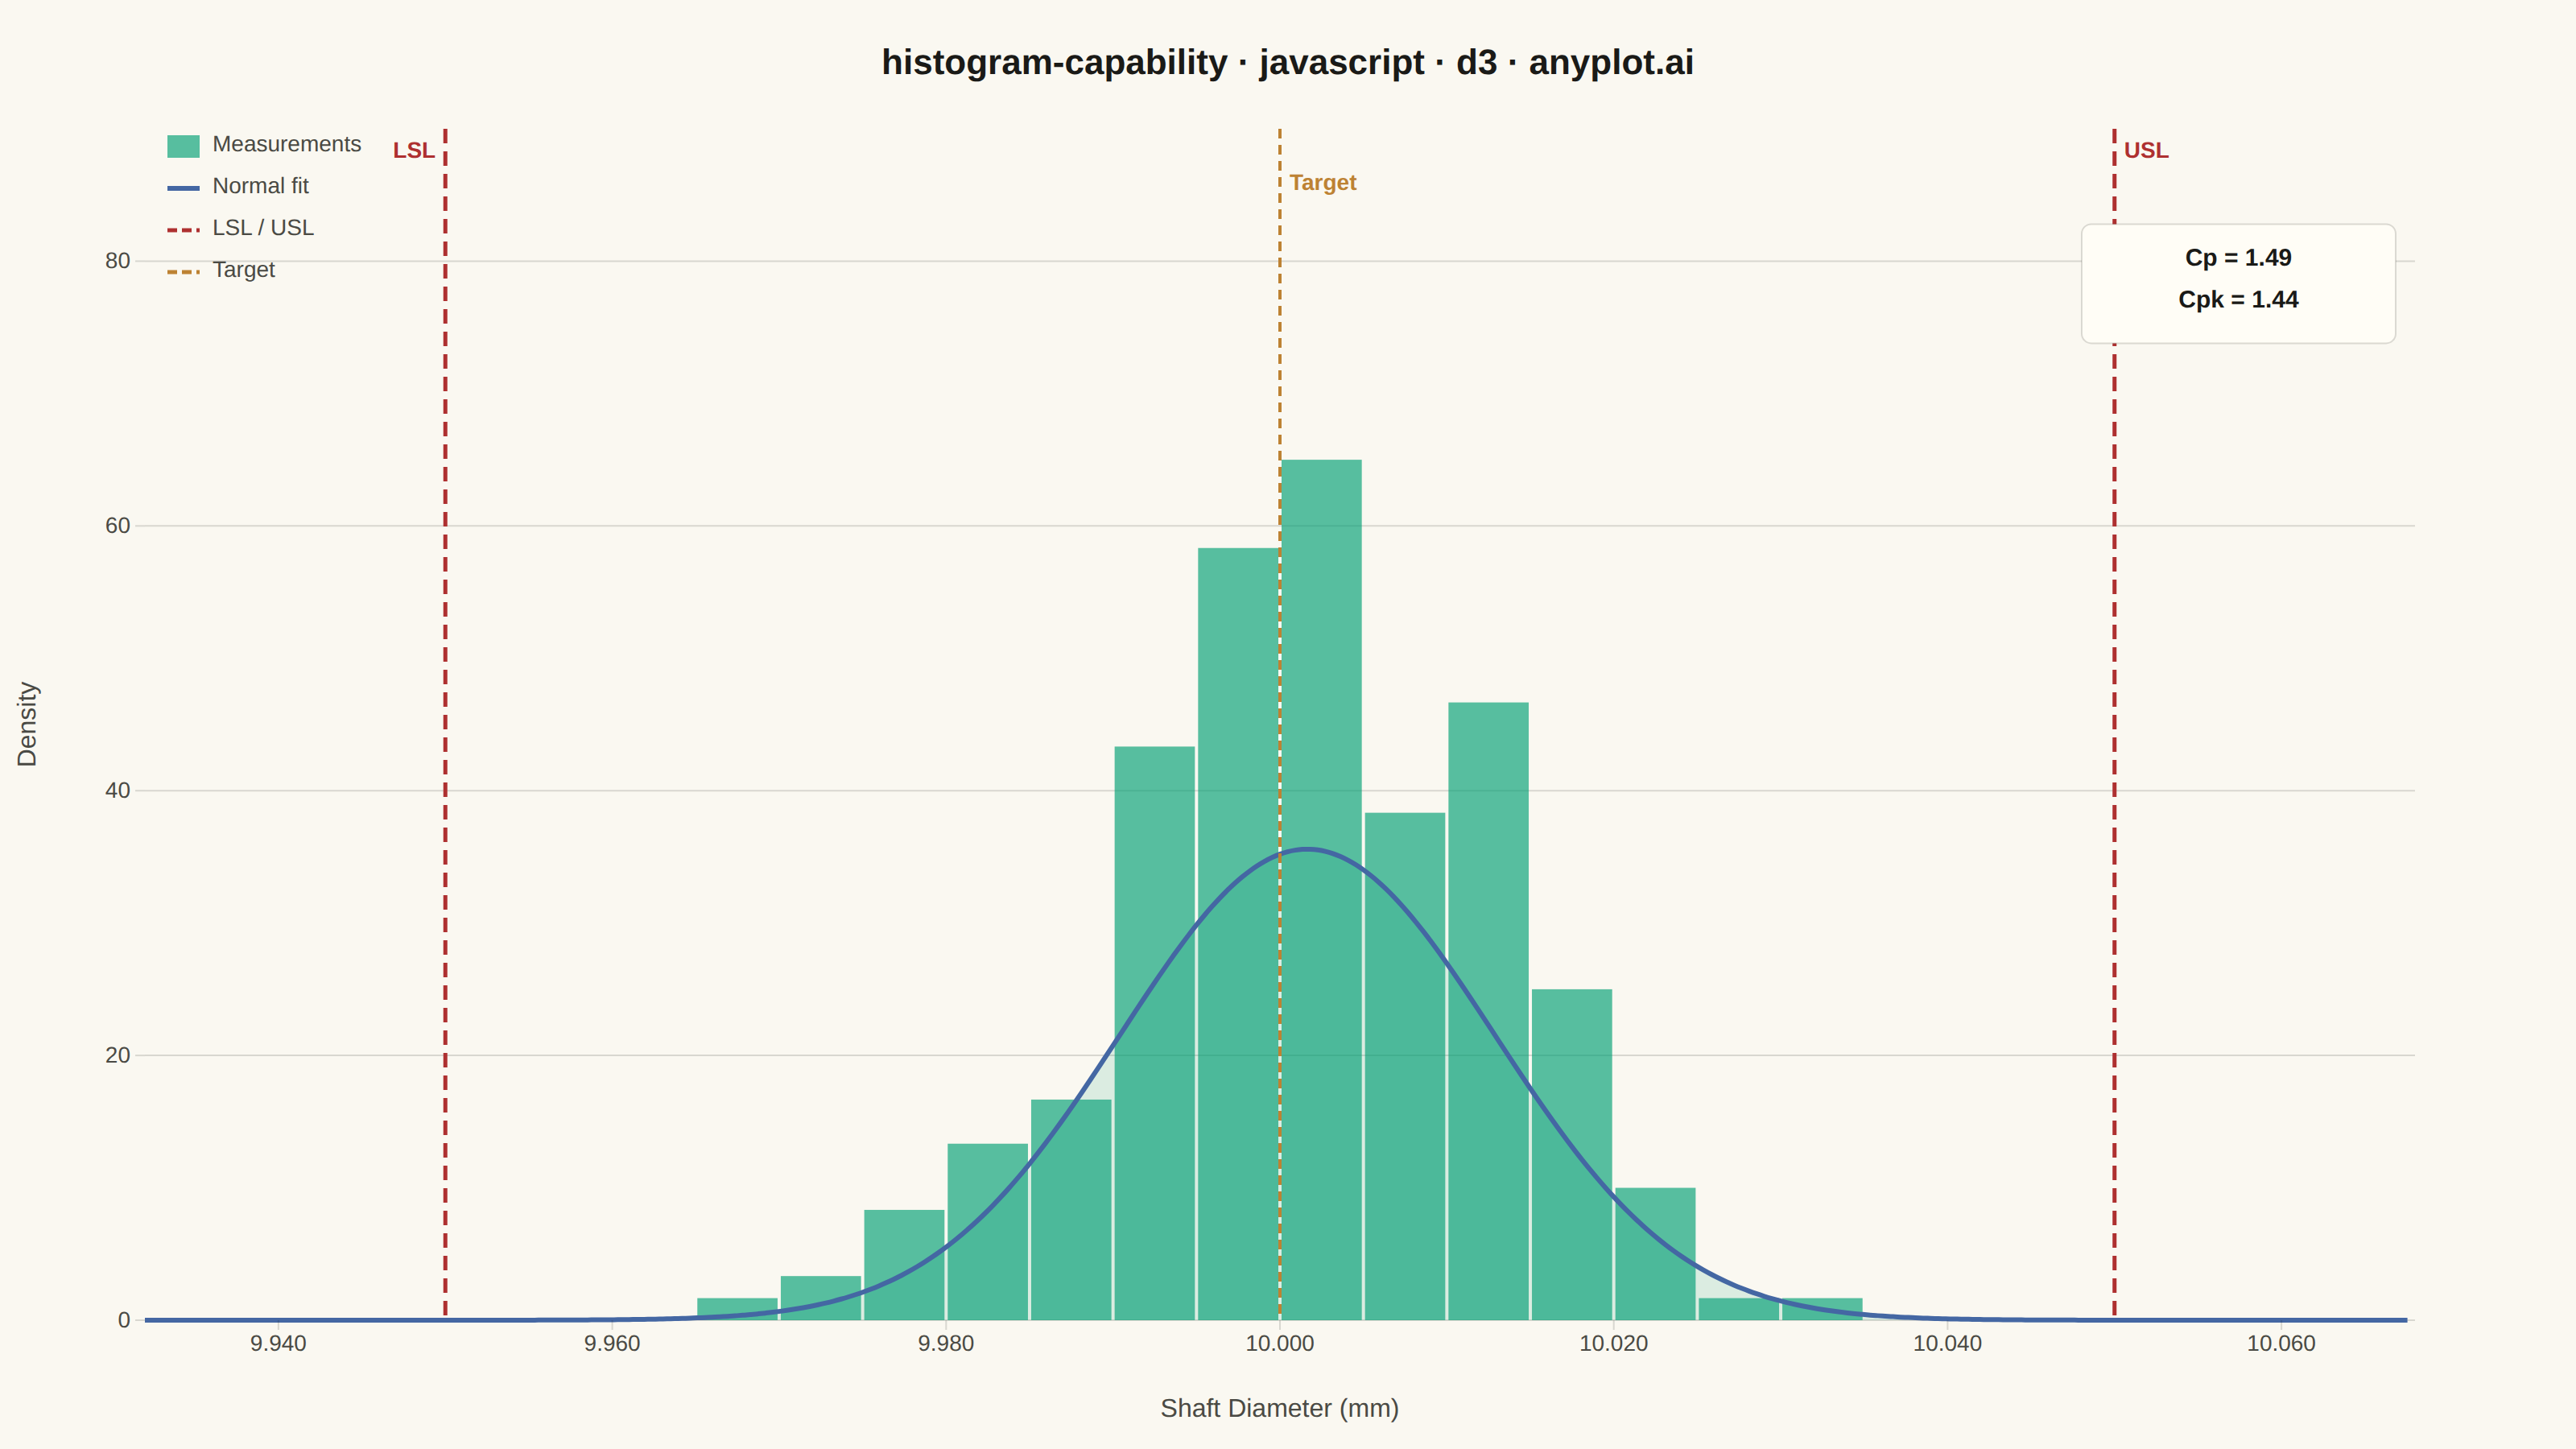
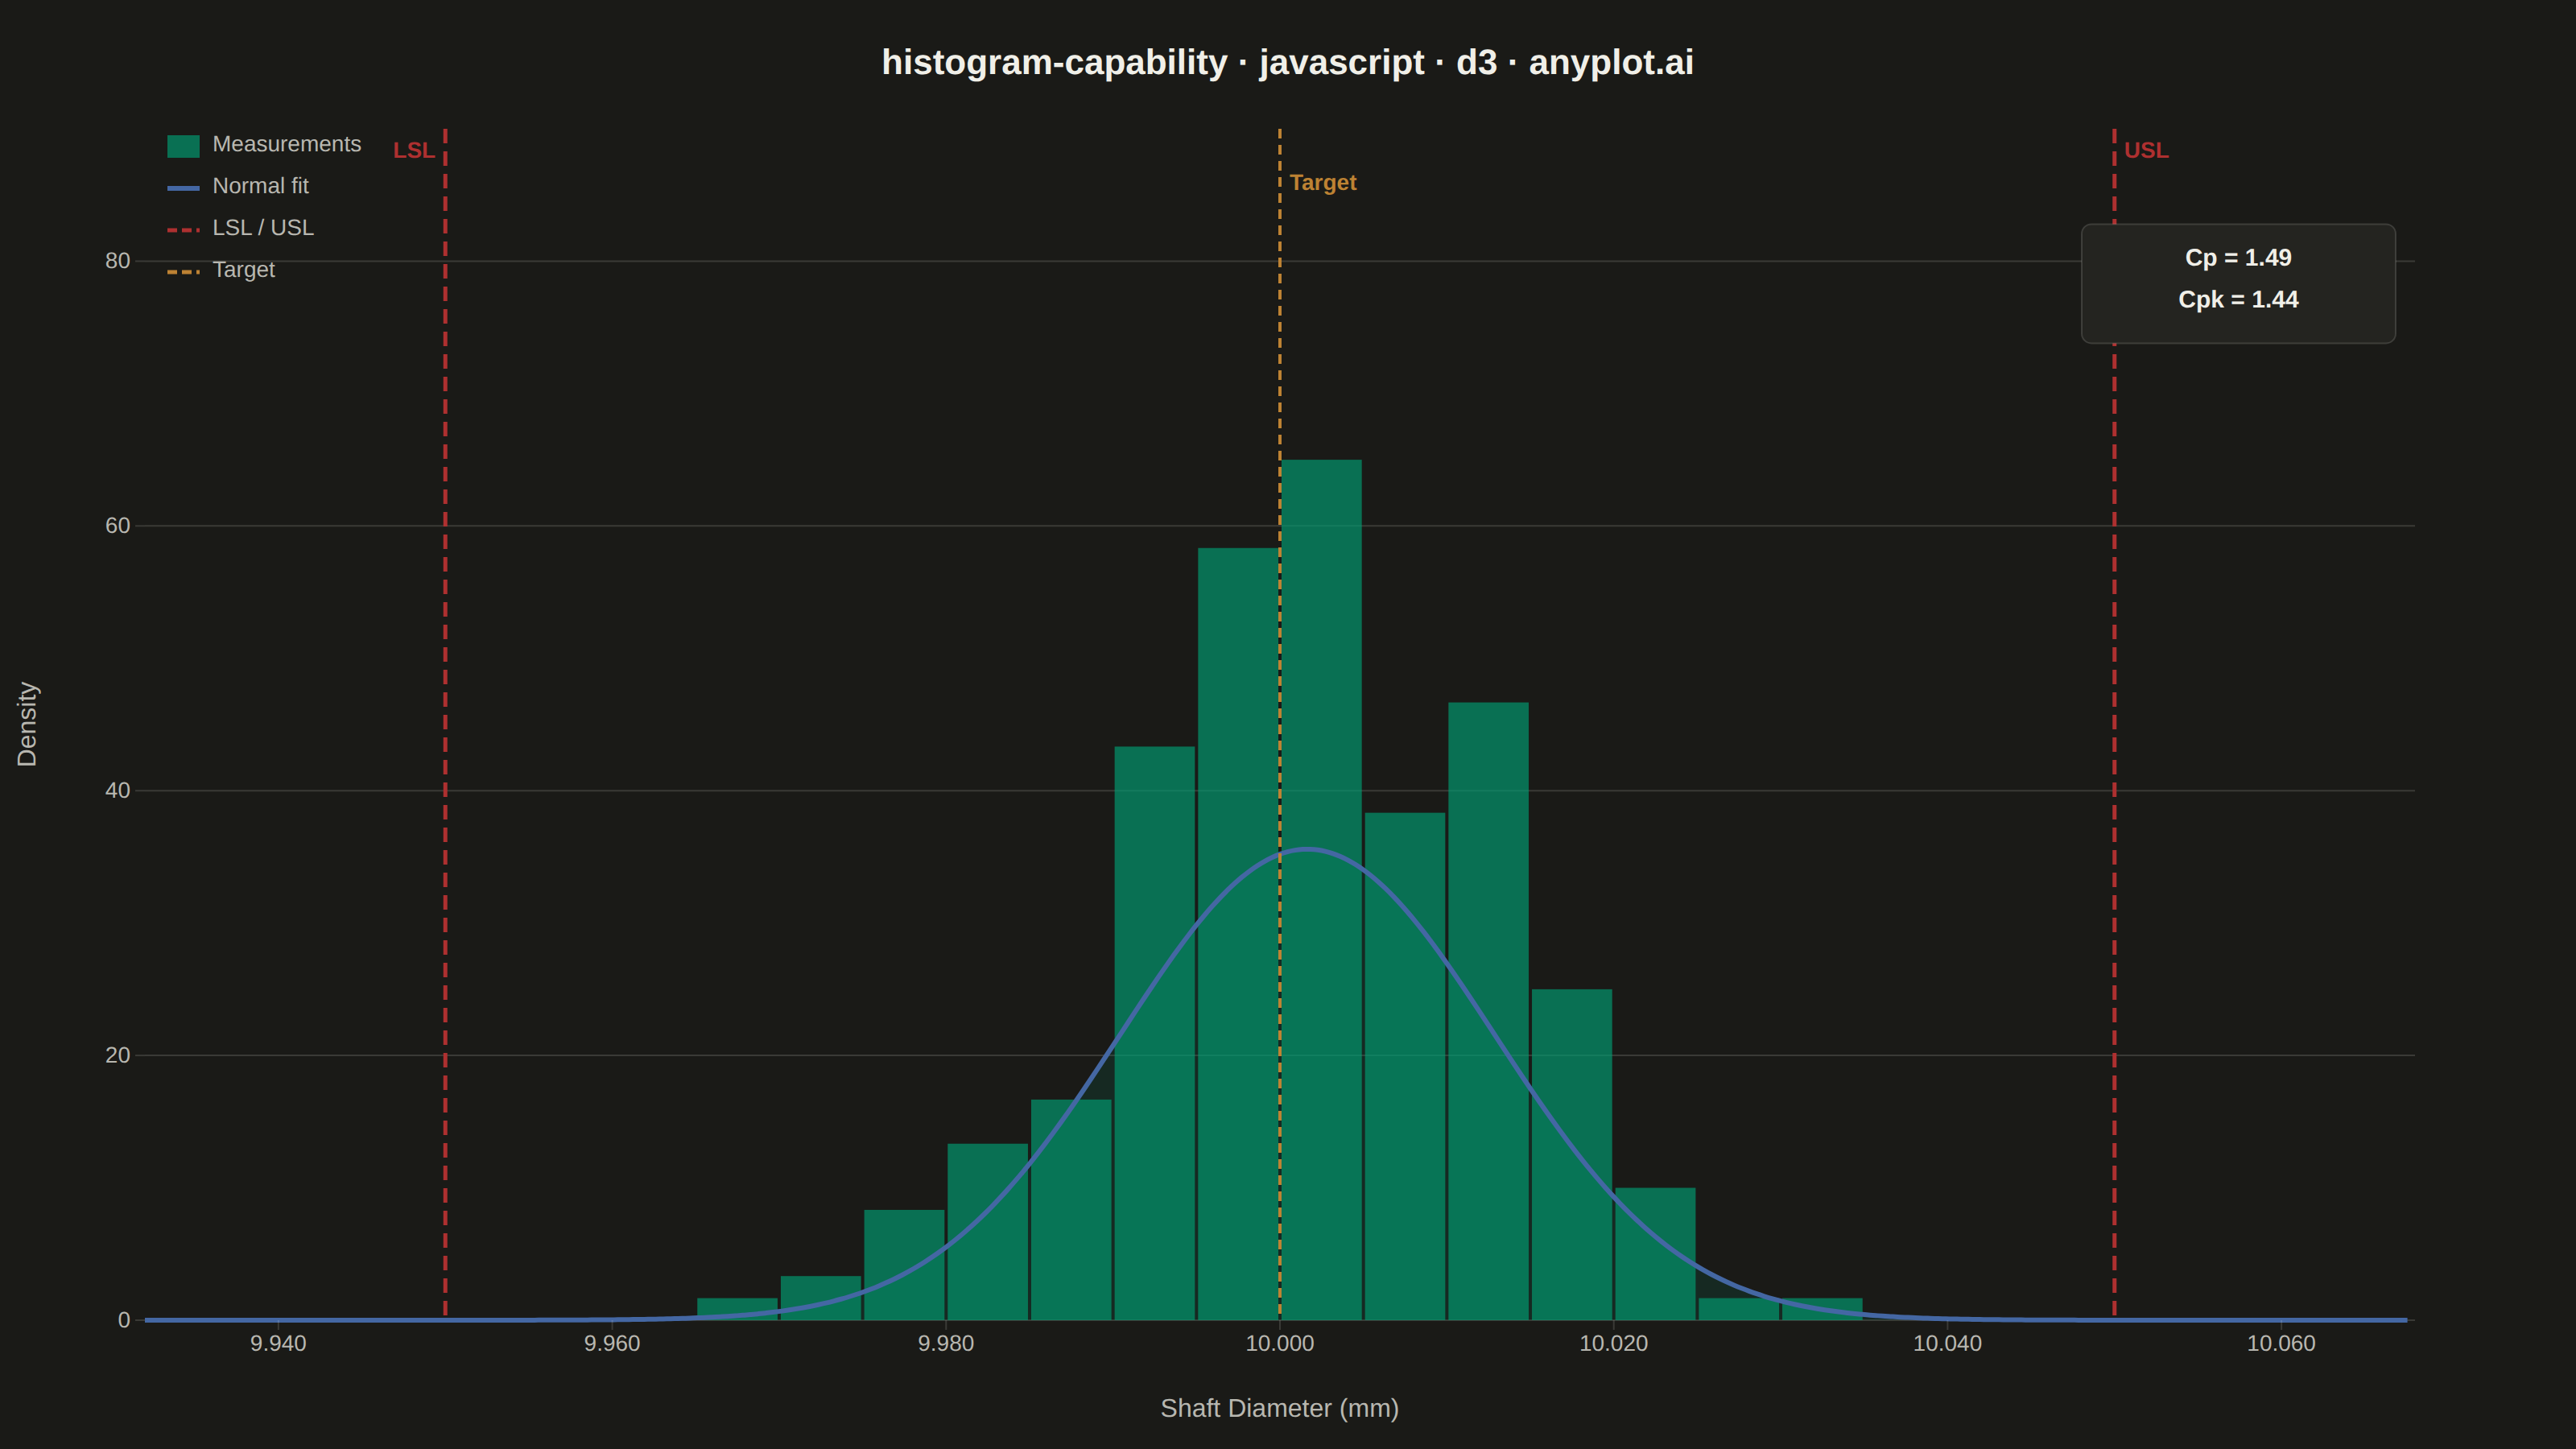
A process capability plot displays a histogram of measured process data overlaid with a fitted normal distribution curve and vertical lines for specification limits (LSL, USL) and target value. Capability indices (Cp, Cpk) are annotated on the plot to quantify how well the process meets specifications. This is a standard tool in quality engineering and Six Sigma for assessing whether a manufacturing or production process is capable of consistently producing output within tolerance.
// anyplot.ai
// histogram-capability: Process Capability Plot with Specification Limits
// Library: d3 7.9.0 | JavaScript 22.22.3
// Quality: 86/100 | Created: 2026-06-20

const t = window.ANYPLOT_TOKENS;
const { width, height } = window.ANYPLOT_SIZE;
const margin = { top: 80, right: 100, bottom: 80, left: 90 };
const iw = width - margin.left - margin.right;
const ih = height - margin.top - margin.bottom;

// --- Data (deterministic LCG + Box-Muller) ---
let seed = 42;
function lcg() {
  seed = (seed * 1664525 + 1013904223) & 0xffffffff;
  return (seed >>> 0) / 4294967296;
}
function randNorm() {
  const u = lcg() || 1e-10;
  const v = lcg();
  return Math.sqrt(-2 * Math.log(u)) * Math.cos(2 * Math.PI * v);
}

const LSL = 9.95, USL = 10.05, TARGET = 10.00;
const N = 200;
const trueMean = 10.001, trueSigma = 0.012;
const measurements = Array.from({ length: N }, () => trueMean + randNorm() * trueSigma);

// --- Statistics ---
const mean = d3.mean(measurements);
const sigma = d3.deviation(measurements);
const Cp = (USL - LSL) / (6 * sigma);
const Cpk = Math.min((USL - mean) / (3 * sigma), (mean - LSL) / (3 * sigma));

// --- Histogram bins ---
const xPad = (USL - LSL) * 0.18;
const xMin = LSL - xPad;
const xMax = USL + xPad;

const bins = d3.bin()
  .domain([xMin, xMax])
  .thresholds(22)(measurements);

const binWidth = bins[0].x1 - bins[0].x0;
const maxDensity = d3.max(bins, (d) => d.length / (N * binWidth));

// Normal PDF
function normalPDF(xv, mu, s) {
  return Math.exp(-0.5 * ((xv - mu) / s) ** 2) / (s * Math.sqrt(2 * Math.PI));
}
const maxPDF = normalPDF(mean, mean, sigma);
const yMax = Math.max(maxDensity, maxPDF) * 1.25;

// --- SVG mount ---
const svg = d3.select("#container")
  .append("svg").attr("width", width).attr("height", height);
const g = svg.append("g").attr("transform", `translate(${margin.left},${margin.top})`);

// --- Scales ---
const x = d3.scaleLinear().domain([xMin, xMax]).range([0, iw]);
const y = d3.scaleLinear().domain([0, yMax]).range([ih, 0]).nice();

// --- Y grid ---
g.append("g").attr("class", "grid")
  .call(d3.axisLeft(y).tickSize(-iw).ticks(6).tickFormat(""))
  .call((ag) => ag.select(".domain").remove())
  .call((ag) => ag.selectAll("line").attr("stroke", t.grid).attr("stroke-width", 1));

// --- In-spec zone (d3.area() fill under normal curve between LSL and USL) ---
const inSpecPoints = Array.from({ length: 201 }, (_, i) => {
  const xv = LSL + (i / 200) * (USL - LSL);
  return { x: xv, y: normalPDF(xv, mean, sigma) };
});
const inSpecArea = d3.area()
  .x((d) => x(d.x))
  .y0(ih)
  .y1((d) => y(d.y))
  .curve(d3.curveBasis);
g.append("path")
  .datum(inSpecPoints)
  .attr("fill", t.palette[0])
  .attr("opacity", 0.12)
  .attr("d", inSpecArea);

// --- Histogram bars ---
g.selectAll(".bar").data(bins).join("rect")
  .attr("class", "bar")
  .attr("x", (d) => x(d.x0) + 1)
  .attr("y", (d) => y(d.length / (N * binWidth)))
  .attr("width", (d) => Math.max(0, x(d.x1) - x(d.x0) - 2))
  .attr("height", (d) => Math.max(0, ih - y(d.length / (N * binWidth))))
  .attr("fill", t.palette[0])
  .attr("opacity", 0.65);

// --- Normal distribution curve ---
const curvePoints = d3.range(xMin, xMax, (xMax - xMin) / 300).map((xv) => ({
  x: xv,
  y: normalPDF(xv, mean, sigma),
}));
const curveLine = d3.line().x((d) => x(d.x)).y((d) => y(d.y)).curve(d3.curveBasis);
g.append("path")
  .datum(curvePoints)
  .attr("fill", "none")
  .attr("stroke", t.palette[2])
  .attr("stroke-width", 3)
  .attr("d", curveLine);

// --- Spec limit lines (LSL / USL) ---
for (const [val, label] of [[LSL, "LSL"], [USL, "USL"]]) {
  g.append("line")
    .attr("x1", x(val)).attr("x2", x(val))
    .attr("y1", 0).attr("y2", ih)
    .attr("stroke", t.palette[4])
    .attr("stroke-width", 2.5)
    .attr("stroke-dasharray", "9,5");
  const lxOff = val < TARGET ? -6 : 6;
  const lAnchor = val < TARGET ? "end" : "start";
  g.append("text")
    .attr("x", x(val) + lxOff)
    .attr("y", 18)
    .attr("text-anchor", lAnchor)
    .attr("fill", t.palette[4])
    .style("font-size", "14px")
    .style("font-weight", "700")
    .text(label);
}

// --- Target line ---
g.append("line")
  .attr("x1", x(TARGET)).attr("x2", x(TARGET))
  .attr("y1", 0).attr("y2", ih)
  .attr("stroke", t.palette[3])
  .attr("stroke-width", 2)
  .attr("stroke-dasharray", "6,4");
g.append("text")
  .attr("x", x(TARGET) + 6)
  .attr("y", 38)
  .attr("text-anchor", "start")
  .attr("fill", t.palette[3])
  .style("font-size", "14px")
  .style("font-weight", "700")
  .text("Target");

// --- Axes ---
const xAxis = g.append("g")
  .attr("transform", `translate(0,${ih})`)
  .call(d3.axisBottom(x).ticks(8).tickFormat(d3.format(".3f")));
const yAxis = g.append("g")
  .call(d3.axisLeft(y).ticks(6));

for (const ax of [xAxis, yAxis]) {
  ax.selectAll("text").attr("fill", t.inkSoft).style("font-size", "14px");
  ax.selectAll("line").attr("stroke", t.grid);
  ax.select(".domain").remove();
}

// --- Axis labels ---
svg.append("text")
  .attr("x", margin.left + iw / 2)
  .attr("y", height - 20)
  .attr("text-anchor", "middle")
  .attr("fill", t.inkSoft)
  .style("font-size", "16px")
  .text("Shaft Diameter (mm)");

svg.append("text")
  .attr("transform", "rotate(-90)")
  .attr("x", -(margin.top + ih / 2))
  .attr("y", 22)
  .attr("text-anchor", "middle")
  .attr("fill", t.inkSoft)
  .style("font-size", "16px")
  .text("Density");

// --- Capability annotation box ---
const boxW = 195, boxH = 74;
const boxX = iw - boxW - 12;
const boxY = ih * 0.08;
g.append("rect")
  .attr("x", boxX).attr("y", boxY)
  .attr("width", boxW).attr("height", boxH)
  .attr("fill", t.elevatedBg)
  .attr("rx", 6)
  .attr("stroke", t.grid)
  .attr("stroke-width", 1);
g.append("text")
  .attr("x", boxX + boxW / 2).attr("y", boxY + 26)
  .attr("text-anchor", "middle")
  .attr("fill", t.ink)
  .style("font-size", "15px")
  .style("font-weight", "700")
  .text(`Cp = ${Cp.toFixed(2)}`);
g.append("text")
  .attr("x", boxX + boxW / 2).attr("y", boxY + 52)
  .attr("text-anchor", "middle")
  .attr("fill", t.ink)
  .style("font-size", "15px")
  .style("font-weight", "700")
  .text(`Cpk = ${Cpk.toFixed(2)}`);

// --- Legend ---
const legendItems = [
  { label: "Measurements", color: t.palette[0], shape: "rect" },
  { label: "Normal fit",   color: t.palette[2], shape: "line" },
  { label: "LSL / USL",   color: t.palette[4], shape: "dash" },
  { label: "Target",       color: t.palette[3], shape: "dash" },
];
const lx0 = 14, ly0 = 14;
legendItems.forEach((item, i) => {
  const iy = ly0 + i * 26;
  if (item.shape === "rect") {
    g.append("rect")
      .attr("x", lx0).attr("y", iy - 10)
      .attr("width", 20).attr("height", 14)
      .attr("fill", item.color).attr("opacity", 0.65);
  } else {
    g.append("line")
      .attr("x1", lx0).attr("x2", lx0 + 20)
      .attr("y1", iy - 3).attr("y2", iy - 3)
      .attr("stroke", item.color)
      .attr("stroke-width", item.shape === "dash" ? 2.5 : 3)
      .attr("stroke-dasharray", item.shape === "dash" ? "6,3" : null);
  }
  g.append("text")
    .attr("x", lx0 + 28).attr("y", iy)
    .attr("fill", t.inkSoft)
    .style("font-size", "14px")
    .text(item.label);
});

// --- Title ---
svg.append("text")
  .attr("x", width / 2).attr("y", 46)
  .attr("text-anchor", "middle")
  .attr("fill", t.ink)
  .style("font-size", "22px")
  .style("font-weight", "600")
  .text("histogram-capability · javascript · d3 · anyplot.ai");
Runnable source as JSON, for any HTTP client: https://api.anyplot.ai/specs/histogram-capability/d3/code. Any spec id and library id listed in llms-full.txt fit the same URL shape; every URL below is complete and callable.
{
  "spec_id": "histogram-capability",
  "language": "javascript",
  "library": "d3",
  "page": "https://anyplot.ai/histogram-capability/javascript/d3",
  "hub": "https://anyplot.ai/histogram-capability",
  "code_json": "https://api.anyplot.ai/specs/histogram-capability/d3/code",
  "spec_json": "https://api.anyplot.ai/specs/histogram-capability",
  "render_light_png": "https://storage.googleapis.com/anyplot-images/plots/histogram-capability/javascript/d3/plot-light.png",
  "render_dark_png": "https://storage.googleapis.com/anyplot-images/plots/histogram-capability/javascript/d3/plot-dark.png",
  "interactive_light_html": "https://storage.googleapis.com/anyplot-images/plots/histogram-capability/javascript/d3/plot-light.html",
  "interactive_dark_html": "https://storage.googleapis.com/anyplot-images/plots/histogram-capability/javascript/d3/plot-dark.html",
  "quality_score": 86.0,
  "license": "MIT",
  "guide": "https://anyplot.ai/llms.txt"
}
Part of Process Capability Plot with Specification Limits on anyplot.ai.