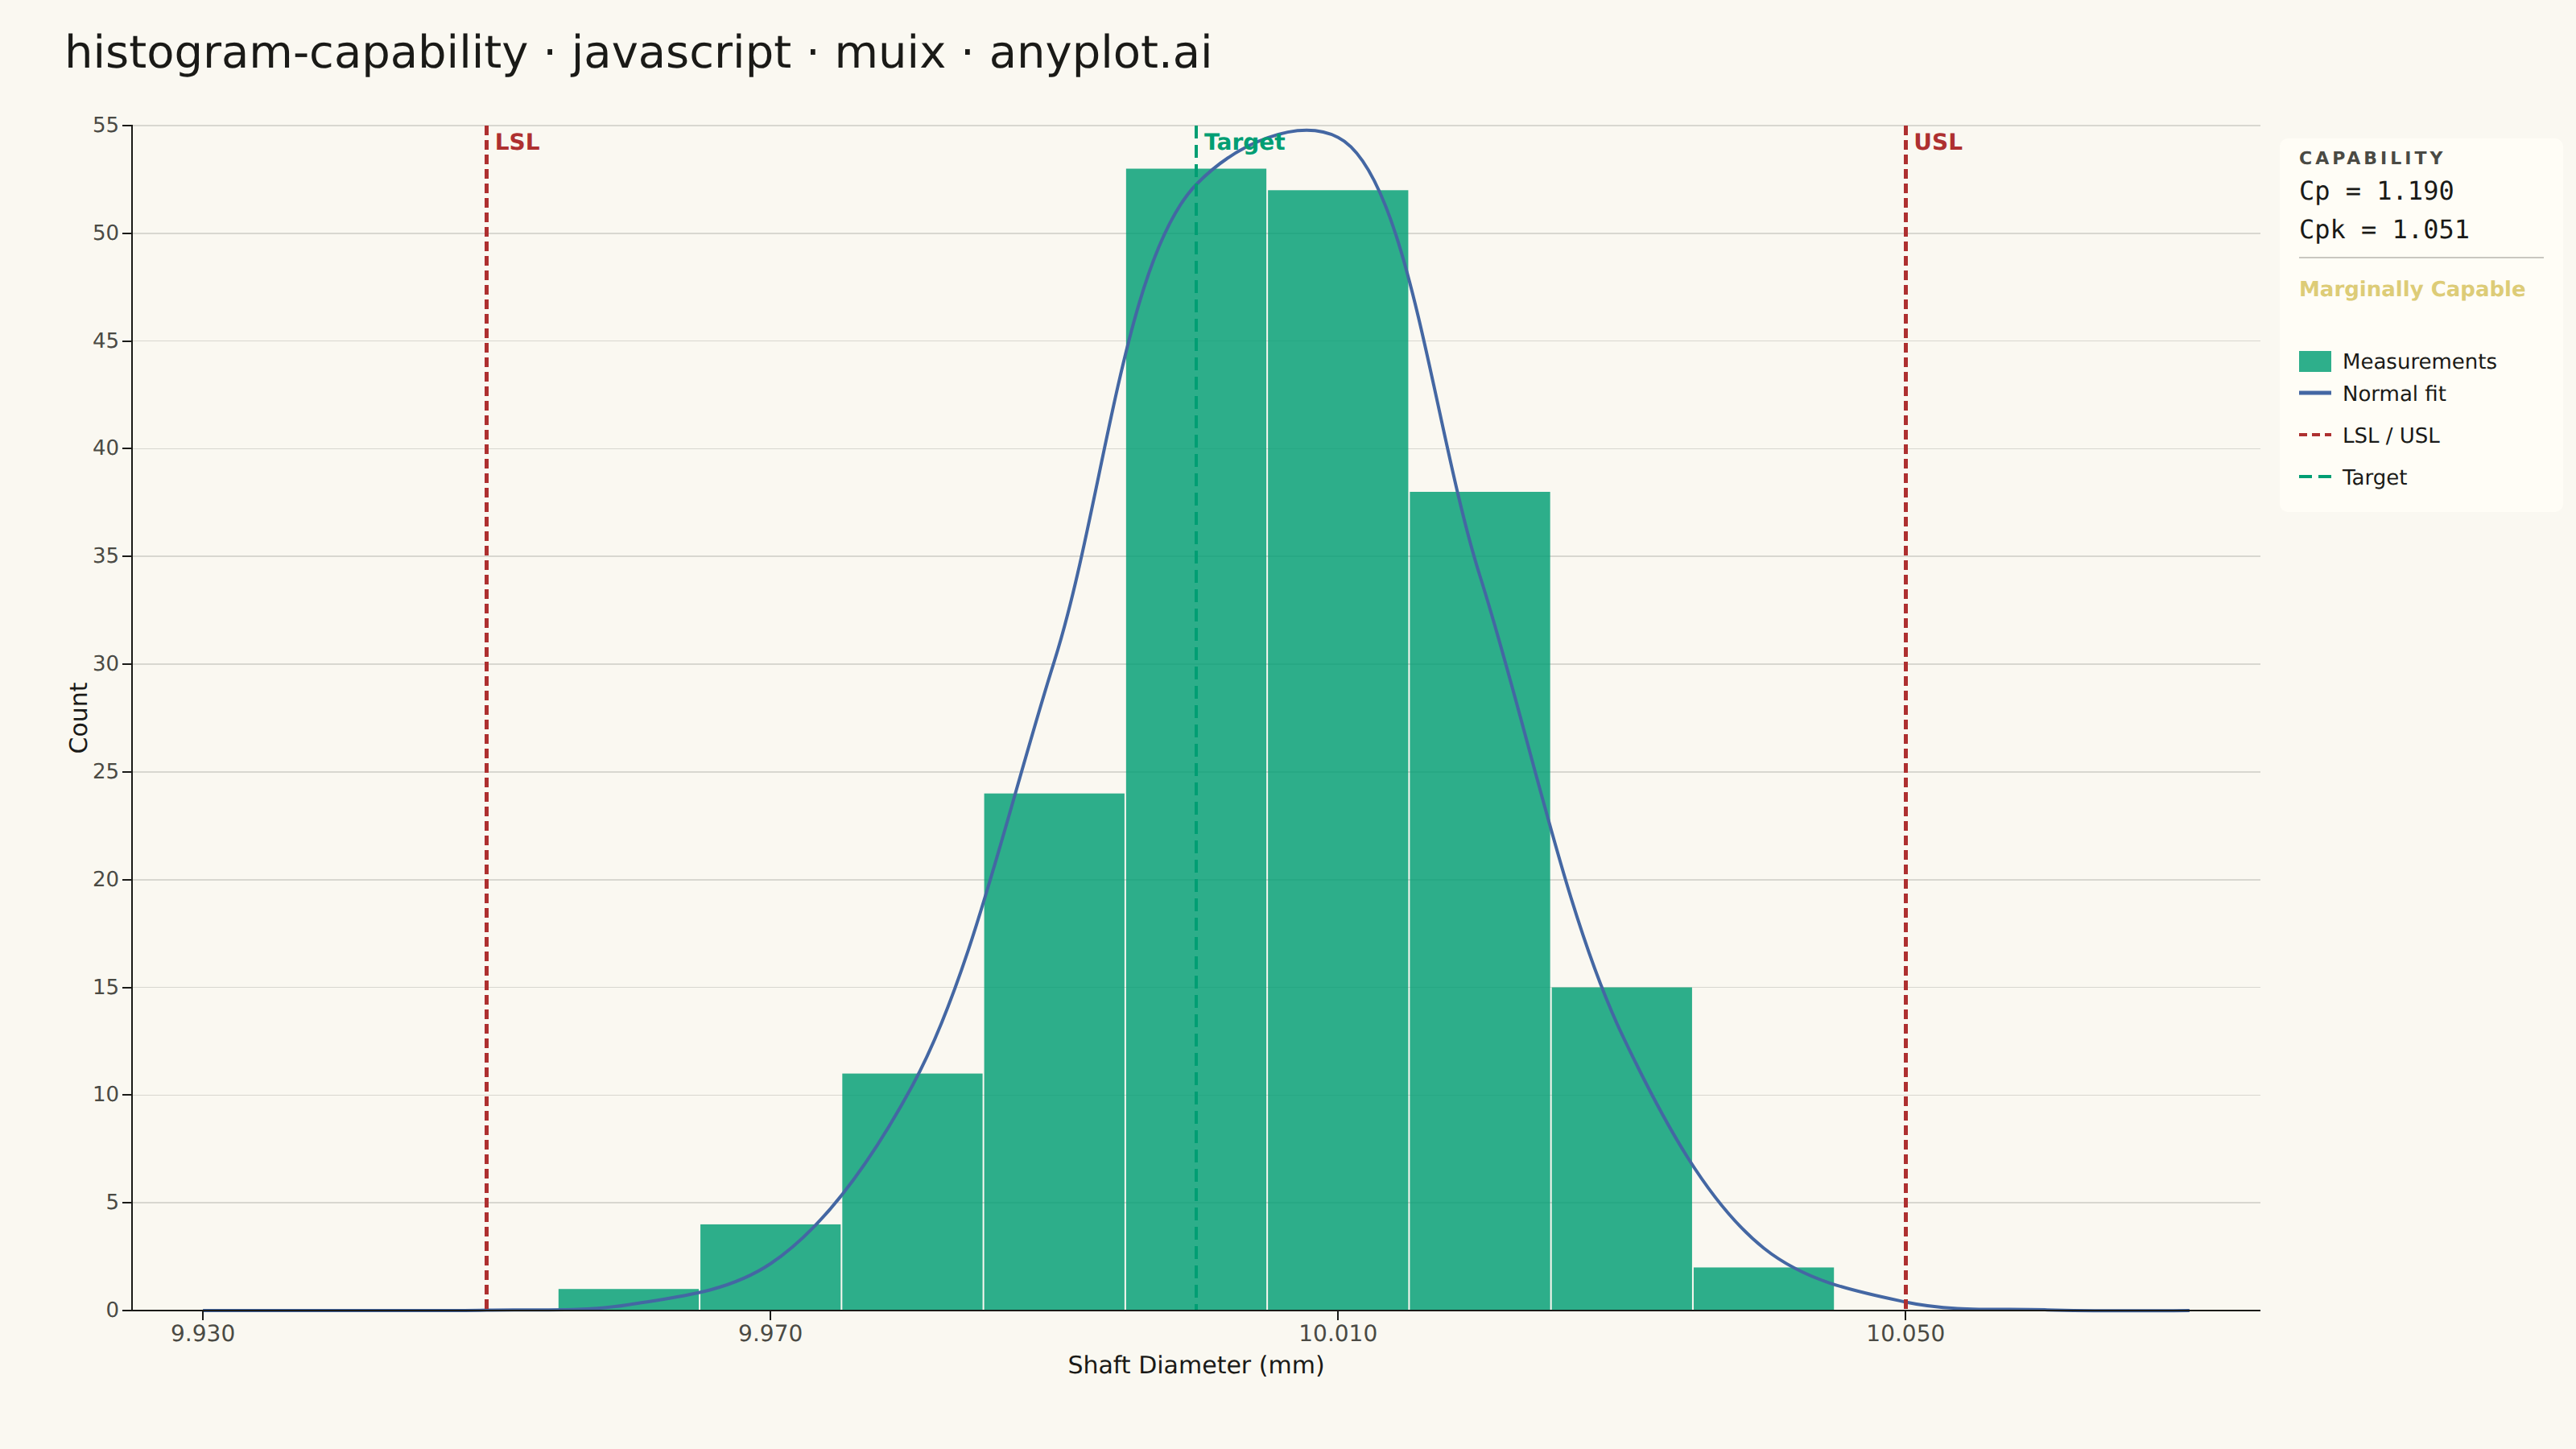
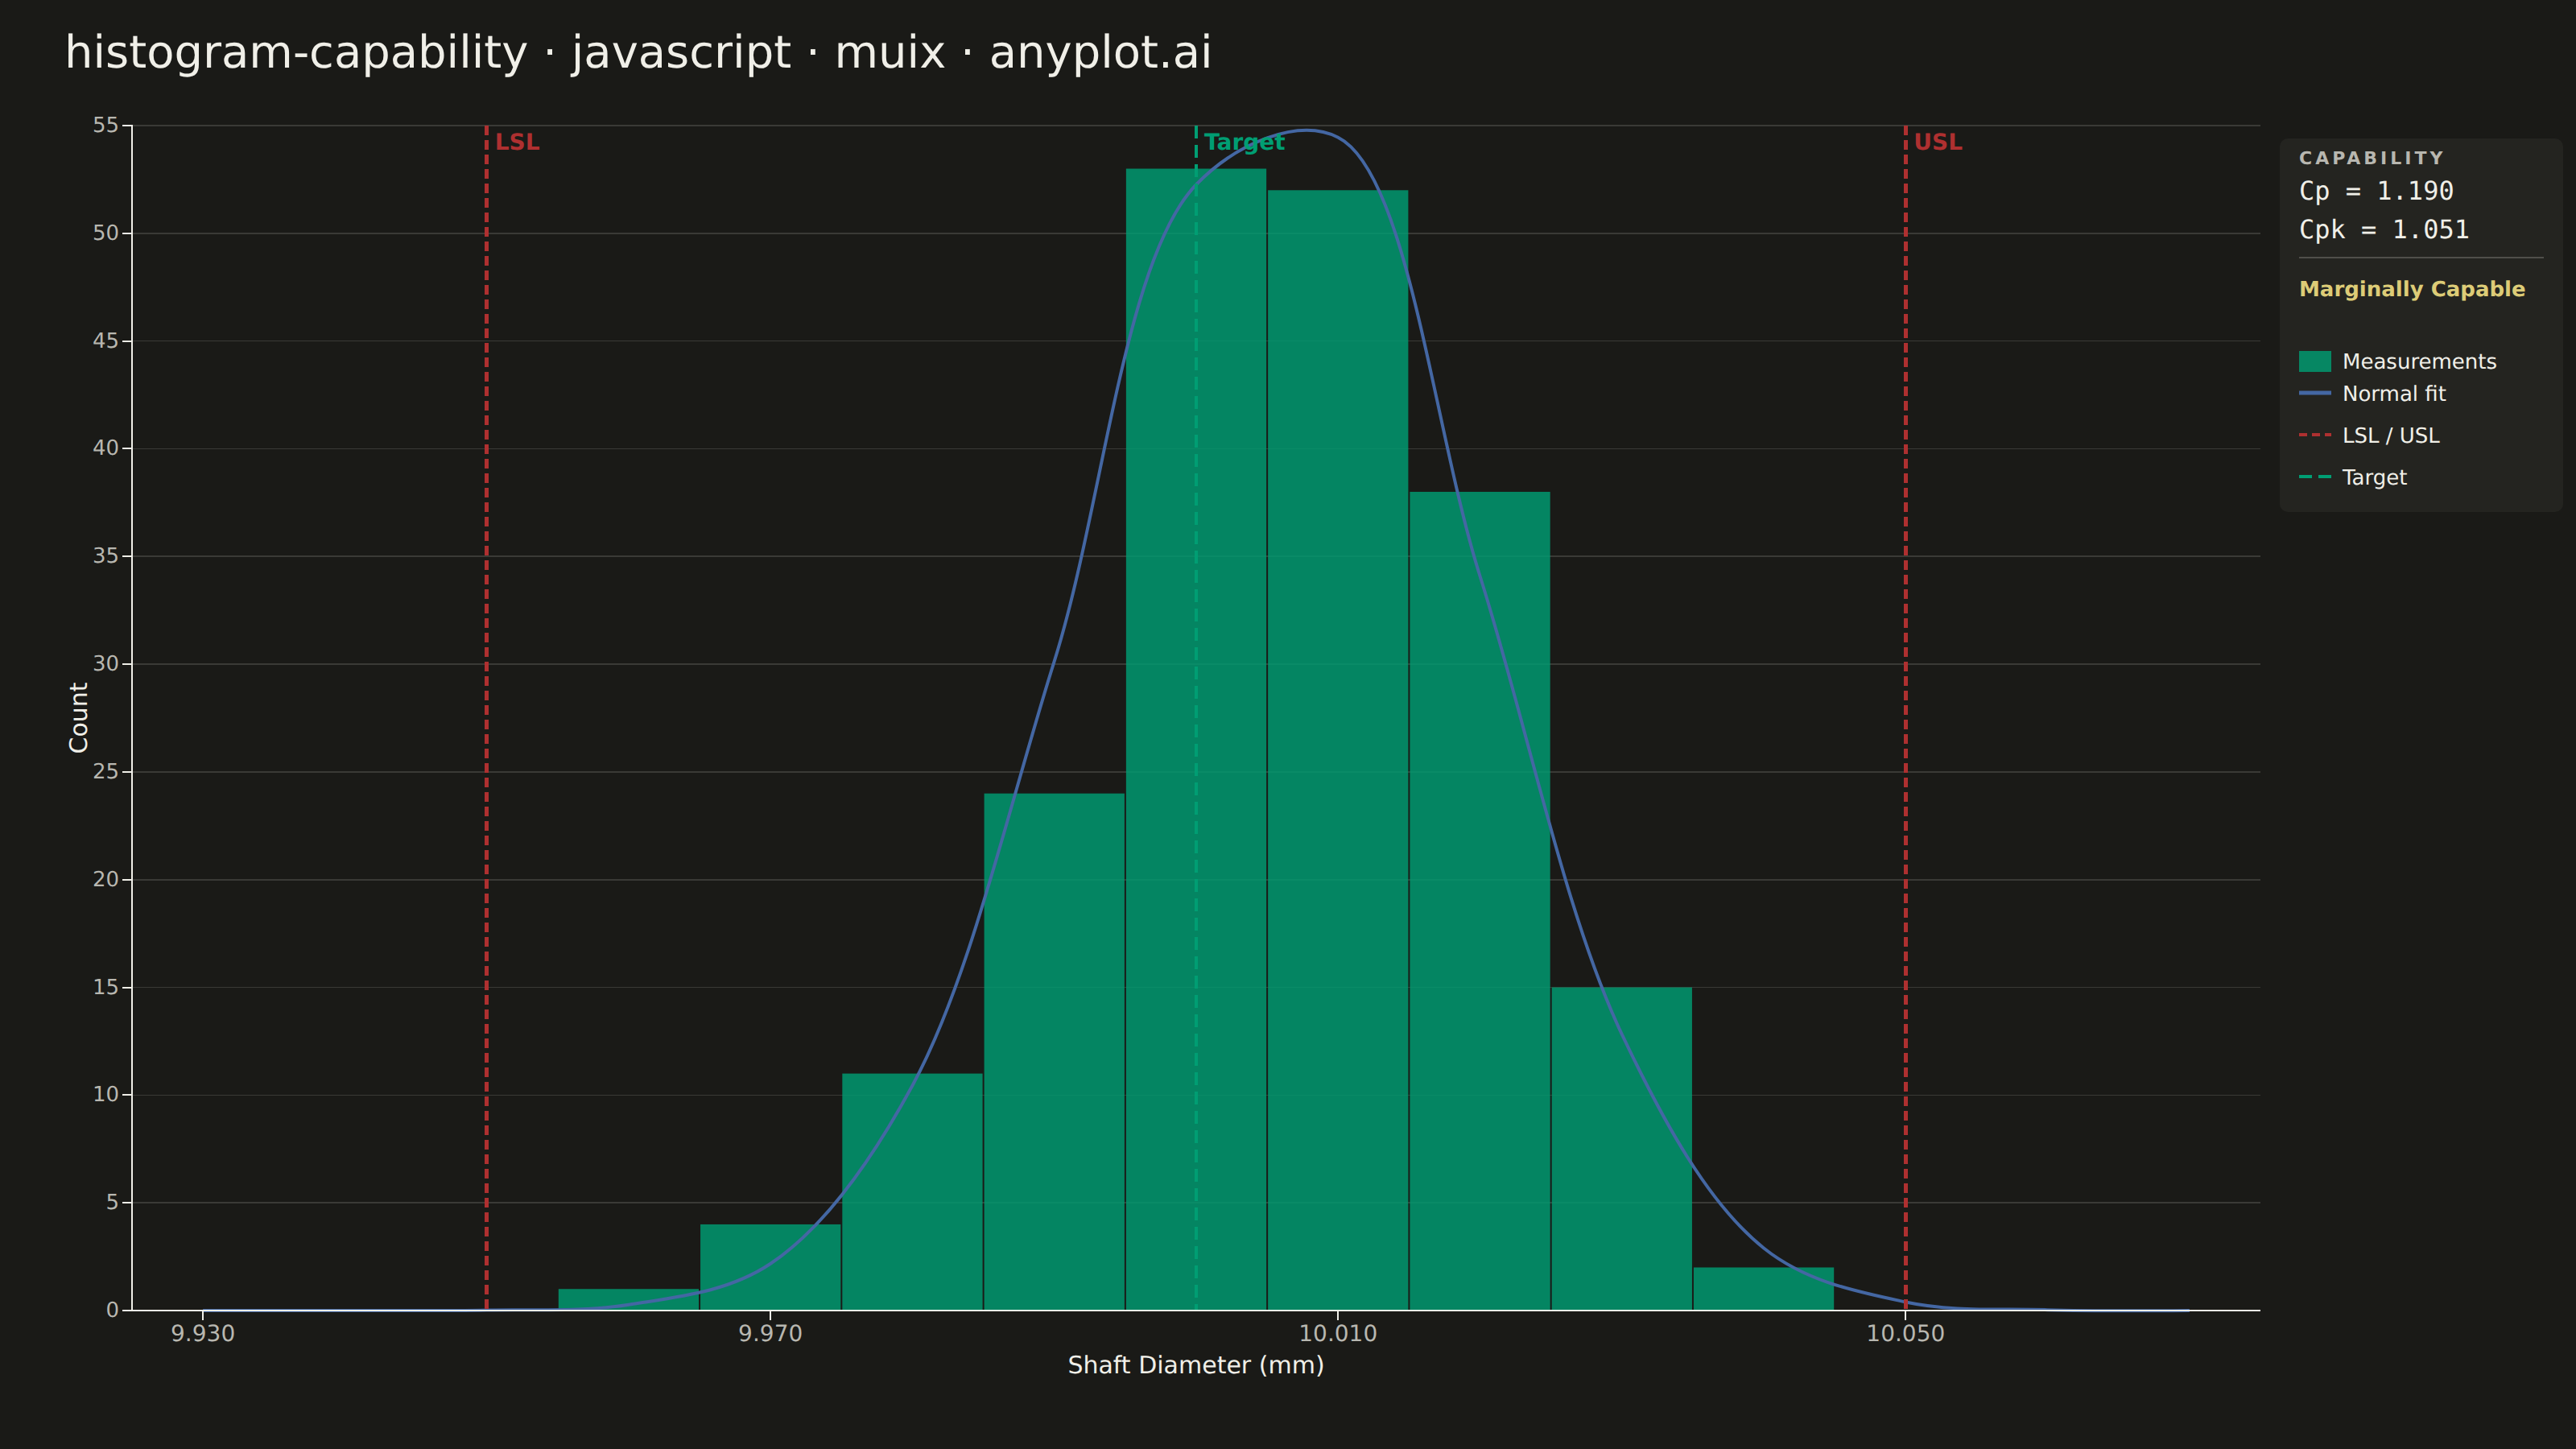
A process capability plot displays a histogram of measured process data overlaid with a fitted normal distribution curve and vertical lines for specification limits (LSL, USL) and target value. Capability indices (Cp, Cpk) are annotated on the plot to quantify how well the process meets specifications. This is a standard tool in quality engineering and Six Sigma for assessing whether a manufacturing or production process is capable of consistently producing output within tolerance.
// anyplot.ai
// histogram-capability: Process Capability Plot with Specification Limits
// Library: muix 7.29.1 | JavaScript 22.22.3
// Quality: 92/100 | Created: 2026-06-20
//# anyplot-orientation: landscape
// anyplot.ai
// histogram-capability: Process Capability Plot with Specification Limits
// Library: MUI X Charts | React | Node 22
// License: @mui/x-charts — MIT (community). Pro/Premium are out of scope.
// Quality: pending | Created: 2026-06-20

import { ChartContainer } from "@mui/x-charts/ChartContainer";
import { LinePlot } from "@mui/x-charts/LineChart";
import { ChartsXAxis } from "@mui/x-charts/ChartsXAxis";
import { ChartsYAxis } from "@mui/x-charts/ChartsYAxis";
import { ChartsReferenceLine } from "@mui/x-charts/ChartsReferenceLine";
import { ChartsGrid } from "@mui/x-charts/ChartsGrid";
import { useDrawingArea } from "@mui/x-charts/hooks";
import Box from "@mui/material/Box";
import Typography from "@mui/material/Typography";

const t = window.ANYPLOT_TOKENS;

// Deterministic LCG + Box-Muller — no seeded Math.random in the browser
let seed = 42;
function lcg() {
  seed = (Math.imul(1664525, seed) + 1013904223) >>> 0;
  return seed / 0x100000000;
}
function randn() {
  const u1 = Math.max(lcg(), 1e-10);
  const u2 = lcg();
  return Math.sqrt(-2 * Math.log(u1)) * Math.cos(2 * Math.PI * u2);
}

// Specification limits for CNC shaft diameter (mm)
const LSL = 9.95;
const USL = 10.05;
const TARGET = 10.00;

// Generate 200 shaft diameter measurements — mean slightly off-target to show Cp vs Cpk difference
const N = 200;
const measurements = Array.from({ length: N }, () => 10.005 + randn() * 0.015);

// Sample statistics
const sampleMean = measurements.reduce((s, v) => s + v, 0) / N;
const sampleSigma = Math.sqrt(
  measurements.reduce((s, v) => s + (v - sampleMean) ** 2, 0) / (N - 1)
);

// Process capability indices
const Cp = (USL - LSL) / (6 * sampleSigma);
const Cpk = Math.min(
  (USL - sampleMean) / (3 * sampleSigma),
  (sampleMean - LSL) / (3 * sampleSigma)
);

// 15 histogram bins from 9.925 to 10.075 (width=0.010)
// Tightened X_MAX to 10.075 to eliminate ~30% empty space beyond USL
const X_MIN = 9.925;
const X_MAX = 10.075;
const BIN_WIDTH = 0.01;
const N_BINS = 15;
const binCenters = Array.from(
  { length: N_BINS },
  (_, i) => parseFloat((X_MIN + (i + 0.5) * BIN_WIDTH).toFixed(3))
);

// Count measurements into bins
const histCounts = new Array(N_BINS).fill(0);
measurements.forEach((v) => {
  const idx = Math.floor((v - X_MIN) / BIN_WIDTH);
  if (idx >= 0 && idx < N_BINS) histCounts[idx]++;
});

// Y-axis ceiling — round up to nearest 5
const Y_MAX = Math.ceil((Math.max(...histCounts) + 2) / 5) * 5;

// Normal distribution PDF scaled to histogram area (so curve and bars share the same y-scale)
const normalValues = binCenters.map((x) => {
  const z = (x - sampleMean) / sampleSigma;
  return (Math.exp(-0.5 * z * z) / (sampleSigma * Math.sqrt(2 * Math.PI))) * N * BIN_WIDTH;
});

// Imprint palette colors
const BRAND = t.palette[0]; // #009E73 — histogram bars (first categorical series)
const BLUE  = t.palette[2]; // #4467A3 — normal fit curve
const RED   = t.palette[4]; // #AE3030 — LSL / USL violation limits

// Title sizing (scale down for longer-than-67-char title)
const TITLE = "histogram-capability · javascript · muix · anyplot.ai";
const titleSize = Math.max(11, Math.round(22 * 67 / TITLE.length));

// Capability status label + colour
const capStatus =
  Cpk >= 1.33 ? "Fully Capable" :
  Cpk >= 1.00 ? "Marginally Capable" : "Not Capable";
const statusColor = Cpk >= 1.33 ? BRAND : Cpk >= 1.00 ? t.amber : RED;

const FONT = "system-ui, -apple-system, sans-serif";

// ---- Custom histogram bars drawn as SVG rects (uses drawing-area coordinate map) ----
function HistogramBars() {
  const { left, top, width, height } = useDrawingArea();
  const binPx = (BIN_WIDTH / (X_MAX - X_MIN)) * width;
  const toX = (v) => left + ((v - X_MIN) / (X_MAX - X_MIN)) * width;
  const toY = (c) => top + (1 - c / Y_MAX) * height;
  return (
    <g>
      {histCounts.map((c, i) => {
        const bx = toX(X_MIN + i * BIN_WIDTH);
        const by = toY(c);
        const bh = top + height - by;
        return (
          <rect
            key={i}
            x={bx + 0.5}
            y={by}
            width={Math.max(0, binPx - 1)}
            height={Math.max(0, bh)}
            fill={BRAND}
            fillOpacity={0.82}
          />
        );
      })}
    </g>
  );
}

// ---- Annotation panel in the right margin: capability indices + series legend ----
function AnnotationPanel() {
  const { left, top, width } = useDrawingArea();
  const px = left + width + 24;
  const py = top + 20;
  const lh = 24;

  return (
    <g fontFamily={FONT}>
      {/* Elevated background separates the panel from the chart area */}
      <rect
        x={px - 12}
        y={py - 12}
        width={176}
        height={232}
        fill={t.elevatedBg}
        rx={5}
        ry={5}
      />
      {/* Section header — small-caps label above the metric values */}
      <text x={px} y={py + 4} fontSize={11} fontWeight="800" fill={t.inkSoft} letterSpacing={2}>
        CAPABILITY
      </text>
      {/* Cp and Cpk values — larger, monospace, prominently readable */}
      <text x={px} y={py + lh + 2} fontSize={16} fill={t.ink} fontFamily="monospace" fontWeight="500">
        {`Cp  = ${Cp.toFixed(3)}`}
      </text>
      <text x={px} y={py + 2 * lh + 2} fontSize={16} fill={t.ink} fontFamily="monospace" fontWeight="500">
        {`Cpk = ${Cpk.toFixed(3)}`}
      </text>
      {/* Divider */}
      <line
        x1={px} y1={py + 2 * lh + 14}
        x2={px + 152} y2={py + 2 * lh + 14}
        stroke={t.inkSoft} strokeWidth={0.8} strokeOpacity={0.4}
      />
      {/* Status */}
      <text x={px} y={py + 3 * lh + 14} fontSize={13} fontWeight="600" fill={statusColor}>
        {capStatus}
      </text>
      {/* Legend — histogram bars */}
      <rect x={px} y={py + 4 * lh + 24} width={20} height={13} fill={BRAND} fillOpacity={0.82} />
      <text x={px + 27} y={py + 4 * lh + 35} fontSize={13} fill={t.ink}>Measurements</text>
      {/* Legend — normal fit line */}
      <line
        x1={px} y1={py + 5 * lh + 26} x2={px + 20} y2={py + 5 * lh + 26}
        stroke={BLUE} strokeWidth={2.5}
      />
      <text x={px + 27} y={py + 5 * lh + 31} fontSize={13} fill={t.ink}>Normal fit</text>
      {/* Legend — LSL/USL lines */}
      <line
        x1={px} y1={py + 6 * lh + 28} x2={px + 20} y2={py + 6 * lh + 28}
        stroke={RED} strokeWidth={2} strokeDasharray="5 3"
      />
      <text x={px + 27} y={py + 6 * lh + 33} fontSize={13} fill={t.ink}>LSL / USL</text>
      {/* Legend — Target line */}
      <line
        x1={px} y1={py + 7 * lh + 30} x2={px + 20} y2={py + 7 * lh + 30}
        stroke={BRAND} strokeWidth={2} strokeDasharray="8 4"
      />
      <text x={px + 27} y={py + 7 * lh + 35} fontSize={13} fill={t.ink}>Target</text>
    </g>
  );
}

// ---- Main component ----
export default function Chart() {
  const { width, height } = window.ANYPLOT_SIZE;
  const TITLE_H = 56;

  return (
    <Box
      sx={{
        width,
        height,
        bgcolor: t.pageBg,
        display: "flex",
        flexDirection: "column",
        overflow: "hidden",
      }}
    >
      {/* Chart title */}
      <Typography
        sx={{
          fontSize: titleSize,
          fontWeight: 500,
          color: t.ink,
          pt: "16px",
          px: "40px",
          pb: 0,
          lineHeight: 1.2,
          fontFamily: FONT,
        }}
      >
        {TITLE}
      </Typography>

      {/* Chart body */}
      <ChartContainer
        width={width}
        height={height - TITLE_H}
        series={[
          {
            type: "line",
            id: "normal",
            data: normalValues,
            label: "Normal fit",
            color: BLUE,
            showMark: false,
            curve: "catmullRom",
          },
        ]}
        xAxis={[
          {
            data: binCenters,
            scaleType: "linear",
            min: X_MIN,
            max: X_MAX,
            // Every 4th bin tick: 9.930, 9.970, 10.010, 10.050 — better readability
            tickInterval: binCenters.filter((_, i) => i % 4 === 0),
            valueFormatter: (v) => v.toFixed(3),
          },
        ]}
        yAxis={[{ min: 0, max: Y_MAX }]}
        margin={{ top: 28, right: 196, bottom: 80, left: 82 }}
        skipAnimation
      >
        <ChartsGrid
          horizontal
          sx={{ "& line": { stroke: t.grid, strokeWidth: 0.8 } }}
        />

        {/* Histogram bars (behind the normal-fit line) */}
        <HistogramBars />

        {/* Normal distribution fit line */}
        <LinePlot skipAnimation />

        {/* Specification limit lines */}
        <ChartsReferenceLine
          x={LSL}
          label="LSL"
          labelAlign="start"
          lineStyle={{ stroke: RED, strokeDasharray: "6 3", strokeWidth: 2.5 }}
          labelStyle={{ fill: RED, fontSize: 14, fontWeight: "bold", fontFamily: FONT }}
        />
        <ChartsReferenceLine
          x={USL}
          label="USL"
          labelAlign="start"
          lineStyle={{ stroke: RED, strokeDasharray: "6 3", strokeWidth: 2.5 }}
          labelStyle={{ fill: RED, fontSize: 14, fontWeight: "bold", fontFamily: FONT }}
        />
        <ChartsReferenceLine
          x={TARGET}
          label="Target"
          labelAlign="start"
          lineStyle={{ stroke: BRAND, strokeDasharray: "8 4", strokeWidth: 2 }}
          labelStyle={{ fill: BRAND, fontSize: 14, fontWeight: "bold", fontFamily: FONT }}
        />

        {/* Axes */}
        <ChartsXAxis
          label="Shaft Diameter (mm)"
          tickLabelStyle={{ fontSize: 14, fill: t.inkSoft, fontFamily: FONT }}
          labelStyle={{ fontSize: 15, fill: t.ink, fontFamily: FONT }}
        />
        <ChartsYAxis
          label="Count"
          tickLabelStyle={{ fontSize: 13, fill: t.inkSoft, fontFamily: FONT }}
          labelStyle={{ fontSize: 15, fill: t.ink, fontFamily: FONT }}
        />

        {/* Capability indices + legend in right margin */}
        <AnnotationPanel />
      </ChartContainer>
    </Box>
  );
}
Runnable source as JSON, for any HTTP client: https://api.anyplot.ai/specs/histogram-capability/muix/code. Any spec id and library id listed in llms-full.txt fit the same URL shape; every URL below is complete and callable.
{
  "spec_id": "histogram-capability",
  "language": "javascript",
  "library": "muix",
  "page": "https://anyplot.ai/histogram-capability/javascript/muix",
  "hub": "https://anyplot.ai/histogram-capability",
  "code_json": "https://api.anyplot.ai/specs/histogram-capability/muix/code",
  "spec_json": "https://api.anyplot.ai/specs/histogram-capability",
  "render_light_png": "https://storage.googleapis.com/anyplot-images/plots/histogram-capability/javascript/muix/plot-light.png",
  "render_dark_png": "https://storage.googleapis.com/anyplot-images/plots/histogram-capability/javascript/muix/plot-dark.png",
  "interactive_light_html": "https://storage.googleapis.com/anyplot-images/plots/histogram-capability/javascript/muix/plot-light.html",
  "interactive_dark_html": "https://storage.googleapis.com/anyplot-images/plots/histogram-capability/javascript/muix/plot-dark.html",
  "quality_score": 92.0,
  "license": "MIT",
  "guide": "https://anyplot.ai/llms.txt"
}
Part of Process Capability Plot with Specification Limits on anyplot.ai.