The same plot in 14 other libraries — JavaScript: D3.js, Apache ECharts, Highcharts, MUI X Charts; Python: Altair, Bokeh, lets-plot, Matplotlib, Plotly, plotnine, Pygal, Seaborn; R: ggplot2; Julia: Makie.jl. Compare all 15 side by side: Stacked Histogram in Python, R, Julia and JavaScript.
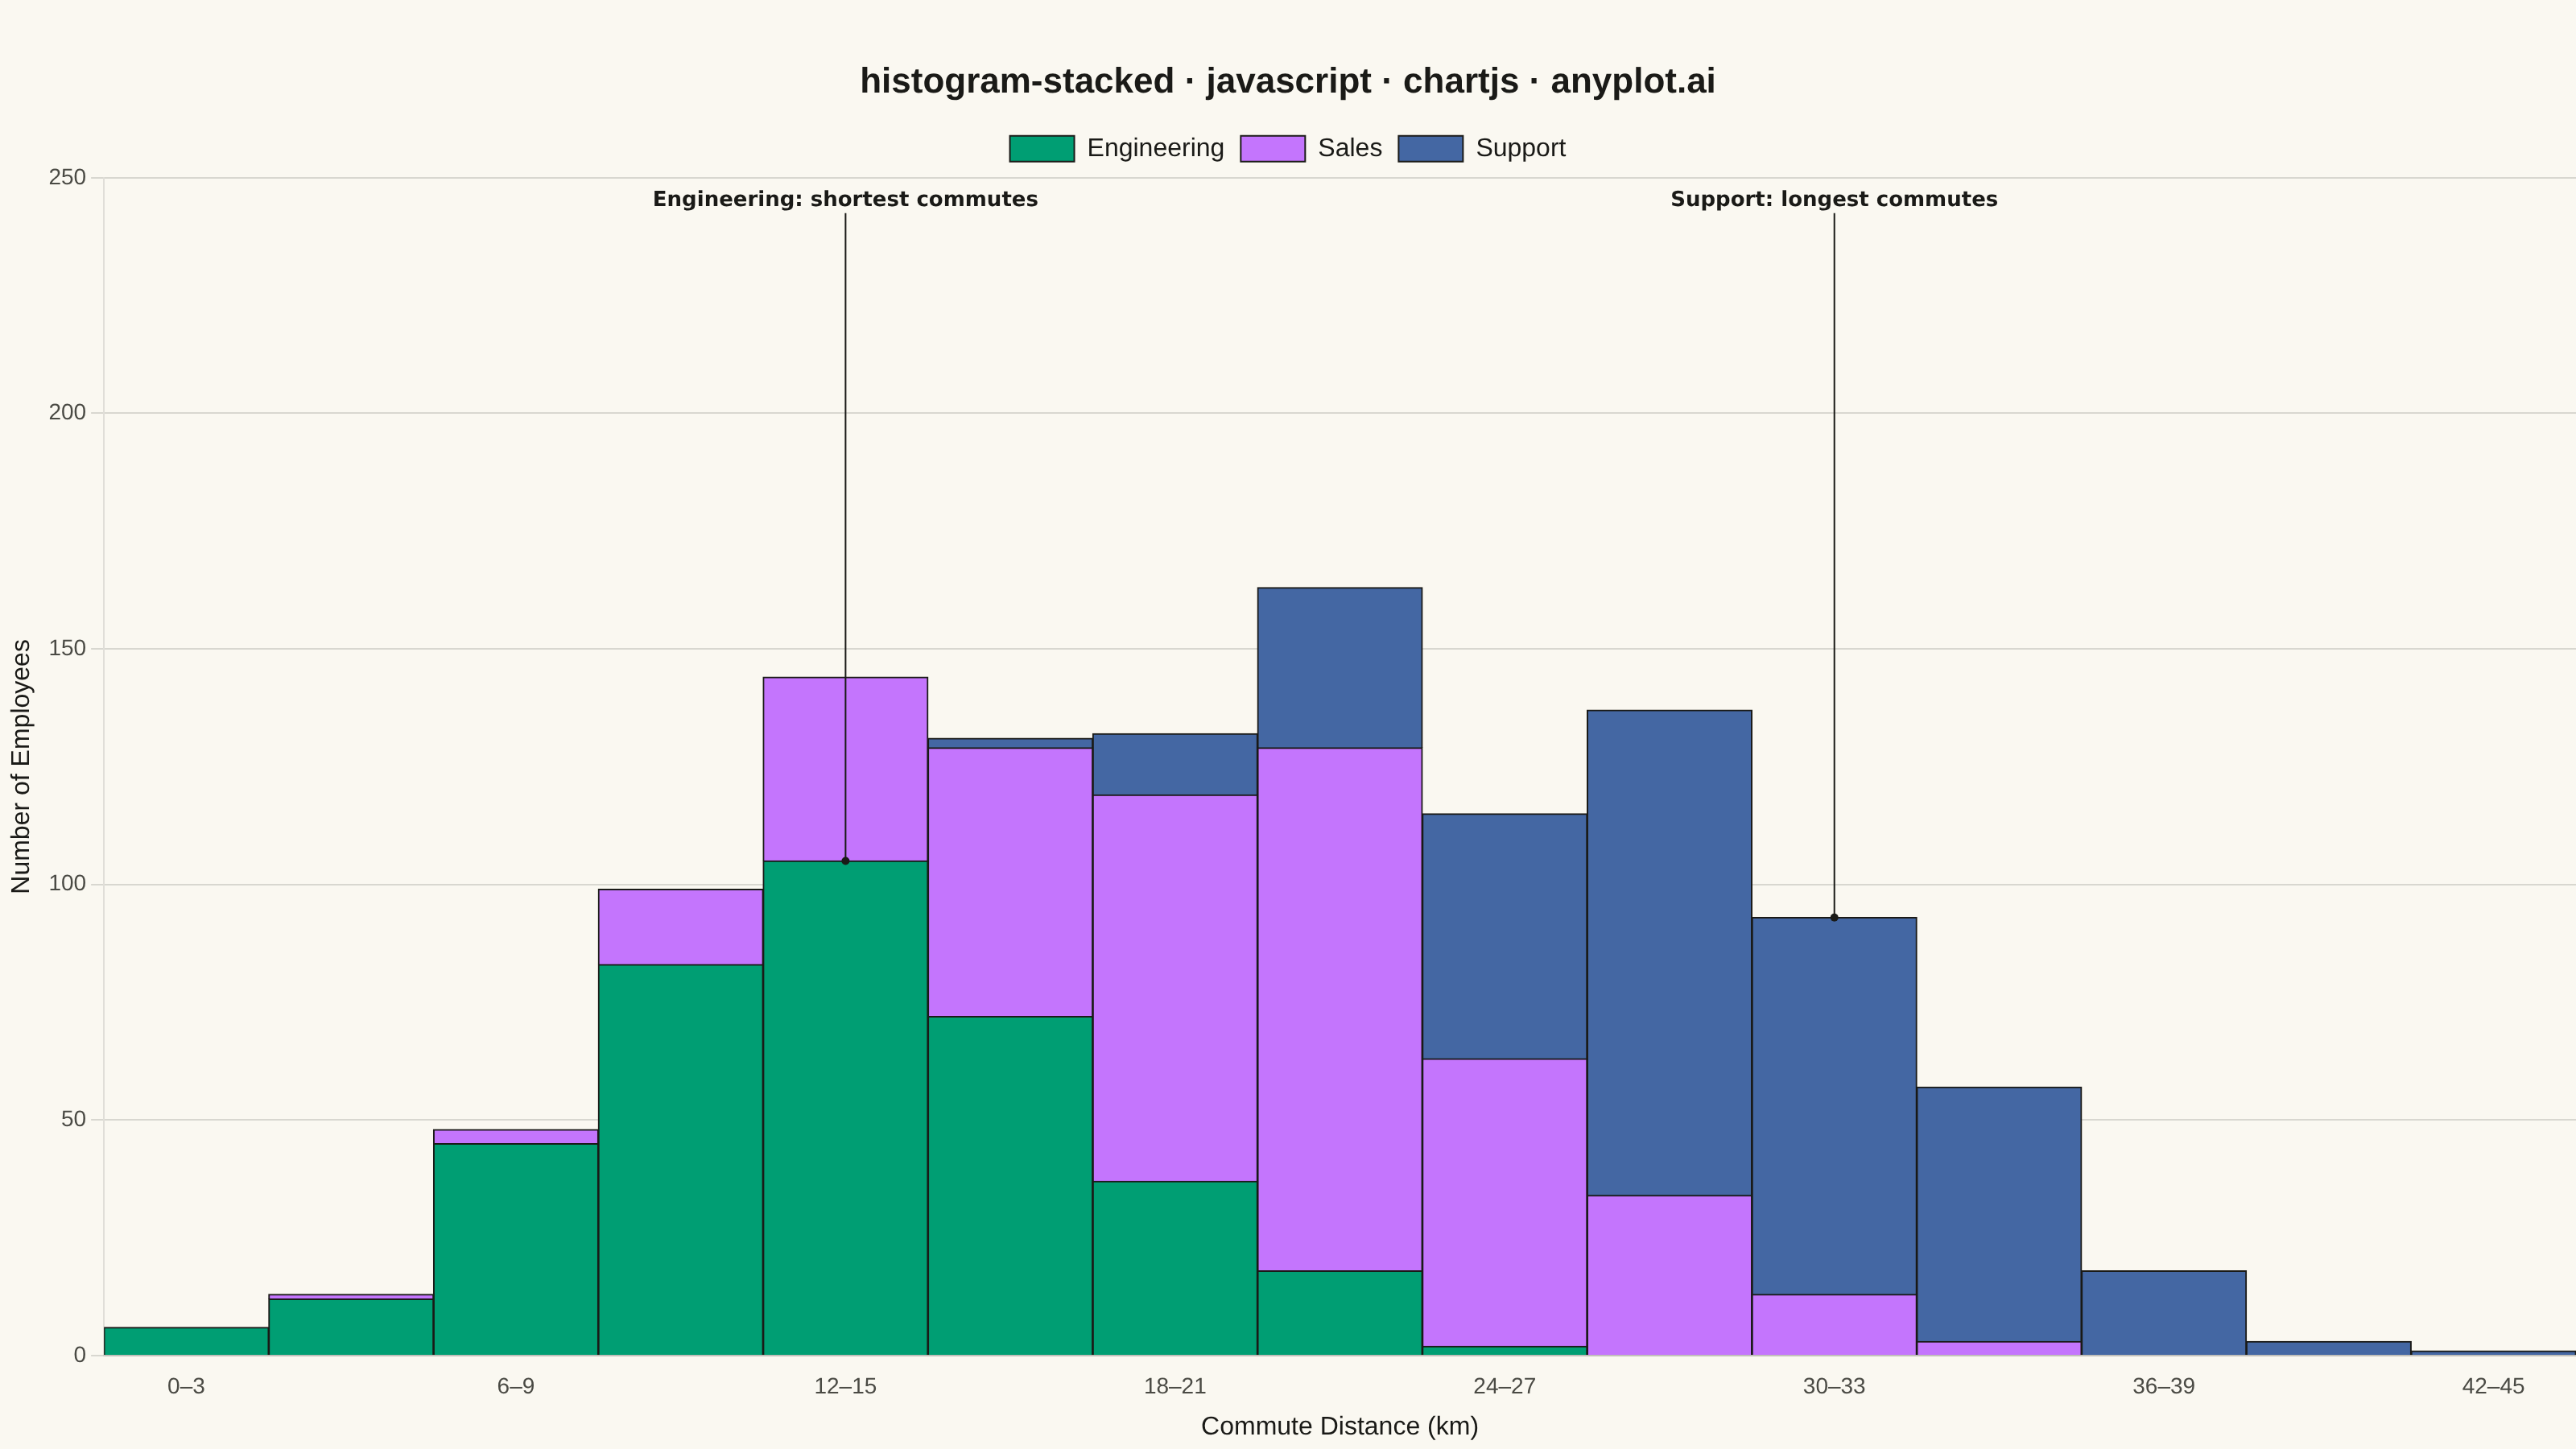
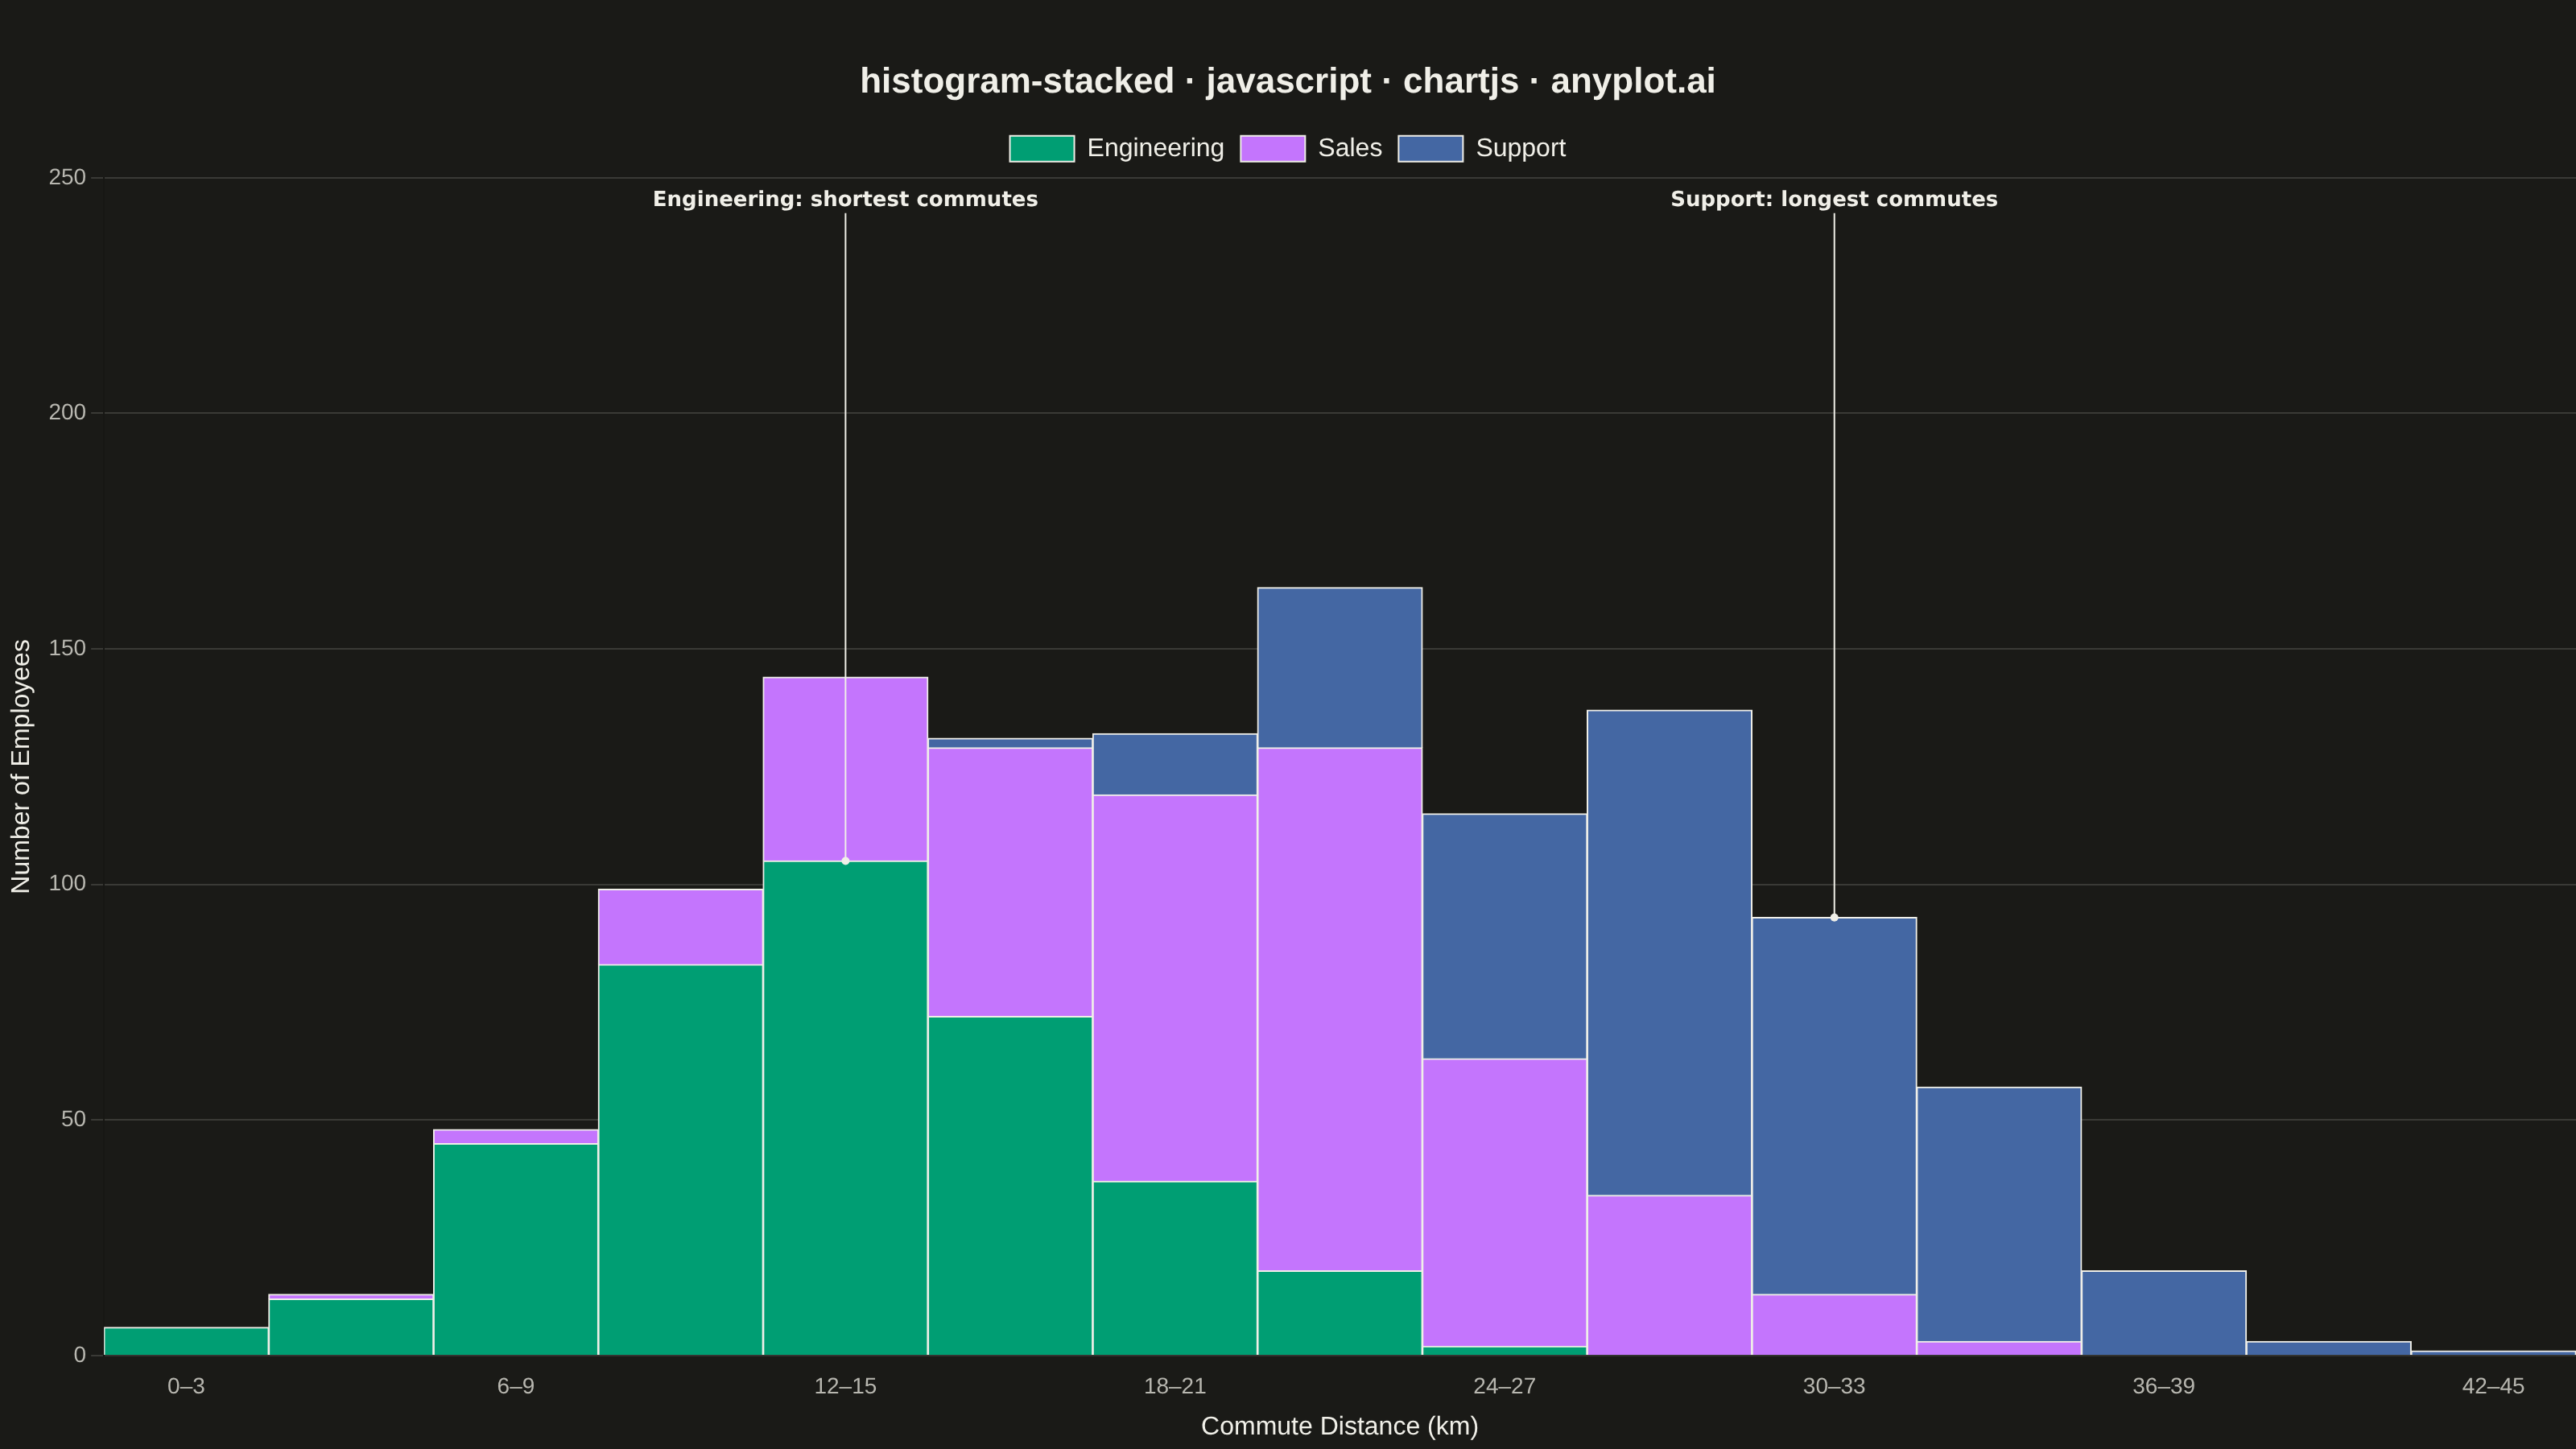
A histogram showing multiple groups stacked on top of each other within each bin. The total bar height represents the combined frequency, while colored segments show individual group contributions.
// anyplot.ai
// histogram-stacked: Stacked Histogram
// Library: chartjs 4.4.7 | JavaScript 22.23.2
// Quality: 93/100 | Created: 2026-09-05

const t = window.ANYPLOT_TOKENS;

// --- Data (in-memory, deterministic) ----------------------------------------
function lcg(seed) {
  let state = seed;
  return () => {
    state = (state * 1103515245 + 12345) % 2147483648;
    return state / 2147483648;
  };
}
const rand = lcg(42);

// Box-Muller transform driven by the LCG above (browser has no seeded RNG).
function normal(mean, stdDev, count) {
  const samples = [];
  for (let i = 0; i < count; i++) {
    const u1 = Math.max(rand(), 1e-9);
    const u2 = rand();
    const z = Math.sqrt(-2 * Math.log(u1)) * Math.cos(2 * Math.PI * u2);
    samples.push(mean + z * stdDev);
  }
  return samples;
}

const GROUPS = [
  { label: "Engineering", values: normal(13, 4.5, 380) },
  { label: "Sales", values: normal(21, 5, 420) },
  { label: "Support", values: normal(29, 4.5, 360) },
];

// Shared bin edges across all groups (0-45 km, 3 km wide bins).
const BIN_WIDTH = 3;
const BIN_COUNT = 15;
const binEdges = Array.from({ length: BIN_COUNT + 1 }, (_, i) => i * BIN_WIDTH);
const binLabels = Array.from({ length: BIN_COUNT }, (_, i) => `${binEdges[i]}–${binEdges[i + 1]}`);

function toCounts(values) {
  const counts = new Array(BIN_COUNT).fill(0);
  values.forEach((v) => {
    const idx = Math.min(Math.max(Math.floor(v / BIN_WIDTH), 0), BIN_COUNT - 1);
    counts[idx] += 1;
  });
  return counts;
}

const counts = GROUPS.map((group) => toCounts(group.values));
const stackTotals = binLabels.map((_, binIdx) => counts.reduce((sum, c) => sum + c[binIdx], 0));
const maxTotal = Math.max(...stackTotals);

// --- Mount -------------------------------------------------------------------
const canvas = document.createElement("canvas");
document.getElementById("container").appendChild(canvas);

// --- Storytelling annotations (Chart.js inline plugin API) -------------------
// Calls out the shortest-/longest-commute groups directly on the canvas,
// anchored to each group's own peak bin, using the plugin's `afterDatasetsDraw`
// hook rather than a static caption.
function mean(values) {
  return values.reduce((sum, v) => sum + v, 0) / values.length;
}
function peakBinIndex(values) {
  return Math.min(Math.max(Math.round(mean(values) / BIN_WIDTH), 0), BIN_COUNT - 1);
}

const insightCallouts = [
  { datasetIndex: 0, binIndex: peakBinIndex(GROUPS[0].values), text: "Engineering: shortest commutes" },
  { datasetIndex: 2, binIndex: peakBinIndex(GROUPS[2].values), text: "Support: longest commutes" },
];

const insightCalloutPlugin = {
  id: "insightCallouts",
  afterDatasetsDraw(chart) {
    const { ctx, chartArea } = chart;
    ctx.save();
    ctx.font = "600 13px system-ui, sans-serif";
    ctx.textAlign = "center";
    insightCallouts.forEach(({ datasetIndex, binIndex, text }) => {
      const bar = chart.getDatasetMeta(datasetIndex).data[binIndex];
      if (!bar) return;
      const labelY = chartArea.top + 14;
      ctx.strokeStyle = t.ink;
      ctx.fillStyle = t.ink;
      ctx.lineWidth = 1;
      ctx.beginPath();
      ctx.moveTo(bar.x, bar.y);
      ctx.lineTo(bar.x, labelY + 8);
      ctx.stroke();
      ctx.beginPath();
      ctx.arc(bar.x, bar.y, 2.5, 0, Math.PI * 2);
      ctx.fill();
      ctx.fillText(text, bar.x, labelY);
    });
    ctx.restore();
  },
};

// --- Chart -------------------------------------------------------------------
new Chart(canvas, {
  type: "bar",
  data: {
    labels: binLabels,
    datasets: GROUPS.map((group, i) => ({
      label: group.label,
      data: counts[i],
      backgroundColor: t.palette[i],
      borderColor: t.ink,
      borderWidth: 1,
      barPercentage: 1.0,
      categoryPercentage: 1.0,
    })),
  },
  plugins: [insightCalloutPlugin],
  options: {
    responsive: true,
    maintainAspectRatio: false,
    animation: false,
    layout: {
      padding: { top: 28 },
    },
    plugins: {
      title: {
        display: true,
        text: "histogram-stacked · javascript · chartjs · anyplot.ai",
        color: t.ink,
        font: { size: 22 },
      },
      legend: {
        display: true,
        position: "top",
        labels: { color: t.ink, font: { size: 16 } },
      },
    },
    scales: {
      x: {
        stacked: true,
        ticks: { color: t.inkSoft, font: { size: 14 }, maxRotation: 0, autoSkip: true, maxTicksLimit: 10 },
        grid: { display: false },
        title: { display: true, text: "Commute Distance (km)", color: t.ink, font: { size: 16 } },
      },
      y: {
        stacked: true,
        beginAtZero: true,
        suggestedMax: Math.ceil(maxTotal * 1.25),
        ticks: { color: t.inkSoft, font: { size: 14 } },
        grid: { color: t.grid },
        title: { display: true, text: "Number of Employees", color: t.ink, font: { size: 16 } },
      },
    },
  },
});
Runnable source as JSON, for any HTTP client: https://api.anyplot.ai/specs/histogram-stacked/chartjs/code. Any spec id and library id listed in llms-full.txt fit the same URL shape; every URL below is complete and callable.
{
  "spec_id": "histogram-stacked",
  "language": "javascript",
  "library": "chartjs",
  "page": "https://anyplot.ai/histogram-stacked/javascript/chartjs",
  "hub": "https://anyplot.ai/histogram-stacked",
  "code_json": "https://api.anyplot.ai/specs/histogram-stacked/chartjs/code",
  "spec_json": "https://api.anyplot.ai/specs/histogram-stacked",
  "render_light_png": "https://storage.googleapis.com/anyplot-images/plots/histogram-stacked/javascript/chartjs/plot-light.png",
  "render_dark_png": "https://storage.googleapis.com/anyplot-images/plots/histogram-stacked/javascript/chartjs/plot-dark.png",
  "interactive_light_html": "https://storage.googleapis.com/anyplot-images/plots/histogram-stacked/javascript/chartjs/plot-light.html",
  "interactive_dark_html": "https://storage.googleapis.com/anyplot-images/plots/histogram-stacked/javascript/chartjs/plot-dark.html",
  "quality_score": 93.0,
  "license": "MIT",
  "guide": "https://anyplot.ai/llms.txt"
}
Part of Stacked Histogram on anyplot.ai.