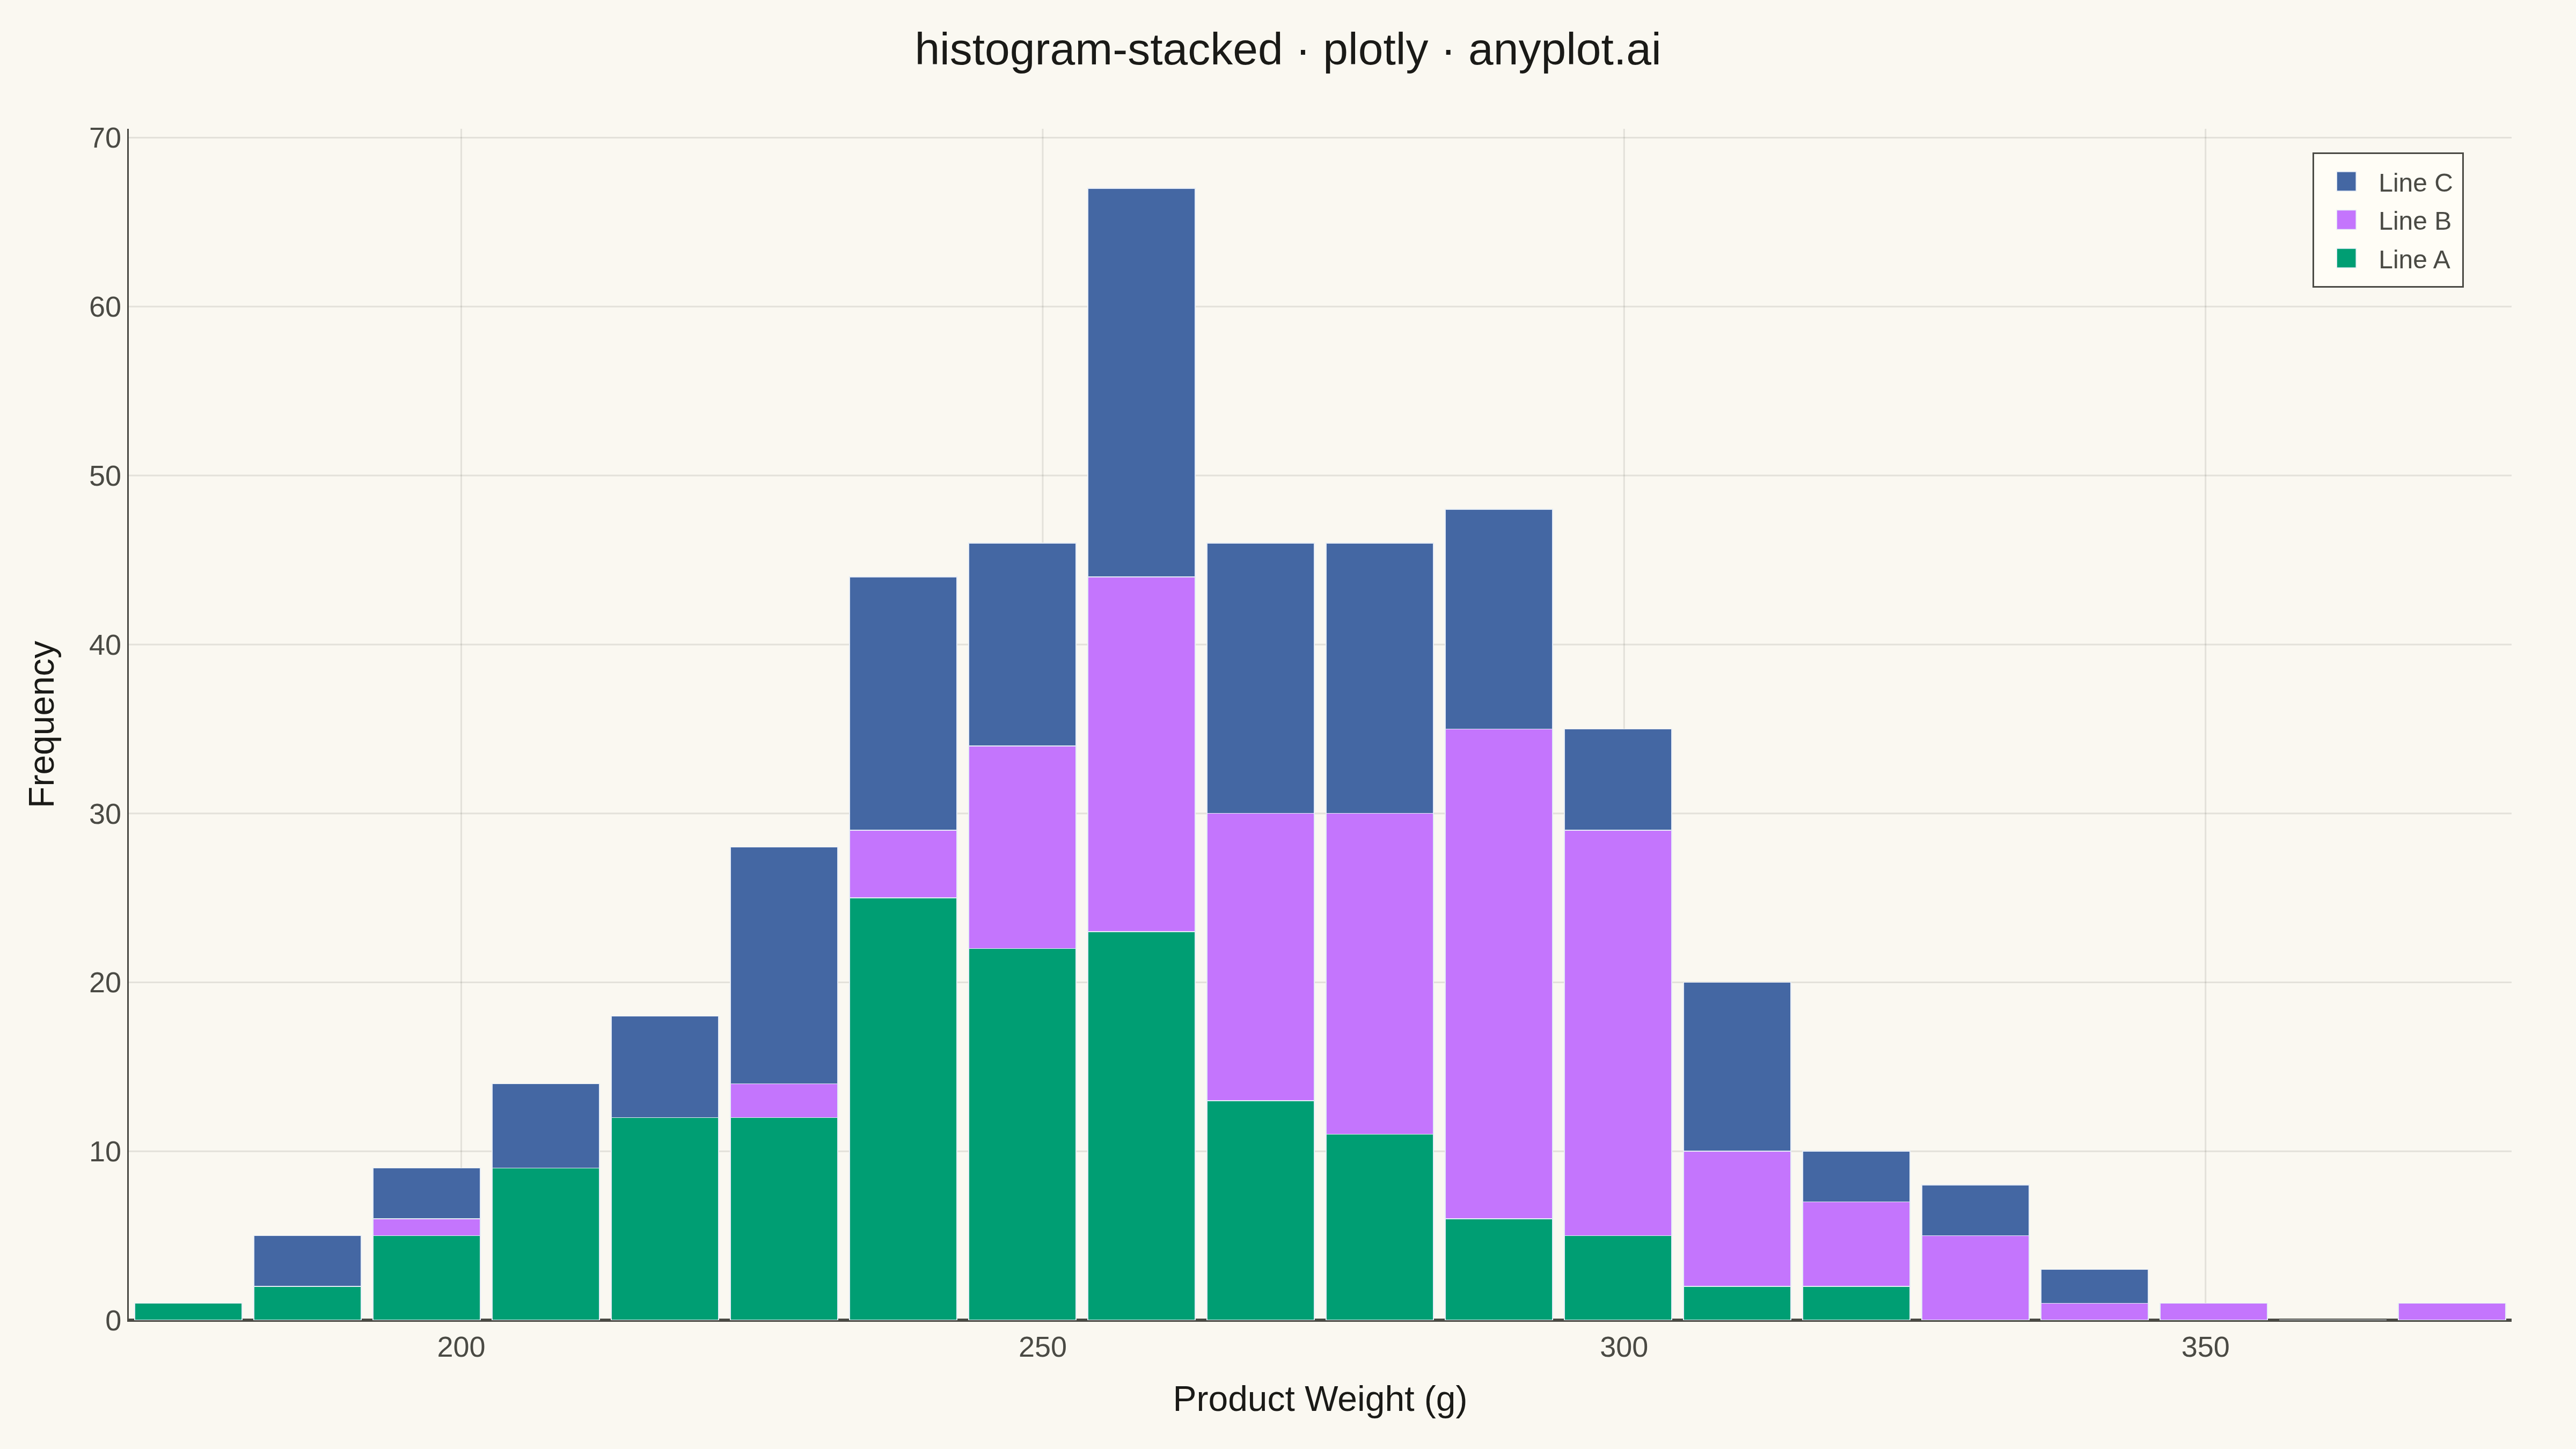
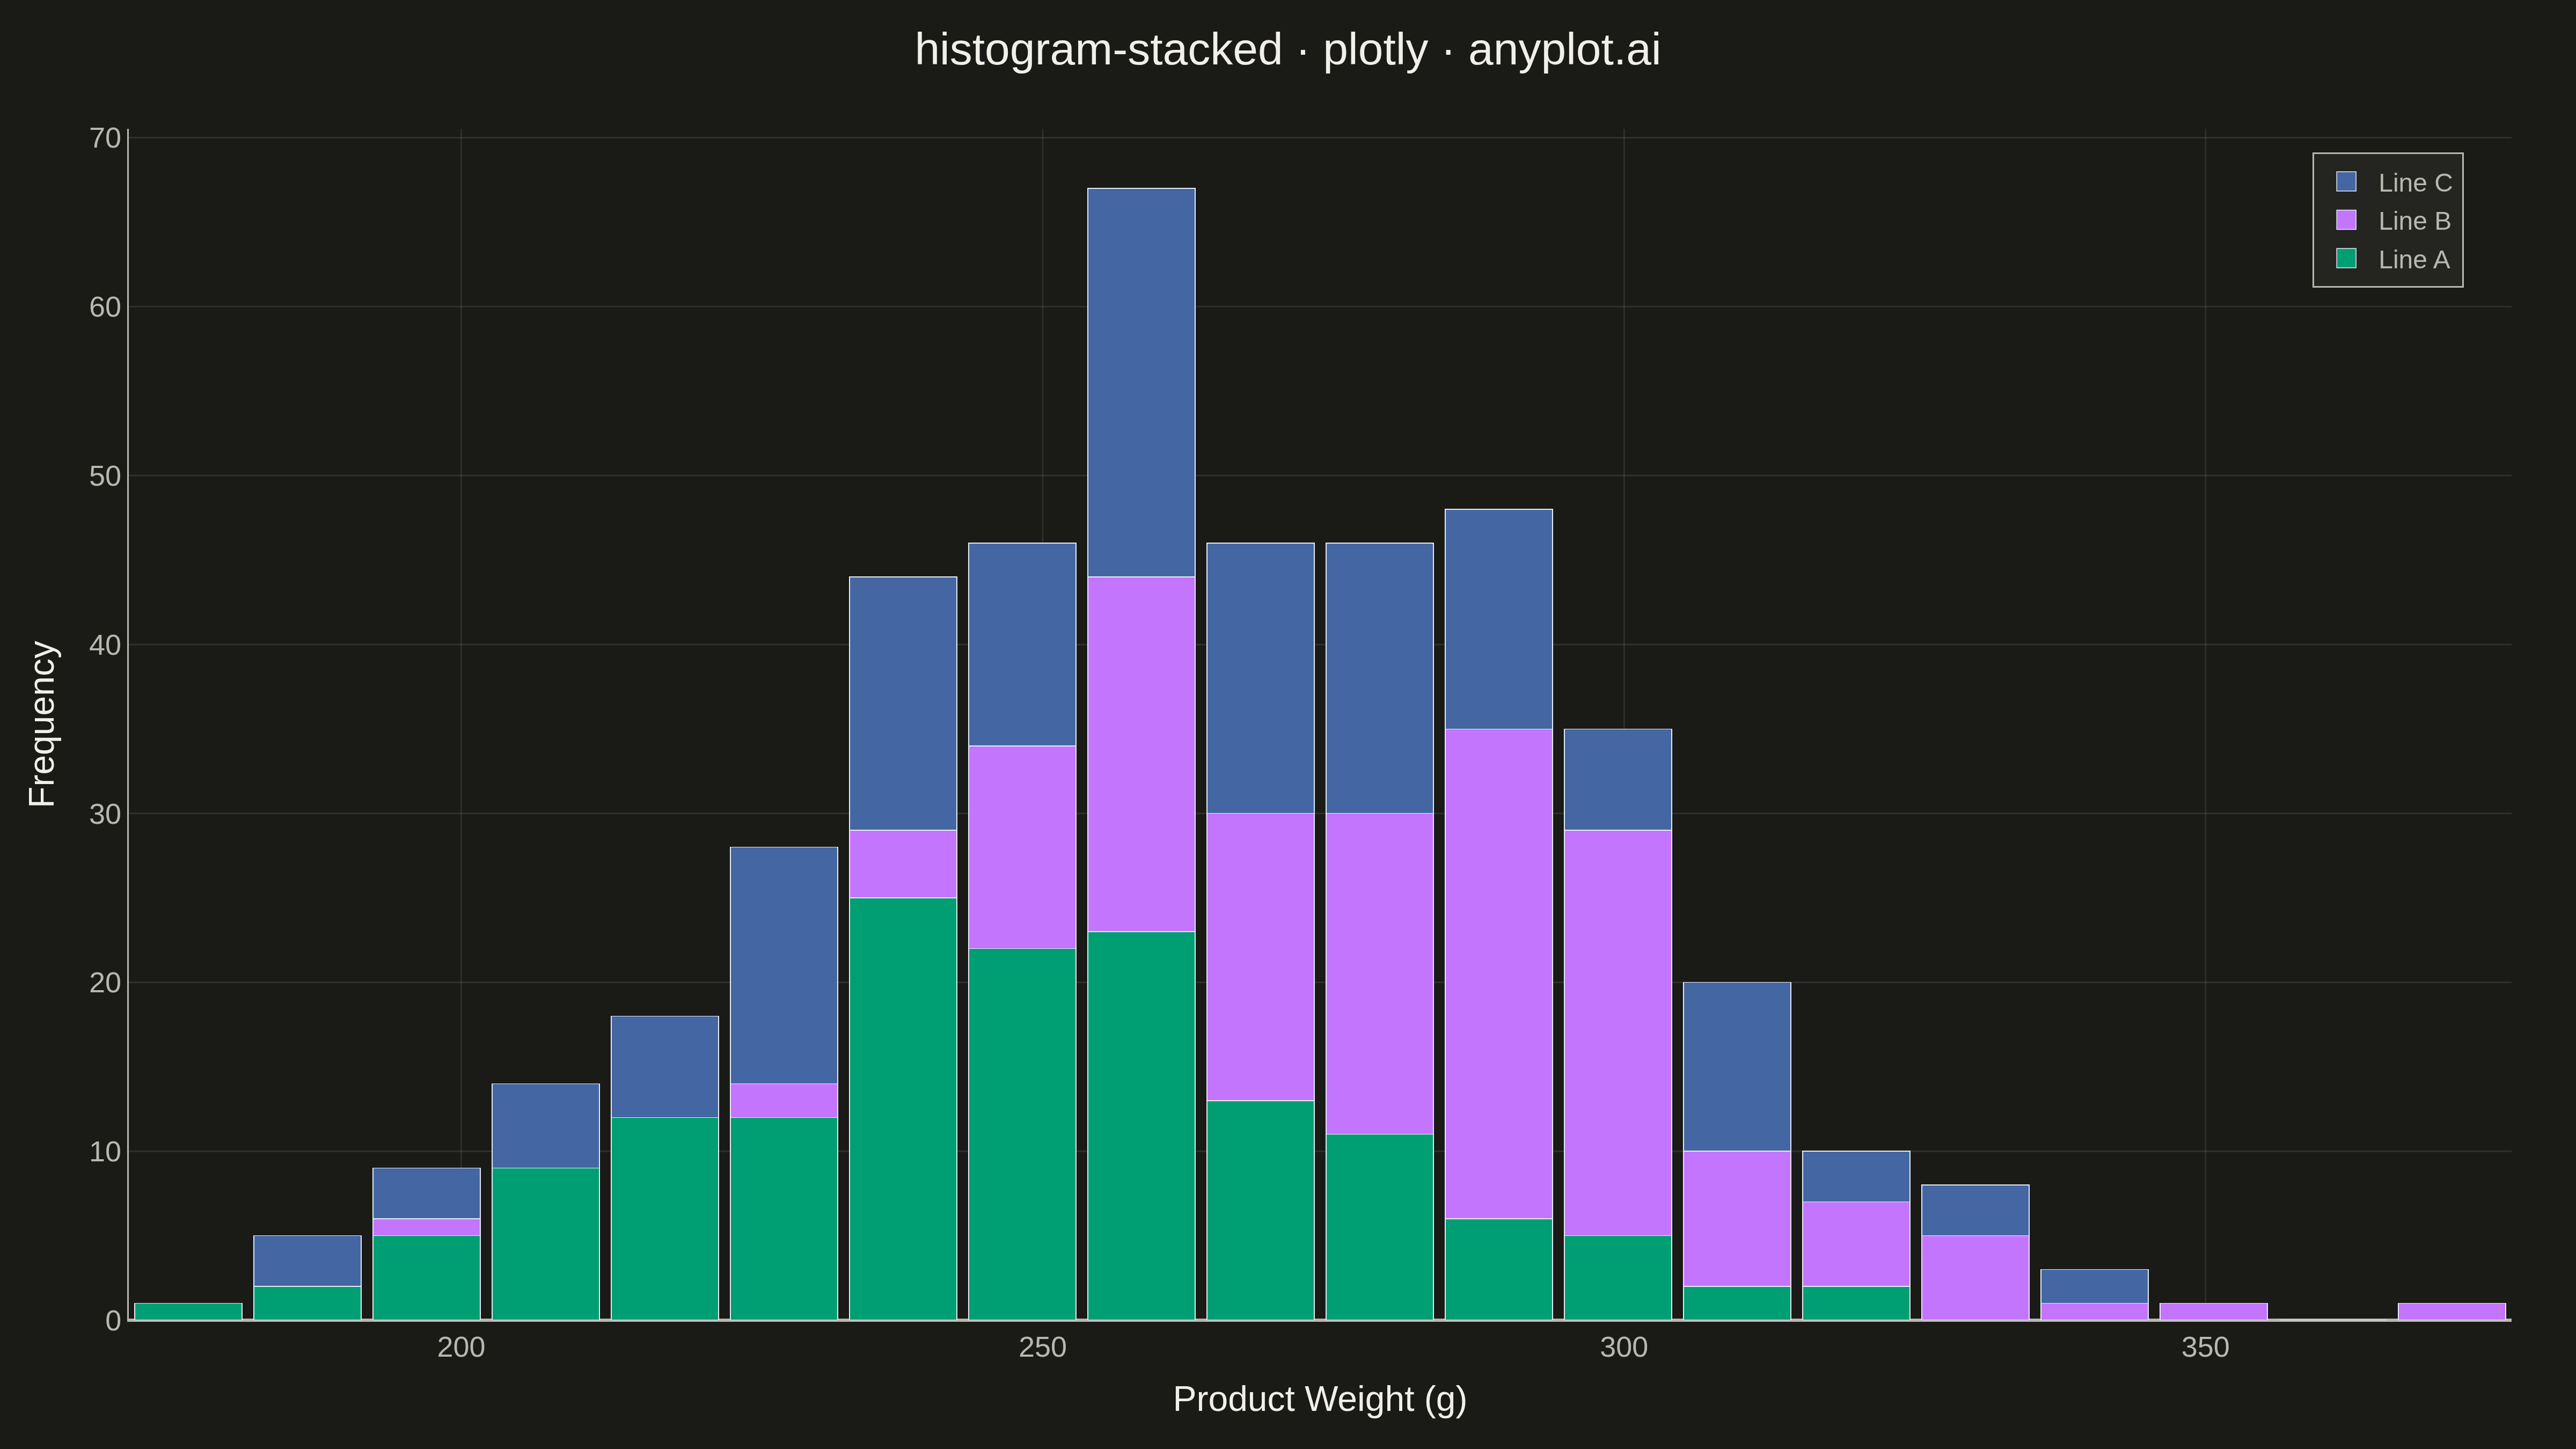
A histogram showing multiple groups stacked on top of each other within each bin. The total bar height represents the combined frequency, while colored segments show individual group contributions.
""" anyplot.ai
histogram-stacked: Stacked Histogram
Library: plotly 6.7.0 | Python 3.13.13
Quality: 91/100 | Updated: 2026-05-12
"""

import os
import sys

import numpy as np


try:
    import plotly.graph_objects as go
except ModuleNotFoundError:
    # Remove current directory from sys.path to avoid importing this script as 'plotly'
    sys.path = [p for p in sys.path if p != "" and os.path.abspath(p) != os.path.dirname(os.path.abspath(__file__))]
    import plotly.graph_objects as go


# Theme tokens
THEME = os.getenv("ANYPLOT_THEME", "light")
PAGE_BG = "#FAF8F1" if THEME == "light" else "#1A1A17"
ELEVATED_BG = "#FFFDF6" if THEME == "light" else "#242420"
INK = "#1A1A17" if THEME == "light" else "#F0EFE8"
INK_SOFT = "#4A4A44" if THEME == "light" else "#B8B7B0"
GRID = "rgba(26,26,23,0.10)" if THEME == "light" else "rgba(240,239,232,0.10)"

# Okabe-Ito palette (first series is ALWAYS #009E73)
IMPRINT = ["#009E73", "#C475FD", "#4467A3"]

# Data - Product weights from three production lines
np.random.seed(42)
n_per_group = 150

# Three production lines with different weight distributions
line_a = np.random.normal(loc=250, scale=30, size=n_per_group)
line_b = np.random.normal(loc=280, scale=25, size=n_per_group)
line_c = np.random.normal(loc=260, scale=35, size=n_per_group)

# Define consistent bin edges for all groups
all_values = np.concatenate([line_a, line_b, line_c])
bin_edges = np.histogram_bin_edges(all_values, bins=20)

# Calculate histograms with same bins for proper stacking
hist_a, _ = np.histogram(line_a, bins=bin_edges)
hist_b, _ = np.histogram(line_b, bins=bin_edges)
hist_c, _ = np.histogram(line_c, bins=bin_edges)

# Bin centers for x-axis
bin_centers = (bin_edges[:-1] + bin_edges[1:]) / 2
bin_width = bin_edges[1] - bin_edges[0]

# Create figure with stacked bars
fig = go.Figure()

fig.add_trace(
    go.Bar(
        x=bin_centers,
        y=hist_a,
        name="Line A",
        marker_color=IMPRINT[0],
        width=bin_width * 0.9,
        hovertemplate="<b>Line A</b><br>Weight: %{x:.1f}g<br>Count: %{y}<extra></extra>",
    )
)

fig.add_trace(
    go.Bar(
        x=bin_centers,
        y=hist_b,
        name="Line B",
        marker_color=IMPRINT[1],
        width=bin_width * 0.9,
        hovertemplate="<b>Line B</b><br>Weight: %{x:.1f}g<br>Count: %{y}<extra></extra>",
    )
)

fig.add_trace(
    go.Bar(
        x=bin_centers,
        y=hist_c,
        name="Line C",
        marker_color=IMPRINT[2],
        width=bin_width * 0.9,
        hovertemplate="<b>Line C</b><br>Weight: %{x:.1f}g<br>Count: %{y}<extra></extra>",
    )
)

# Layout with theme-adaptive styling
fig.update_layout(
    title=dict(text="histogram-stacked · plotly · anyplot.ai", font=dict(size=28, color=INK), x=0.5, xanchor="center"),
    xaxis=dict(
        title=dict(text="Product Weight (g)", font=dict(size=22, color=INK)),
        tickfont=dict(size=18, color=INK_SOFT),
        gridcolor=GRID,
        linecolor=INK_SOFT,
        zerolinecolor=INK_SOFT,
    ),
    yaxis=dict(
        title=dict(text="Frequency", font=dict(size=22, color=INK)),
        tickfont=dict(size=18, color=INK_SOFT),
        gridcolor=GRID,
        linecolor=INK_SOFT,
        zerolinecolor=INK_SOFT,
    ),
    barmode="stack",
    paper_bgcolor=PAGE_BG,
    plot_bgcolor=PAGE_BG,
    legend=dict(
        font=dict(size=16, color=INK_SOFT),
        x=0.98,
        y=0.98,
        xanchor="right",
        yanchor="top",
        bgcolor=ELEVATED_BG,
        bordercolor=INK_SOFT,
        borderwidth=1,
    ),
    margin=dict(l=80, r=40, t=80, b=80),
)

# Save outputs
fig.write_image(f"plot-{THEME}.png", width=1600, height=900, scale=3)
fig.write_html(f"plot-{THEME}.html", include_plotlyjs="cdn")
Runnable source as JSON, for any HTTP client: https://api.anyplot.ai/specs/histogram-stacked/plotly/code. Any spec id and library id listed in llms-full.txt fit the same URL shape; every URL below is complete and callable.
{
  "spec_id": "histogram-stacked",
  "language": "python",
  "library": "plotly",
  "page": "https://anyplot.ai/histogram-stacked/python/plotly",
  "hub": "https://anyplot.ai/histogram-stacked",
  "code_json": "https://api.anyplot.ai/specs/histogram-stacked/plotly/code",
  "spec_json": "https://api.anyplot.ai/specs/histogram-stacked",
  "render_light_png": "https://storage.googleapis.com/anyplot-images/plots/histogram-stacked/python/plotly/plot-light.png",
  "render_dark_png": "https://storage.googleapis.com/anyplot-images/plots/histogram-stacked/python/plotly/plot-dark.png",
  "interactive_light_html": "https://storage.googleapis.com/anyplot-images/plots/histogram-stacked/python/plotly/plot-light.html",
  "interactive_dark_html": "https://storage.googleapis.com/anyplot-images/plots/histogram-stacked/python/plotly/plot-dark.html",
  "quality_score": 91.0,
  "license": "MIT",
  "guide": "https://anyplot.ai/llms.txt"
}
Part of Stacked Histogram on anyplot.ai.