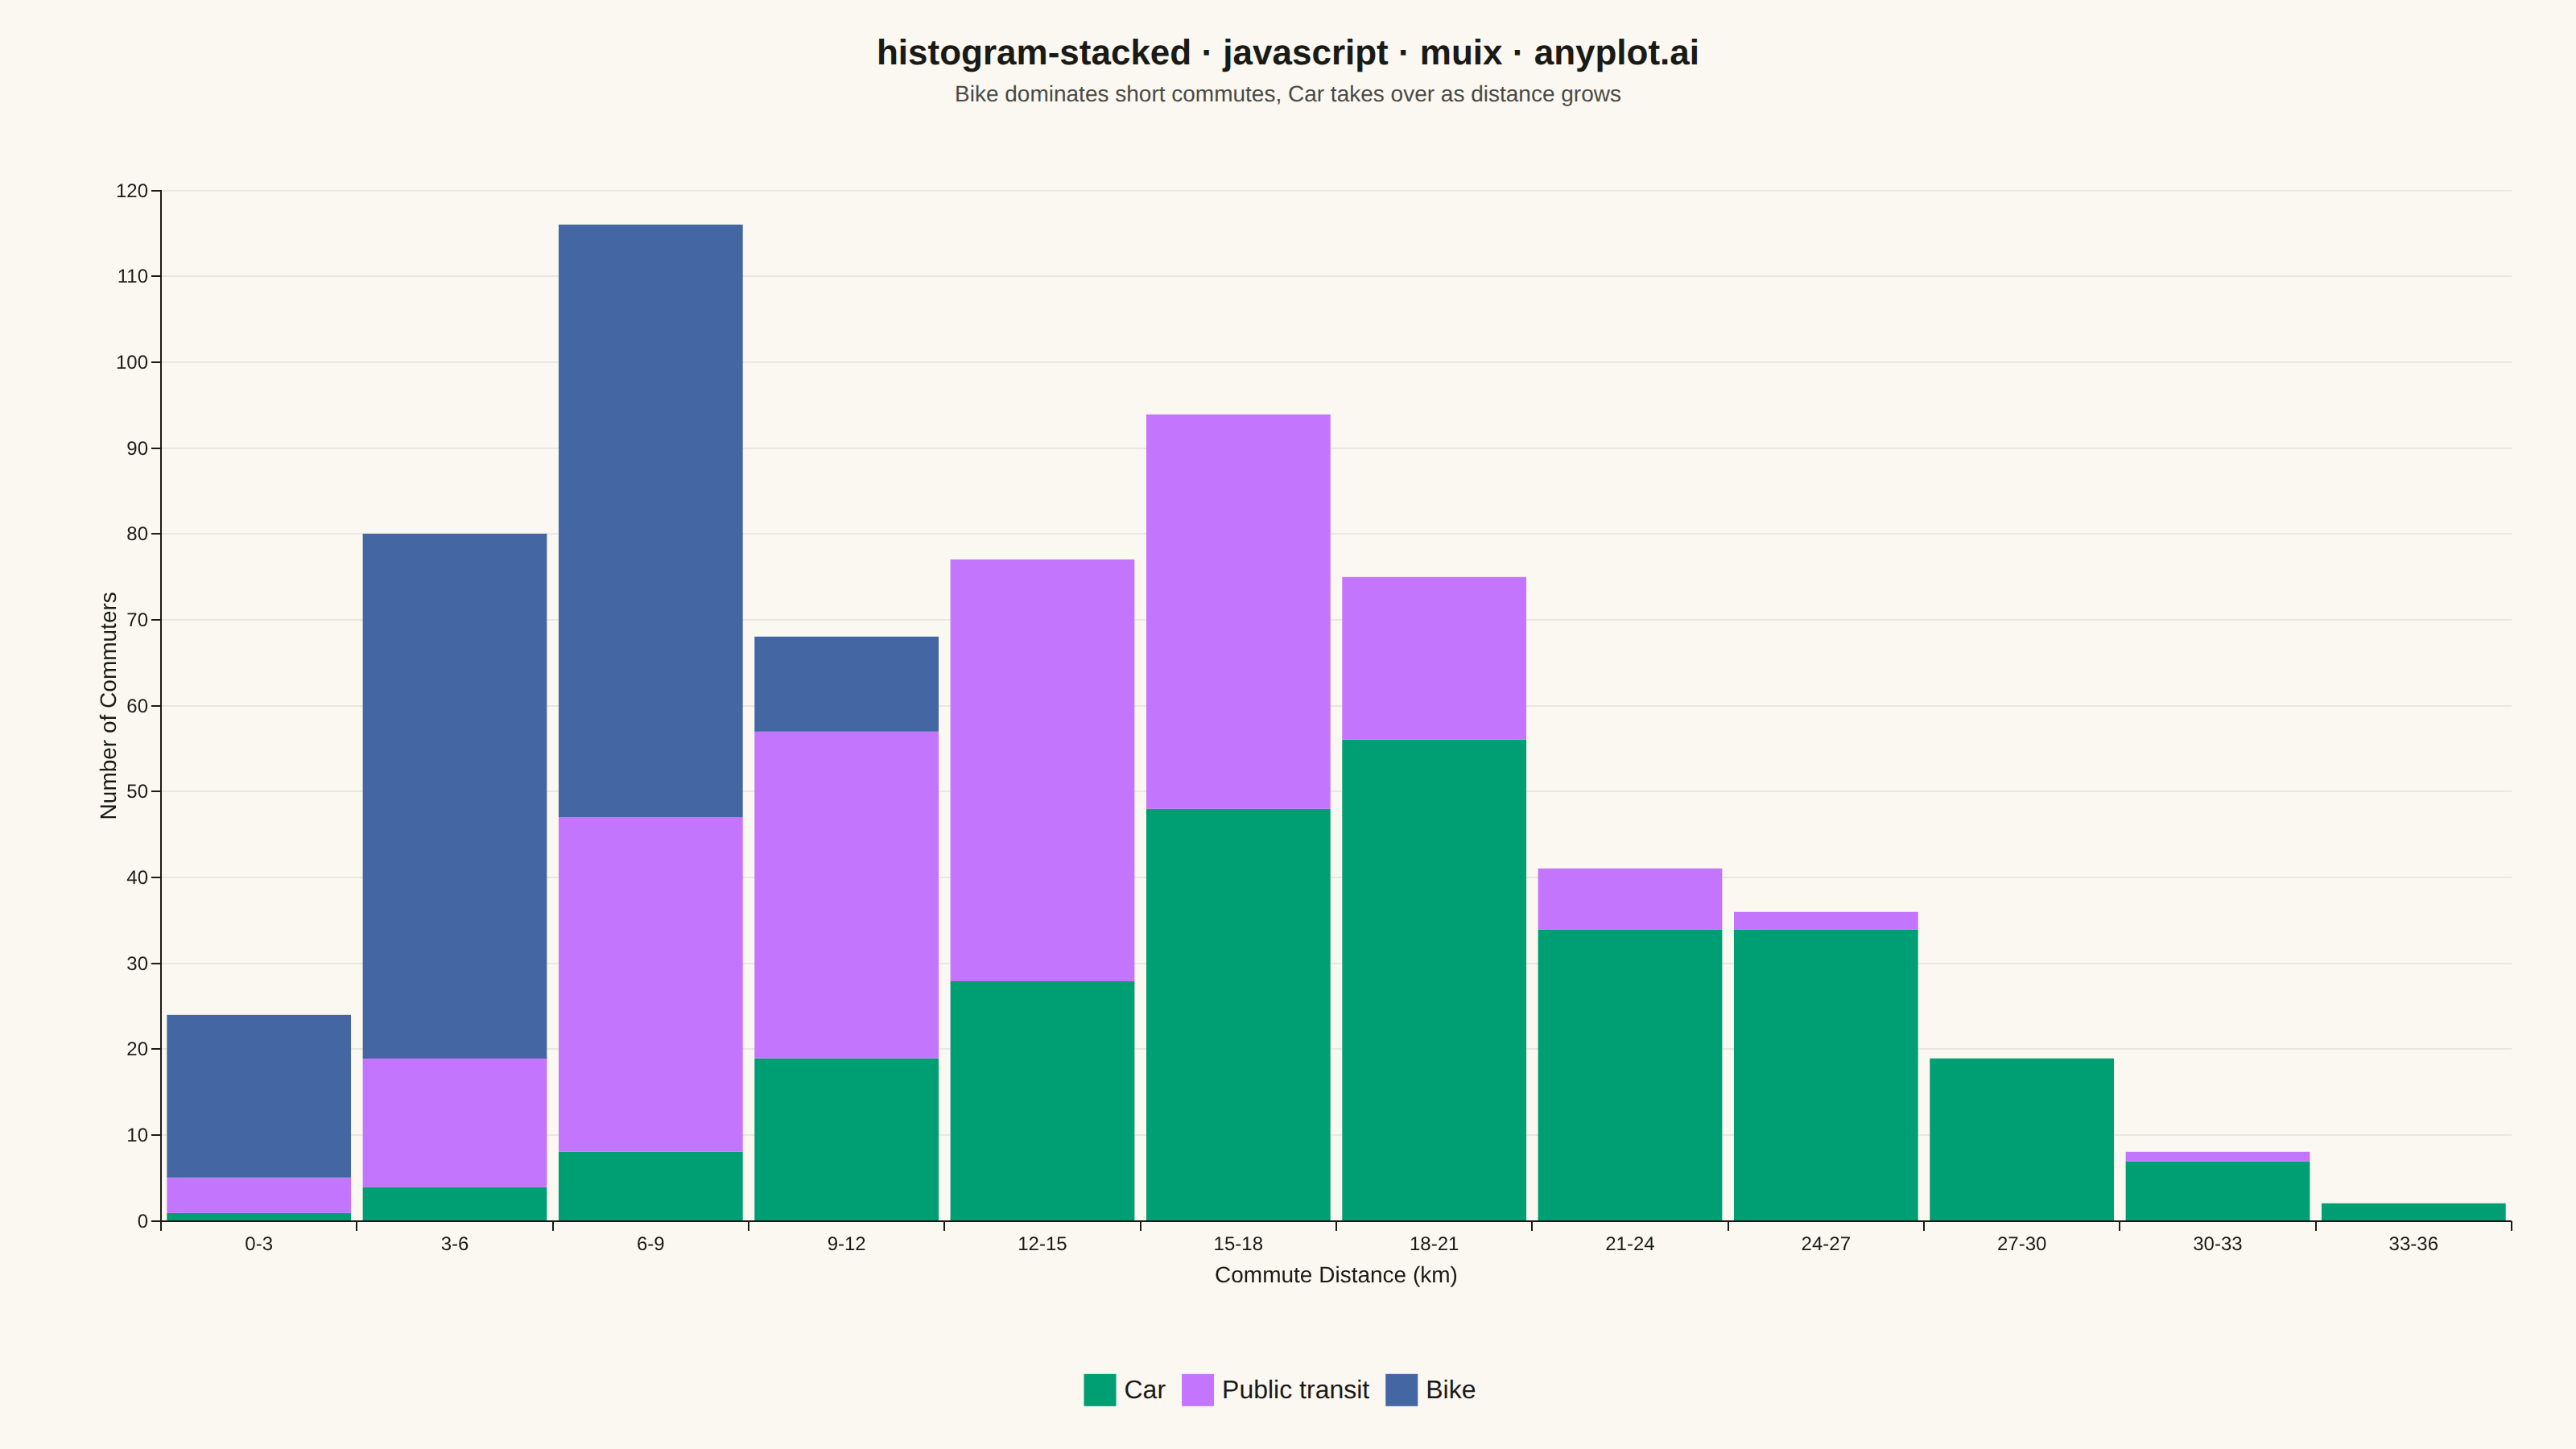
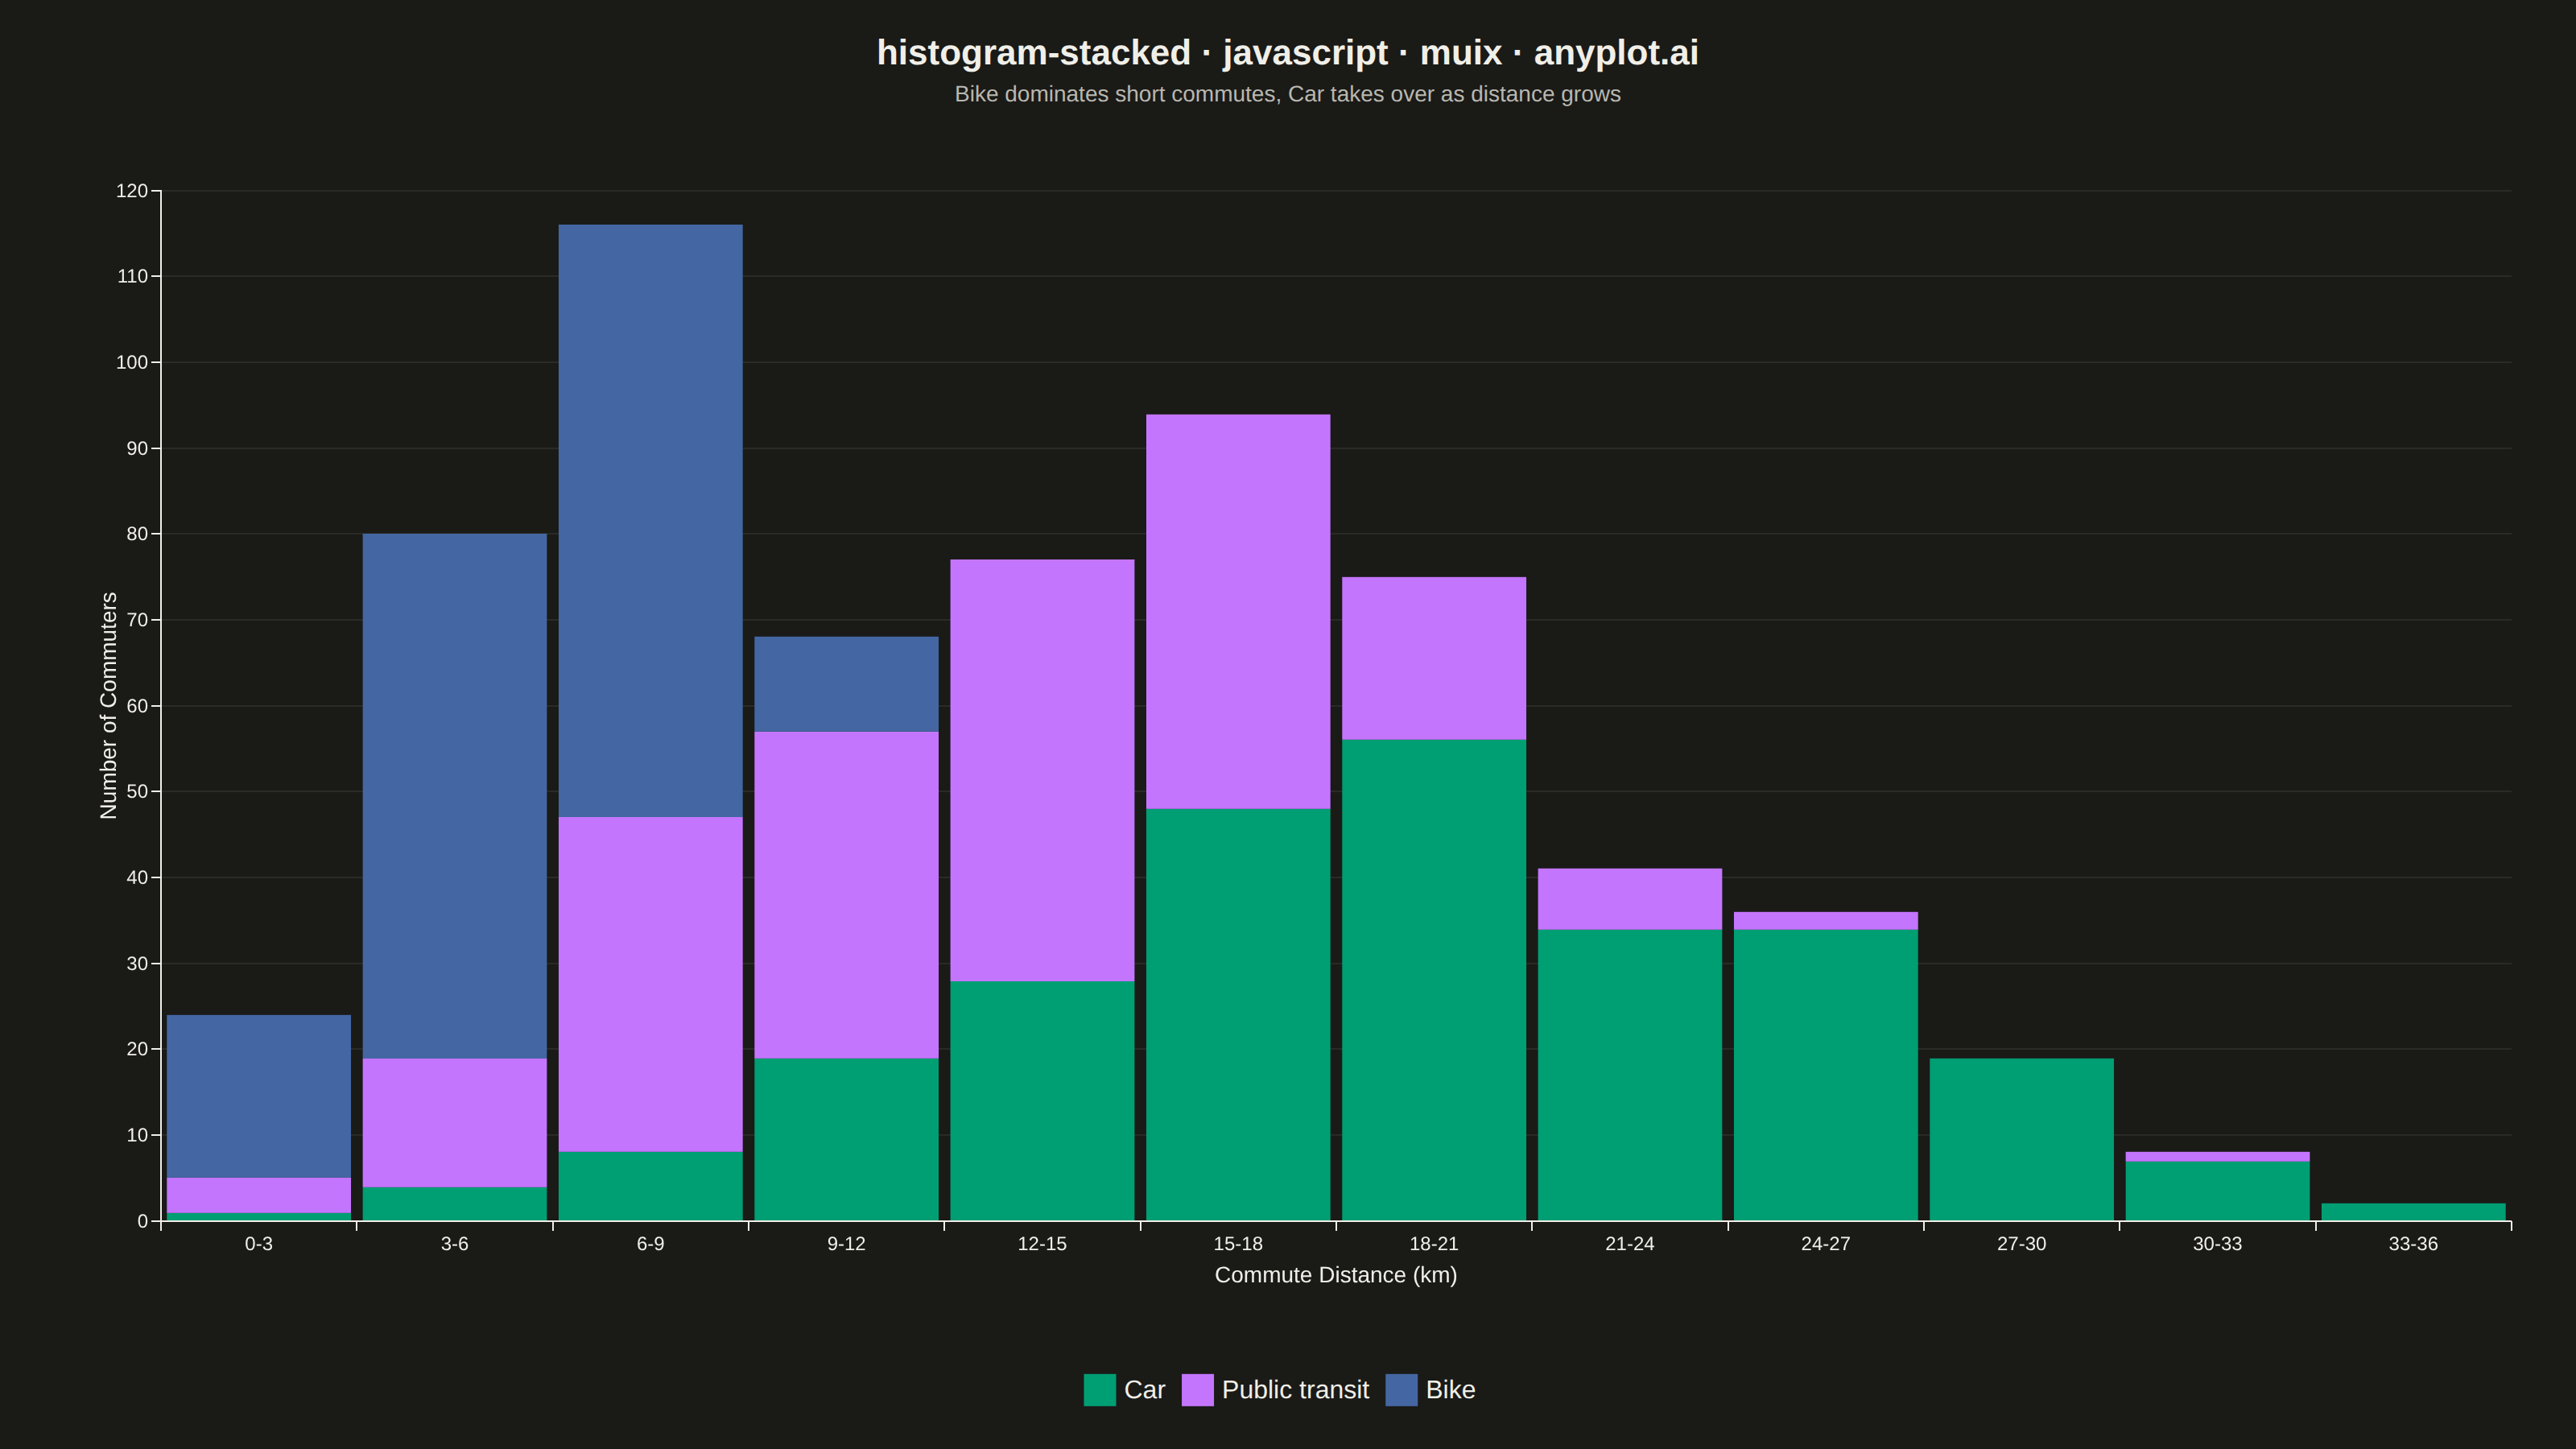
The same plot in 14 other libraries — JavaScript: Chart.js, D3.js, Apache ECharts, Highcharts; Python: Altair, Bokeh, lets-plot, Matplotlib, Plotly, plotnine, Pygal, Seaborn; R: ggplot2; Julia: Makie.jl. Compare all 15 side by side: Stacked Histogram in Python, R, Julia and JavaScript.
A histogram showing multiple groups stacked on top of each other within each bin. The total bar height represents the combined frequency, while colored segments show individual group contributions.
// anyplot.ai
// histogram-stacked: Stacked Histogram
// Library: muix 7.29.1 | JavaScript 22.23.2
// Quality: 92/100 | Created: 2026-09-05
import { BarChart } from "@mui/x-charts/BarChart";
import Box from "@mui/material/Box";
import Typography from "@mui/material/Typography";

const t = window.ANYPLOT_TOKENS;

// --- Data (in-memory, deterministic fixed-seed LCG) -------------------------
// Commute distance to work (km), binned, broken down by primary transport mode.
function makeLcg(seed) {
  let state = seed;
  return () => {
    state = (state * 1664525 + 1013904223) % 4294967296;
    return state / 4294967296;
  };
}

function sampleNormal(rand, mean, stdDev) {
  const u1 = Math.max(rand(), 1e-9);
  const u2 = rand();
  const z = Math.sqrt(-2 * Math.log(u1)) * Math.cos(2 * Math.PI * u2);
  return mean + z * stdDev;
}

const rand = makeLcg(42);

const GROUPS = [
  { label: "Car", mean: 19, stdDev: 6.5, count: 260, color: t.palette[0] },
  { label: "Public transit", mean: 13, stdDev: 5, count: 220, color: t.palette[1] },
  { label: "Bike", mean: 6, stdDev: 2.5, count: 160, color: t.palette[2] },
];

const BIN_WIDTH = 3;
const BIN_COUNT = 12;
const MAX_DISTANCE = BIN_WIDTH * BIN_COUNT;
const binLabels = Array.from(
  { length: BIN_COUNT },
  (_, i) => `${i * BIN_WIDTH}-${(i + 1) * BIN_WIDTH}`,
);

const groupCounts = GROUPS.map((group) => {
  const counts = new Array(BIN_COUNT).fill(0);
  for (let i = 0; i < group.count; i += 1) {
    const distance = Math.min(
      Math.max(sampleNormal(rand, group.mean, group.stdDev), 0),
      MAX_DISTANCE - 0.01,
    );
    counts[Math.floor(distance / BIN_WIDTH)] += 1;
  }
  return counts;
});

const dataset = binLabels.map((bin, i) => {
  const row = { bin };
  GROUPS.forEach((group, g) => {
    row[group.label] = groupCounts[g][i];
  });
  return row;
});

// Dominant mode at the near and far ends of the commute-distance range, used
// to surface the underlying mode-shift story in the subtitle.
const dominantGroupAt = (binIndex) => {
  let bestGroup = GROUPS[0].label;
  let bestCount = -1;
  GROUPS.forEach((group, g) => {
    if (groupCounts[g][binIndex] > bestCount) {
      bestCount = groupCounts[g][binIndex];
      bestGroup = group.label;
    }
  });
  return bestGroup;
};
const nearMode = dominantGroupAt(0);
const farMode = dominantGroupAt(BIN_COUNT - 1);

const TITLE_HEIGHT = 60;
const SUBTITLE_HEIGHT = 30;

// --- Chart (default-exported component — the harness mounts it) ------------
export default function Chart() {
  const { width, height } = window.ANYPLOT_SIZE;

  return (
    <Box sx={{ width, height, display: "flex", flexDirection: "column", paddingTop: "20px" }}>
      <Typography
        sx={{ color: t.ink, fontSize: 22, fontWeight: 600, textAlign: "center", lineHeight: 1.2 }}
      >
        histogram-stacked · javascript · muix · anyplot.ai
      </Typography>
      <Typography
        sx={{
          color: t.inkSoft,
          fontSize: 14,
          fontWeight: 400,
          textAlign: "center",
          lineHeight: 1.2,
          marginTop: "4px",
        }}
      >
        {`${nearMode} dominates short commutes, ${farMode} takes over as distance grows`}
      </Typography>
      <BarChart
        width={width}
        height={height - TITLE_HEIGHT - SUBTITLE_HEIGHT}
        dataset={dataset}
        colors={GROUPS.map((group) => group.color)}
        skipAnimation
        xAxis={[
          {
            scaleType: "band",
            dataKey: "bin",
            label: "Commute Distance (km)",
            categoryGapRatio: 0.06,
          },
        ]}
        yAxis={[{ label: "Number of Commuters" }]}
        series={GROUPS.map((group) => ({
          dataKey: group.label,
          label: group.label,
          stack: "total",
          highlightScope: { highlight: "series", fade: "global" },
        }))}
        grid={{ horizontal: true }}
        margin={{ top: 40, right: 40, bottom: 130, left: 100 }}
        slotProps={{
          legend: { position: { vertical: "bottom", horizontal: "middle" } },
        }}
        sx={{
          "& .MuiChartsAxis-tickLabel": { fontSize: "14px" },
          "& .MuiChartsAxis-label": { fontSize: "16px" },
          "& .MuiChartsLegend-label": { fontSize: "14px" },
          "& .MuiChartsGrid-line": { opacity: 0.5 },
        }}
      />
    </Box>
  );
}
Runnable source as JSON, for any HTTP client: https://api.anyplot.ai/specs/histogram-stacked/muix/code. Any spec id and library id listed in llms-full.txt fit the same URL shape; every URL below is complete and callable.
{
  "spec_id": "histogram-stacked",
  "language": "javascript",
  "library": "muix",
  "page": "https://anyplot.ai/histogram-stacked/javascript/muix",
  "hub": "https://anyplot.ai/histogram-stacked",
  "code_json": "https://api.anyplot.ai/specs/histogram-stacked/muix/code",
  "spec_json": "https://api.anyplot.ai/specs/histogram-stacked",
  "render_light_png": "https://storage.googleapis.com/anyplot-images/plots/histogram-stacked/javascript/muix/plot-light.png",
  "render_dark_png": "https://storage.googleapis.com/anyplot-images/plots/histogram-stacked/javascript/muix/plot-dark.png",
  "interactive_light_html": "https://storage.googleapis.com/anyplot-images/plots/histogram-stacked/javascript/muix/plot-light.html",
  "interactive_dark_html": "https://storage.googleapis.com/anyplot-images/plots/histogram-stacked/javascript/muix/plot-dark.html",
  "quality_score": 92.0,
  "license": "MIT",
  "guide": "https://anyplot.ai/llms.txt"
}
Part of Stacked Histogram on anyplot.ai.