The same plot in 14 other libraries — JavaScript: Chart.js, D3.js, Apache ECharts, MUI X Charts; Python: Altair, Bokeh, lets-plot, Matplotlib, Plotly, plotnine, Pygal, Seaborn; R: ggplot2; Julia: Makie.jl. Compare all 15 side by side: Stacked Histogram in Python, R, Julia and JavaScript.
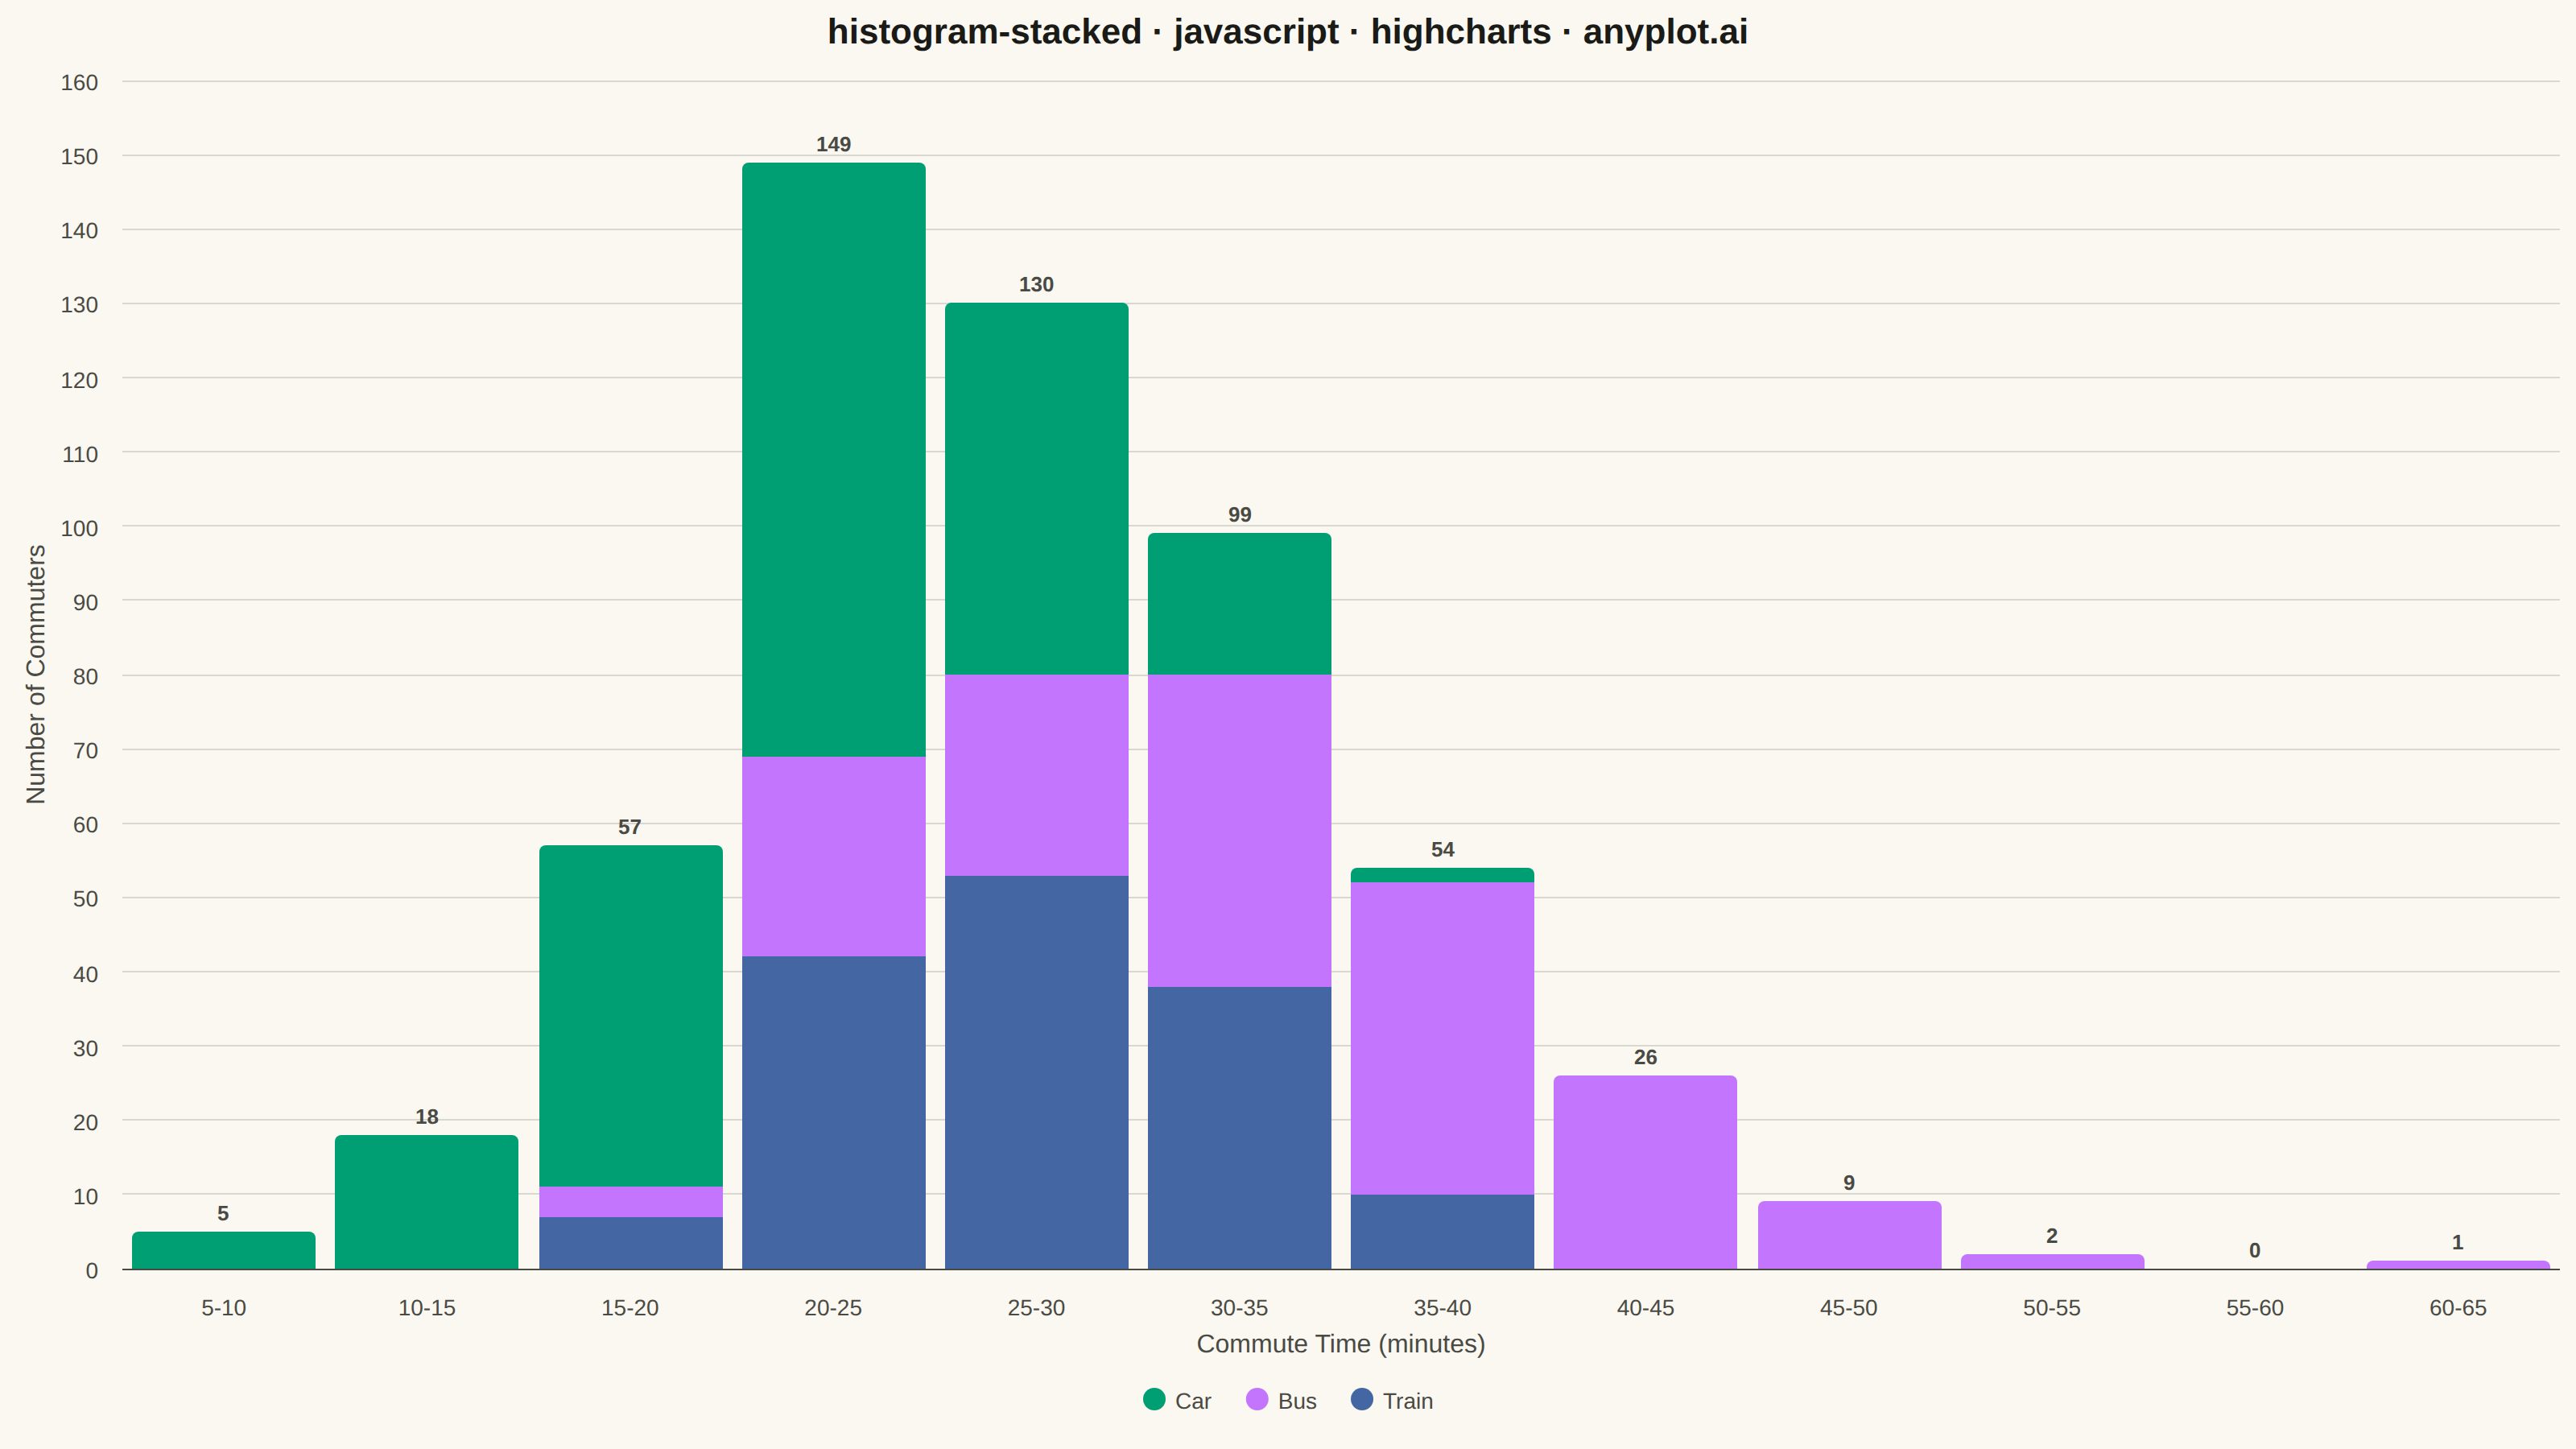
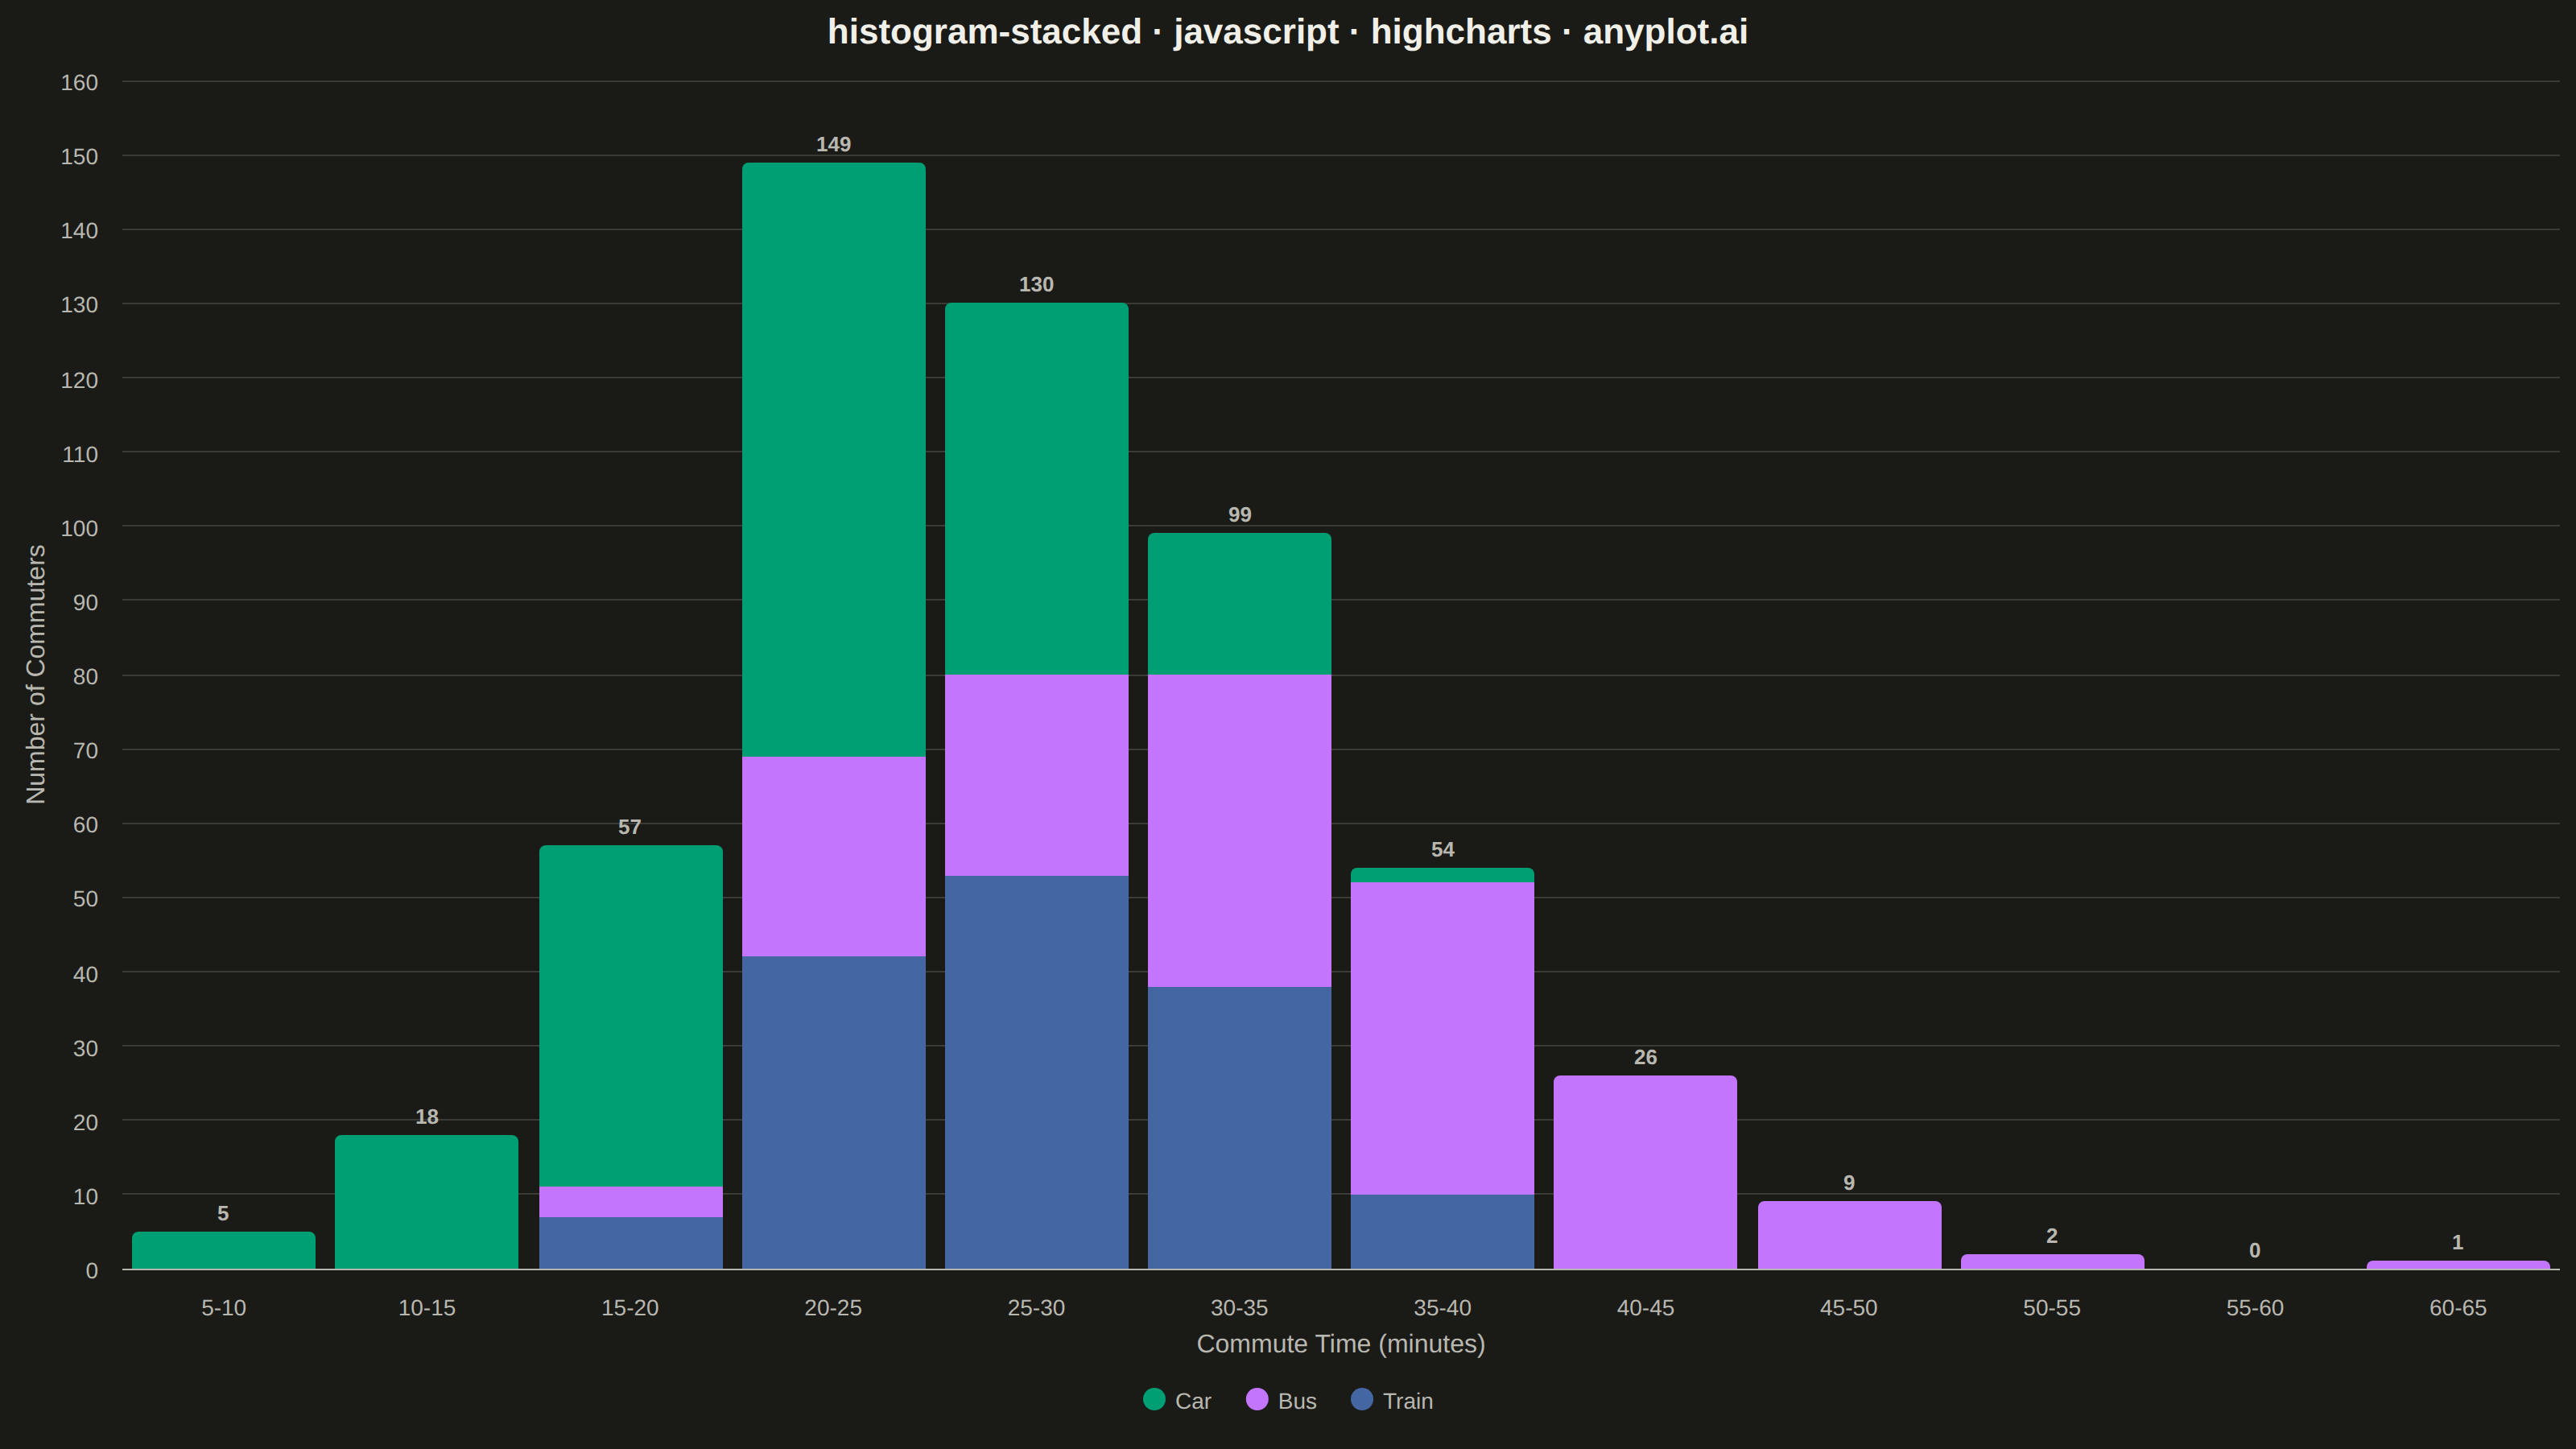
A histogram showing multiple groups stacked on top of each other within each bin. The total bar height represents the combined frequency, while colored segments show individual group contributions.
// anyplot.ai
// histogram-stacked: Stacked Histogram
// Library: highcharts 12.6.0 | JavaScript 22.23.2
// Quality: 90/100 | Created: 2026-09-05

//# anyplot-orientation: landscape
const t = window.ANYPLOT_TOKENS;

// --- Data (in-memory, deterministic) ---------------------------------------
// Fixed-seed LCG — the browser has no seeded Math.random
let seed = 42;
function lcgRandom() {
  seed = (seed * 1664525 + 1013904223) % 4294967296;
  return seed / 4294967296;
}
function randNormal(mean, stdDev) {
  const u1 = lcgRandom() || 1e-9;
  const u2 = lcgRandom();
  const z = Math.sqrt(-2 * Math.log(u1)) * Math.cos(2 * Math.PI * u2);
  return mean + z * stdDev;
}

const modes = ["Car", "Bus", "Train"];
const modeParams = {
  Car: { mean: 22, stdDev: 6, count: 220 },
  Bus: { mean: 34, stdDev: 8, count: 180 },
  Train: { mean: 28, stdDev: 5, count: 150 },
};

const commuteTimes = [];
modes.forEach((mode) => {
  const { mean, stdDev, count } = modeParams[mode];
  for (let i = 0; i < count; i++) {
    commuteTimes.push({ mode, minutes: Math.max(2, randNormal(mean, stdDev)) });
  }
});

// Shared bin boundaries applied to every group
const binWidth = 5;
const minValue = Math.floor(Math.min(...commuteTimes.map((d) => d.minutes)) / binWidth) * binWidth;
const maxValue = Math.ceil(Math.max(...commuteTimes.map((d) => d.minutes)) / binWidth) * binWidth;
const binCount = Math.round((maxValue - minValue) / binWidth);
const binLabels = Array.from(
  { length: binCount },
  (_, i) => `${minValue + i * binWidth}-${minValue + (i + 1) * binWidth}`,
);

const seriesData = {};
modes.forEach((mode) => {
  seriesData[mode] = new Array(binCount).fill(0);
});
commuteTimes.forEach(({ mode, minutes }) => {
  const binIndex = Math.min(Math.max(Math.floor((minutes - minValue) / binWidth), 0), binCount - 1);
  seriesData[mode][binIndex] += 1;
});

// --- Chart -------------------------------------------------------------
Highcharts.chart("container", {
  chart: {
    type: "column",
    backgroundColor: "transparent",
    animation: false,
    style: { fontFamily: "inherit" },
  },
  credits: { enabled: false },
  colors: t.palette,
  title: {
    text: "histogram-stacked · javascript · highcharts · anyplot.ai",
    style: { color: t.ink, fontSize: "22px", fontWeight: "600" },
  },
  xAxis: {
    categories: binLabels,
    title: { text: "Commute Time (minutes)", style: { color: t.inkSoft, fontSize: "16px" } },
    lineColor: t.inkSoft,
    tickColor: t.inkSoft,
    labels: { style: { color: t.inkSoft, fontSize: "14px" } },
  },
  yAxis: {
    title: { text: "Number of Commuters", style: { color: t.inkSoft, fontSize: "16px" } },
    gridLineColor: t.grid,
    labels: { style: { color: t.inkSoft, fontSize: "14px" } },
    stackLabels: {
      enabled: true,
      style: { color: t.inkSoft, fontSize: "13px", fontWeight: "600", textOutline: "none" },
    },
  },
  legend: {
    itemStyle: { color: t.inkSoft, fontSize: "14px" },
    itemHoverStyle: { color: t.ink },
  },
  plotOptions: {
    series: { animation: false, stacking: "normal" },
    column: {
      borderWidth: 0,
      pointPadding: 0.05,
      groupPadding: 0,
      borderRadius: { radius: 4, scope: "stack" },
    },
  },
  series: modes.map((mode) => ({ name: mode, data: seriesData[mode] })),
});
Runnable source as JSON, for any HTTP client: https://api.anyplot.ai/specs/histogram-stacked/highcharts/code. Any spec id and library id listed in llms-full.txt fit the same URL shape; every URL below is complete and callable.
{
  "spec_id": "histogram-stacked",
  "language": "javascript",
  "library": "highcharts",
  "page": "https://anyplot.ai/histogram-stacked/javascript/highcharts",
  "hub": "https://anyplot.ai/histogram-stacked",
  "code_json": "https://api.anyplot.ai/specs/histogram-stacked/highcharts/code",
  "spec_json": "https://api.anyplot.ai/specs/histogram-stacked",
  "render_light_png": "https://storage.googleapis.com/anyplot-images/plots/histogram-stacked/javascript/highcharts/plot-light.png",
  "render_dark_png": "https://storage.googleapis.com/anyplot-images/plots/histogram-stacked/javascript/highcharts/plot-dark.png",
  "interactive_light_html": "https://storage.googleapis.com/anyplot-images/plots/histogram-stacked/javascript/highcharts/plot-light.html",
  "interactive_dark_html": "https://storage.googleapis.com/anyplot-images/plots/histogram-stacked/javascript/highcharts/plot-dark.html",
  "quality_score": 90.0,
  "license": "MIT",
  "guide": "https://anyplot.ai/llms.txt"
}
Part of Stacked Histogram on anyplot.ai.