The same plot in 14 other libraries — JavaScript: Chart.js, Apache ECharts, Highcharts, MUI X Charts; Python: Altair, Bokeh, lets-plot, Matplotlib, Plotly, plotnine, Pygal, Seaborn; R: ggplot2; Julia: Makie.jl. Compare all 15 side by side: Stacked Histogram in Python, R, Julia and JavaScript.
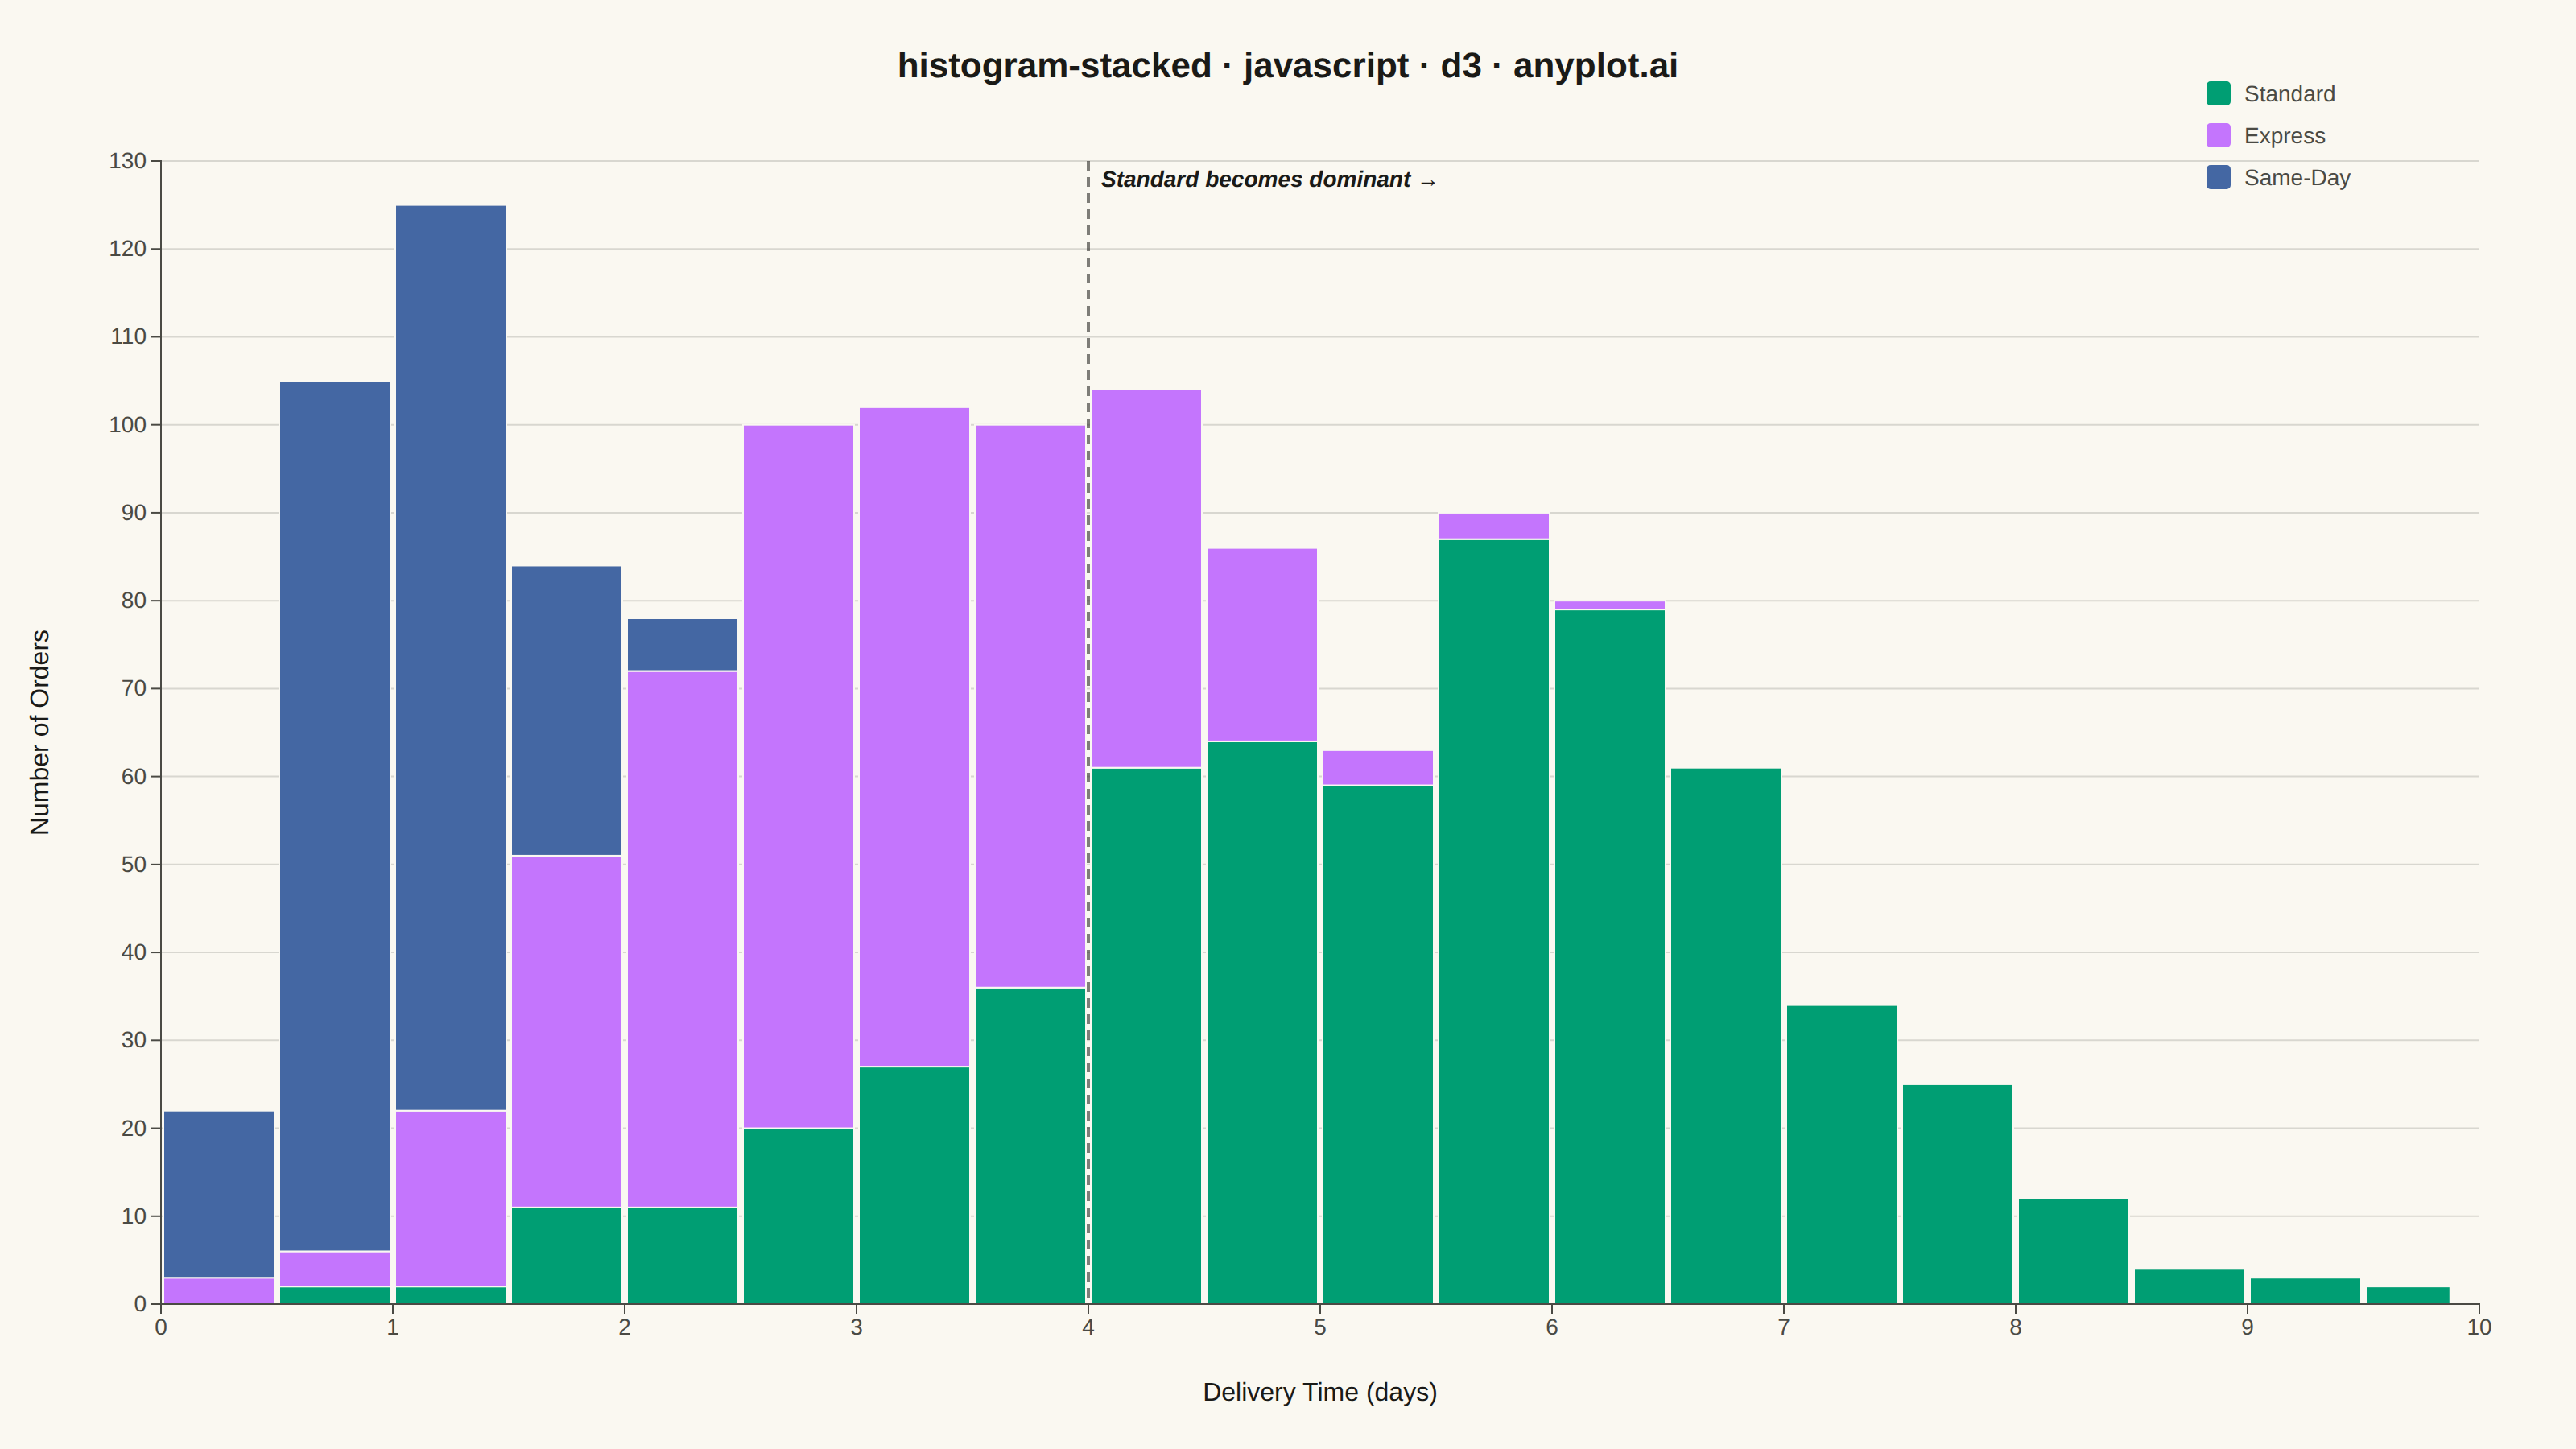
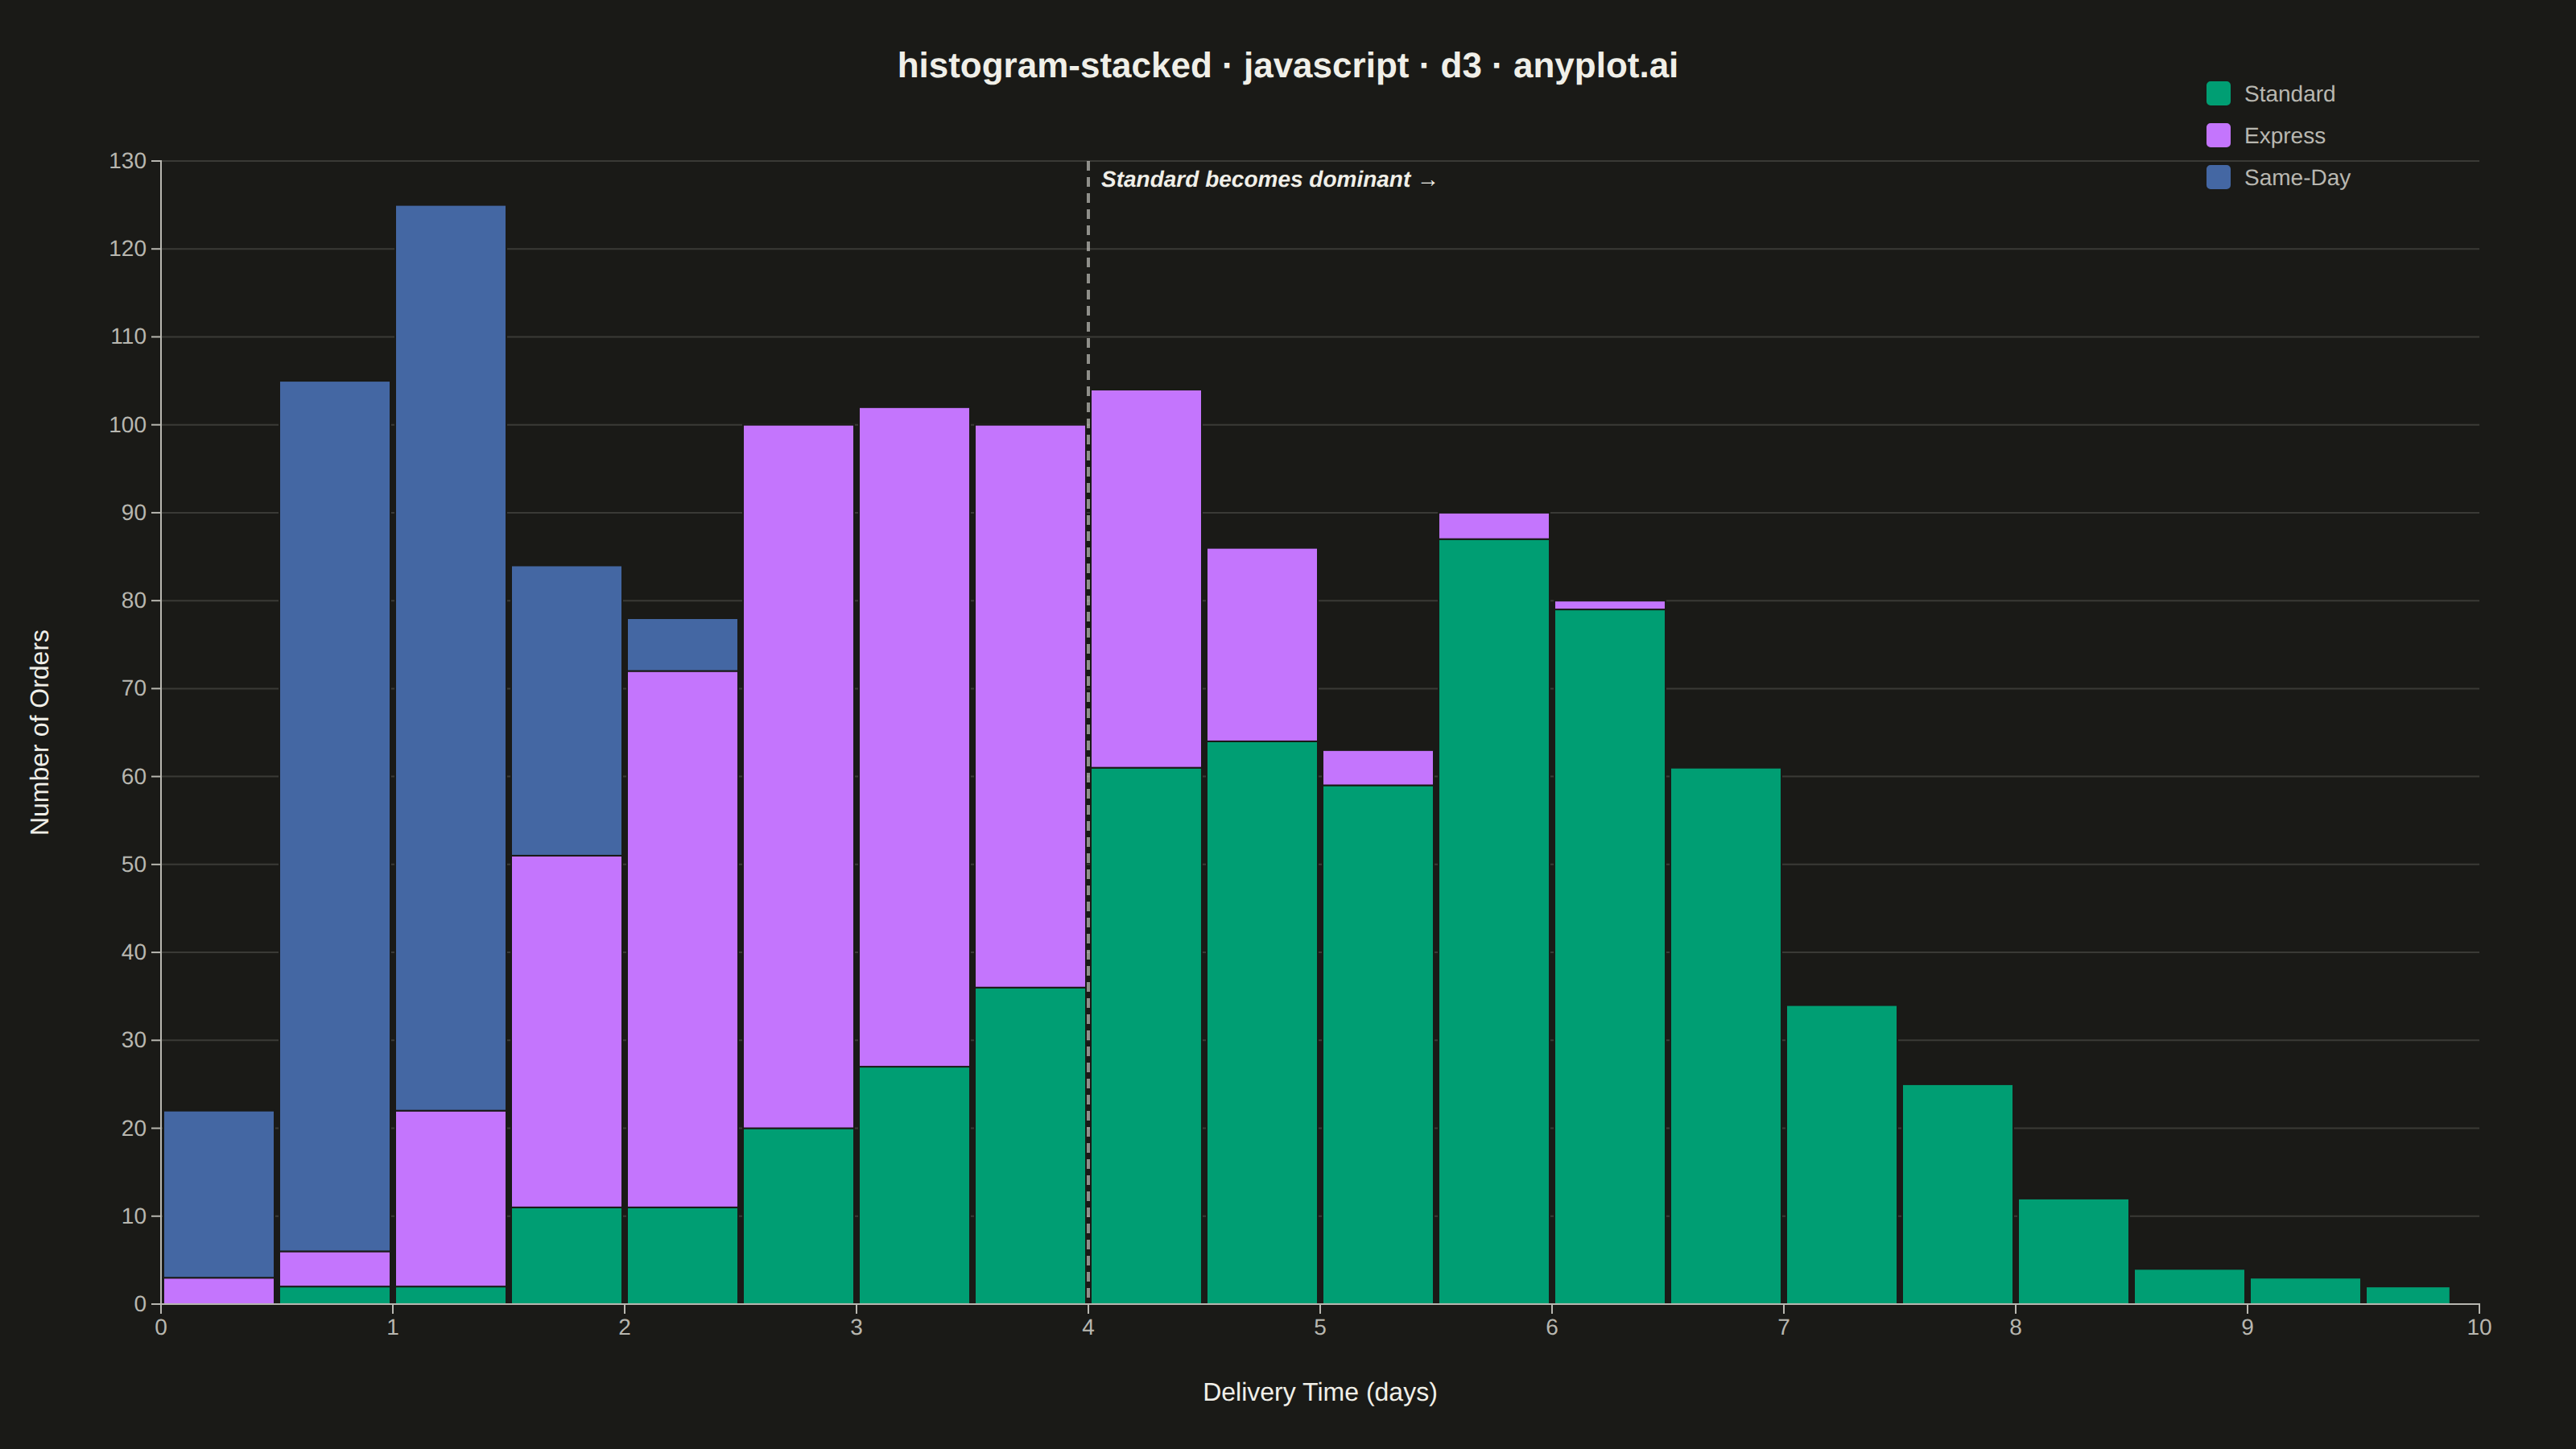
A histogram showing multiple groups stacked on top of each other within each bin. The total bar height represents the combined frequency, while colored segments show individual group contributions.
// anyplot.ai
// histogram-stacked: Stacked Histogram
// Library: d3 7.9.0 | JavaScript 22.23.2
// Quality: 92/100 | Created: 2026-09-05

const t = window.ANYPLOT_TOKENS;
const { width, height } = window.ANYPLOT_SIZE;
const margin = { top: 100, right: 60, bottom: 90, left: 100 };
const iw = width - margin.left - margin.right;
const ih = height - margin.top - margin.bottom;

// --- Data (in-memory, deterministic) ----------------------------------------
// Delivery time (days) for three shipping tiers, binned and stacked so the
// total bar height shows combined order volume with a per-tier breakdown.
function makeNormalSampler(seed) {
  let state = seed >>> 0;
  const rng = () => {
    state = (Math.imul(1103515245, state) + 12345) >>> 0;
    return state / 4294967296;
  };
  return () => {
    let u = 0;
    let v = 0;
    while (u === 0) u = rng();
    while (v === 0) v = rng();
    return Math.sqrt(-2 * Math.log(u)) * Math.cos(2 * Math.PI * v);
  };
}
const randNormal = makeNormalSampler(20260905);

const tiers = [
  { key: "Standard", n: 600, mean: 5.4, std: 1.6 },
  { key: "Express", n: 420, mean: 3.0, std: 1.0 },
  { key: "Same-Day", n: 260, mean: 1.1, std: 0.4 },
];
const groups = tiers.map((tier) => tier.key);
const valuesByGroup = {};
for (const tier of tiers) {
  valuesByGroup[tier.key] = Array.from({ length: tier.n }, () =>
    Math.max(0.1, tier.mean + tier.std * randNormal()),
  );
}
const allValues = groups.flatMap((g) => valuesByGroup[g]);
const maxValue = d3.max(allValues);

// --- Binning (shared edges across groups via a fixed domain + threshold count)
const bin = d3.bin().domain([0, maxValue]).thresholds(18);
const binsByGroup = {};
for (const g of groups) binsByGroup[g] = bin(valuesByGroup[g]);

const binData = binsByGroup[groups[0]].map((b, i) => {
  const row = { x0: b.x0, x1: b.x1 };
  for (const g of groups) row[g] = binsByGroup[g][i].length;
  return row;
});
const series = d3.stack().keys(groups)(binData);
const maxStack = d3.max(binData, (d) => groups.reduce((sum, g) => sum + d[g], 0));

// Composition-shift insight: the bin where "Standard" first overtakes the
// other tiers as the largest segment, i.e. where the stack flips from
// same-day-dominated to standard-dominated.
const dominantByBin = binData.map((row) => groups.reduce((best, g) => (row[g] > row[best] ? g : best), groups[0]));
const crossoverIdx = dominantByBin.findIndex((g, i) => g === "Standard" && dominantByBin[i - 1] !== "Standard");

// --- Scales -------------------------------------------------------------------
const x = d3.scaleLinear().domain([0, maxValue]).nice().range([0, iw]);
const y = d3.scaleLinear().domain([0, maxStack]).nice().range([ih, 0]);
const color = d3.scaleOrdinal().domain(groups).range(t.palette);

// --- SVG mount ------------------------------------------------------------
const svg = d3.select("#container").append("svg").attr("width", width).attr("height", height);
const g = svg.append("g").attr("transform", `translate(${margin.left},${margin.top})`);

// --- Gridlines (y-axis only, subtle) ------------------------------------------
g.append("g")
  .attr("class", "grid")
  .call(d3.axisLeft(y).tickSize(-iw).tickFormat(""))
  .call((sel) => sel.select(".domain").remove())
  .selectAll("line")
  .attr("stroke", t.grid);

// --- Bars ----------------------------------------------------------------
const barGap = 3;
const seriesGroups = g
  .selectAll(".series")
  .data(series)
  .join("g")
  .attr("class", "series")
  .attr("fill", (d) => color(d.key));
seriesGroups
  .selectAll("rect")
  .data((d) => d)
  .join("rect")
  .attr("x", (d) => x(d.data.x0) + barGap / 2)
  .attr("width", (d) => Math.max(0, x(d.data.x1) - x(d.data.x0) - barGap))
  .attr("y", (d) => y(d[1]))
  .attr("height", (d) => y(d[0]) - y(d[1]))
  .attr("stroke", t.pageBg)
  .attr("stroke-width", 1);

// --- Composition-shift callout (visual-hierarchy emphasis) -----------------
if (crossoverIdx !== -1) {
  const cx = x(binData[crossoverIdx].x0);
  const labelOnLeft = cx > iw * 0.6;
  g.append("line")
    .attr("x1", cx)
    .attr("x2", cx)
    .attr("y1", 0)
    .attr("y2", ih)
    .attr("stroke", t.ink)
    .attr("stroke-width", 2)
    .attr("stroke-dasharray", "6,4")
    .attr("opacity", 0.55);
  g.append("text")
    .attr("x", cx + (labelOnLeft ? -8 : 8))
    .attr("y", 16)
    .attr("text-anchor", labelOnLeft ? "end" : "start")
    .attr("fill", t.ink)
    .style("font-size", "14px")
    .style("font-weight", "600")
    .style("font-style", "italic")
    .text(labelOnLeft ? "← Standard becomes dominant" : "Standard becomes dominant →");
}

// --- Axes ----------------------------------------------------------------
const xAxis = g.append("g").attr("transform", `translate(0,${ih})`).call(d3.axisBottom(x).ticks(9));
const yAxis = g.append("g").call(d3.axisLeft(y));
for (const ax of [xAxis, yAxis]) {
  ax.selectAll("text").attr("fill", t.inkSoft).style("font-size", "14px");
  ax.selectAll("line").attr("stroke", t.inkSoft);
  ax.select(".domain").attr("stroke", t.inkSoft);
}

// --- Axis labels -----------------------------------------------------------
g.append("text")
  .attr("x", iw / 2)
  .attr("y", ih + 60)
  .attr("text-anchor", "middle")
  .attr("fill", t.ink)
  .style("font-size", "16px")
  .text("Delivery Time (days)");

g.append("text")
  .attr("transform", "rotate(-90)")
  .attr("x", -ih / 2)
  .attr("y", -70)
  .attr("text-anchor", "middle")
  .attr("fill", t.ink)
  .style("font-size", "16px")
  .text("Number of Orders");

// --- Legend (top-right, ordered to match stack) -----------------------------
// Hovering a legend row highlights its segment across every bin (leveraging
// the interactive HTML export, not just the static screenshot).
const legend = svg.append("g").attr("transform", `translate(${width - margin.right - 170},${margin.top - 50})`);
groups.forEach((name, i) => {
  const row = legend.append("g").attr("transform", `translate(0,${i * 26})`).style("cursor", "pointer");
  row
    .append("rect")
    .attr("width", 16)
    .attr("height", 16)
    .attr("rx", 3)
    .attr("ry", 3)
    .attr("fill", color(name))
    .attr("stroke", t.pageBg)
    .attr("stroke-width", 1);
  row
    .append("text")
    .attr("x", 24)
    .attr("y", 13)
    .attr("fill", t.inkSoft)
    .style("font-size", "14px")
    .text(name);
  row
    .on("mouseenter", () => seriesGroups.attr("opacity", (d) => (d.key === name ? 1 : 0.25)))
    .on("mouseleave", () => seriesGroups.attr("opacity", 1));
});

// --- Title -------------------------------------------------------------------
svg
  .append("text")
  .attr("x", width / 2)
  .attr("y", 48)
  .attr("text-anchor", "middle")
  .attr("fill", t.ink)
  .style("font-size", "22px")
  .style("font-weight", "600")
  .text("histogram-stacked · javascript · d3 · anyplot.ai");
Runnable source as JSON, for any HTTP client: https://api.anyplot.ai/specs/histogram-stacked/d3/code. Any spec id and library id listed in llms-full.txt fit the same URL shape; every URL below is complete and callable.
{
  "spec_id": "histogram-stacked",
  "language": "javascript",
  "library": "d3",
  "page": "https://anyplot.ai/histogram-stacked/javascript/d3",
  "hub": "https://anyplot.ai/histogram-stacked",
  "code_json": "https://api.anyplot.ai/specs/histogram-stacked/d3/code",
  "spec_json": "https://api.anyplot.ai/specs/histogram-stacked",
  "render_light_png": "https://storage.googleapis.com/anyplot-images/plots/histogram-stacked/javascript/d3/plot-light.png",
  "render_dark_png": "https://storage.googleapis.com/anyplot-images/plots/histogram-stacked/javascript/d3/plot-dark.png",
  "interactive_light_html": "https://storage.googleapis.com/anyplot-images/plots/histogram-stacked/javascript/d3/plot-light.html",
  "interactive_dark_html": "https://storage.googleapis.com/anyplot-images/plots/histogram-stacked/javascript/d3/plot-dark.html",
  "quality_score": 92.0,
  "license": "MIT",
  "guide": "https://anyplot.ai/llms.txt"
}
Part of Stacked Histogram on anyplot.ai.